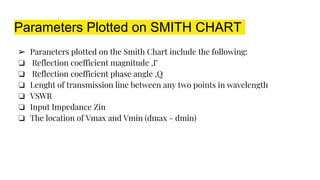
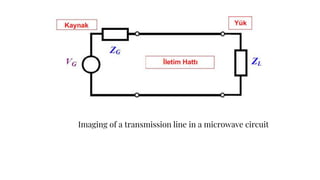
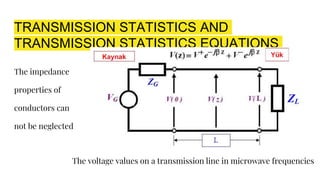
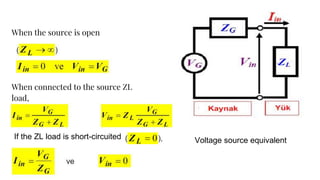
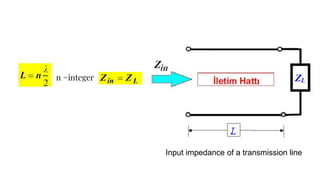
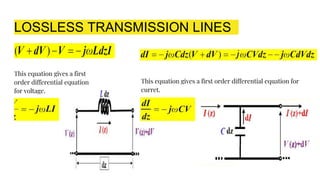
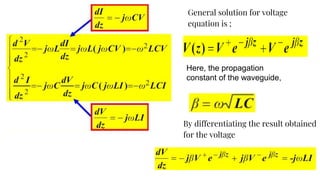
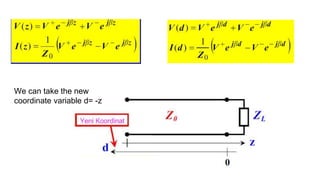
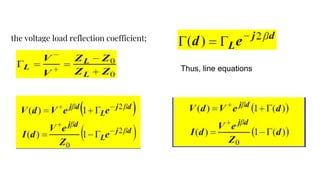
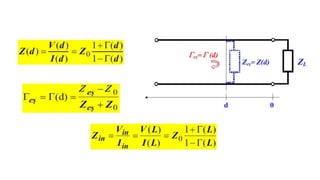
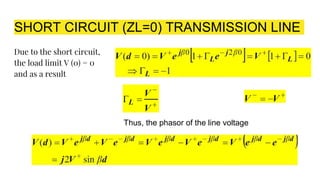
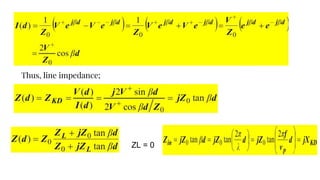
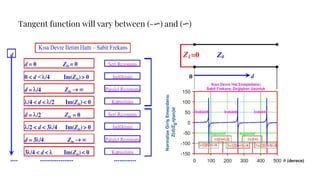
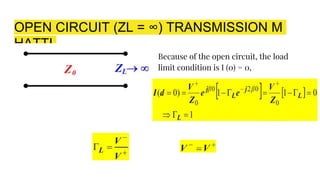
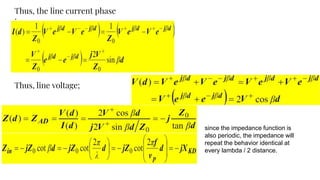
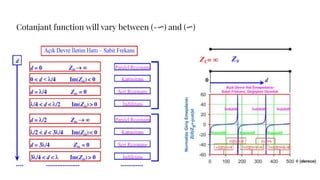
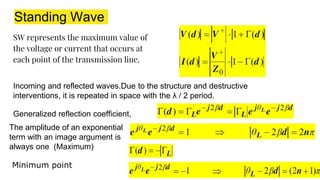
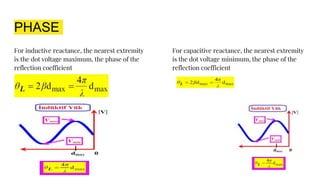
The Complex
Reflection Coefficient
Parameters Plotted on SMITH CHART
➢ Paraneters plotted on the Smith Chart include the following:
❏ Reflection coefficient magnitude ,Γ
❏ Reflection coefficient phase angle ,Q
❏ Lenght of transmission line between any two points in wavelength
❏ VSWR
❏ Input Impedance Zin
❏ The location of Vmax and Vmin (dmax - dmin)
Imaging of a transmission line in a microwave circuit
TRANSMISSION STATISTICS AND
TRANSMISSION STATISTICS EQUATIONS
The impedance
properties of
conductors can
not be neglected
The voltage values on a transmission line in microwave frequencies
When the source is open
When connected to the source ZL
load,
Voltage source equivalentIf the ZL load is short-circuited
n =integer
Input impedance of a transmission line
LOSSLESS TRANSMISSION LINES
This equation gives a first
order differential equation
for voltage.
This equation gives a first order differential equation for
curret.
General solution for voltage
equation is ;
Here, the propagation
constant of the waveguide,
By differentiating the result obtained
for the voltage
We can take the new
coordinate variable d= -z
the voltage load reflection coefficient;
Thus, line equations
SHORT CIRCUIT (ZL=0) TRANSMISSION LINE
Due to the short circuit,
the load limit V (0) = 0
and as a result
Thus, the phasor of the line voltage
Thus, line impedance;
ZL = 0
Tangent function will vary between (-∞) and (∞)
OPEN CIRCUIT (ZL = ∞) TRANSMISSION M
HATTI
Because of the open circuit, the load
limit condition is I (0) = 0,
Thus, the line current phase
image
Thus, line voltage;
since the impedance function is
also periodic, the impedance will
repeat the behavior identical at
every lambda / 2 distance.
Cotanjant function will vary between (-∞) and (∞)
Standing Wave
SW represents the maximum value of
the voltage or current that occurs at
each point of the transmission line.
Incoming and reflected waves.Due to the structure and destructive
interventions, it is repeated in space with the λ / 2 period.
Generalized reflection coefficient,
The amplitude of an exponential
term with an image argument is
always one (Maximum)
Minimum point
( ZL=Z0)
If the load impedance is real and
ZL> Z0, the VDD pattern starts with
a maximum at load
If the load impedance is real and Z
<Z0, the VDD pattern begins with a
minimum of load
VSWR(VOLATGE STANDING WAVE)
That is, an indicator of maximum energy transfer and is denoted by the letter S.
If the load impedance is perfectly matched to the transmission line;
If the load is terminated by short circuit, open circuit or pure reactance
PHASE
For inductive reactance, the nearest extremity
is the dot voltage maximum, the phase of the
reflection coefficient
For capacitive reactance, the nearest extremity
is the dot voltage minimum, the phase of the
reflection coefficient
The complex reflection coefficient

The complex reflection coefficient

  • 1.
  • 2.
    Parameters Plotted onSMITH CHART ➢ Paraneters plotted on the Smith Chart include the following: ❏ Reflection coefficient magnitude ,Γ ❏ Reflection coefficient phase angle ,Q ❏ Lenght of transmission line between any two points in wavelength ❏ VSWR ❏ Input Impedance Zin ❏ The location of Vmax and Vmin (dmax - dmin)
  • 3.
    Imaging of atransmission line in a microwave circuit
  • 4.
    TRANSMISSION STATISTICS AND TRANSMISSIONSTATISTICS EQUATIONS The impedance properties of conductors can not be neglected The voltage values on a transmission line in microwave frequencies
  • 5.
    When the sourceis open When connected to the source ZL load, Voltage source equivalentIf the ZL load is short-circuited
  • 6.
    n =integer Input impedanceof a transmission line
  • 7.
    LOSSLESS TRANSMISSION LINES Thisequation gives a first order differential equation for voltage. This equation gives a first order differential equation for curret.
  • 8.
    General solution forvoltage equation is ; Here, the propagation constant of the waveguide, By differentiating the result obtained for the voltage
  • 9.
    We can takethe new coordinate variable d= -z
  • 10.
    the voltage loadreflection coefficient; Thus, line equations
  • 12.
    SHORT CIRCUIT (ZL=0)TRANSMISSION LINE Due to the short circuit, the load limit V (0) = 0 and as a result Thus, the phasor of the line voltage
  • 13.
  • 14.
    Tangent function willvary between (-∞) and (∞)
  • 15.
    OPEN CIRCUIT (ZL= ∞) TRANSMISSION M HATTI Because of the open circuit, the load limit condition is I (0) = 0,
  • 16.
    Thus, the linecurrent phase image Thus, line voltage; since the impedance function is also periodic, the impedance will repeat the behavior identical at every lambda / 2 distance.
  • 17.
    Cotanjant function willvary between (-∞) and (∞)
  • 18.
    Standing Wave SW representsthe maximum value of the voltage or current that occurs at each point of the transmission line. Incoming and reflected waves.Due to the structure and destructive interventions, it is repeated in space with the λ / 2 period. Generalized reflection coefficient, The amplitude of an exponential term with an image argument is always one (Maximum) Minimum point
  • 19.
    ( ZL=Z0) If theload impedance is real and ZL> Z0, the VDD pattern starts with a maximum at load If the load impedance is real and Z <Z0, the VDD pattern begins with a minimum of load
  • 21.
    VSWR(VOLATGE STANDING WAVE) Thatis, an indicator of maximum energy transfer and is denoted by the letter S. If the load impedance is perfectly matched to the transmission line; If the load is terminated by short circuit, open circuit or pure reactance
  • 22.
    PHASE For inductive reactance,the nearest extremity is the dot voltage maximum, the phase of the reflection coefficient For capacitive reactance, the nearest extremity is the dot voltage minimum, the phase of the reflection coefficient