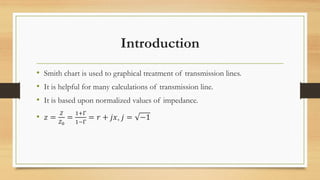
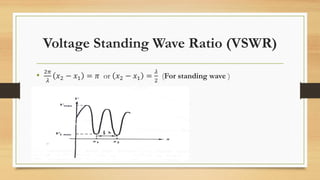
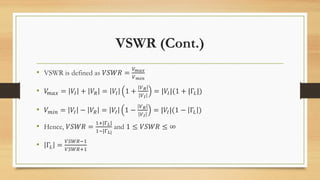
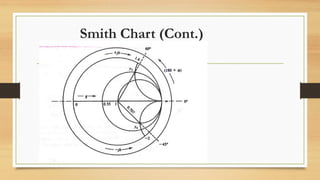
This document provides an introduction and overview of the Smith Chart, which is a graphical tool used for calculations involving transmission lines. It discusses key concepts such as characteristic impedance, voltage reflection coefficient, voltage standing wave ratio (VSWR), and how measurements of impedance and other parameters can be analyzed at different distances from the load on a transmission line. The Smith Chart allows normalized impedance values to be easily plotted and visualized, facilitating calculations related to transmission line matching and design.