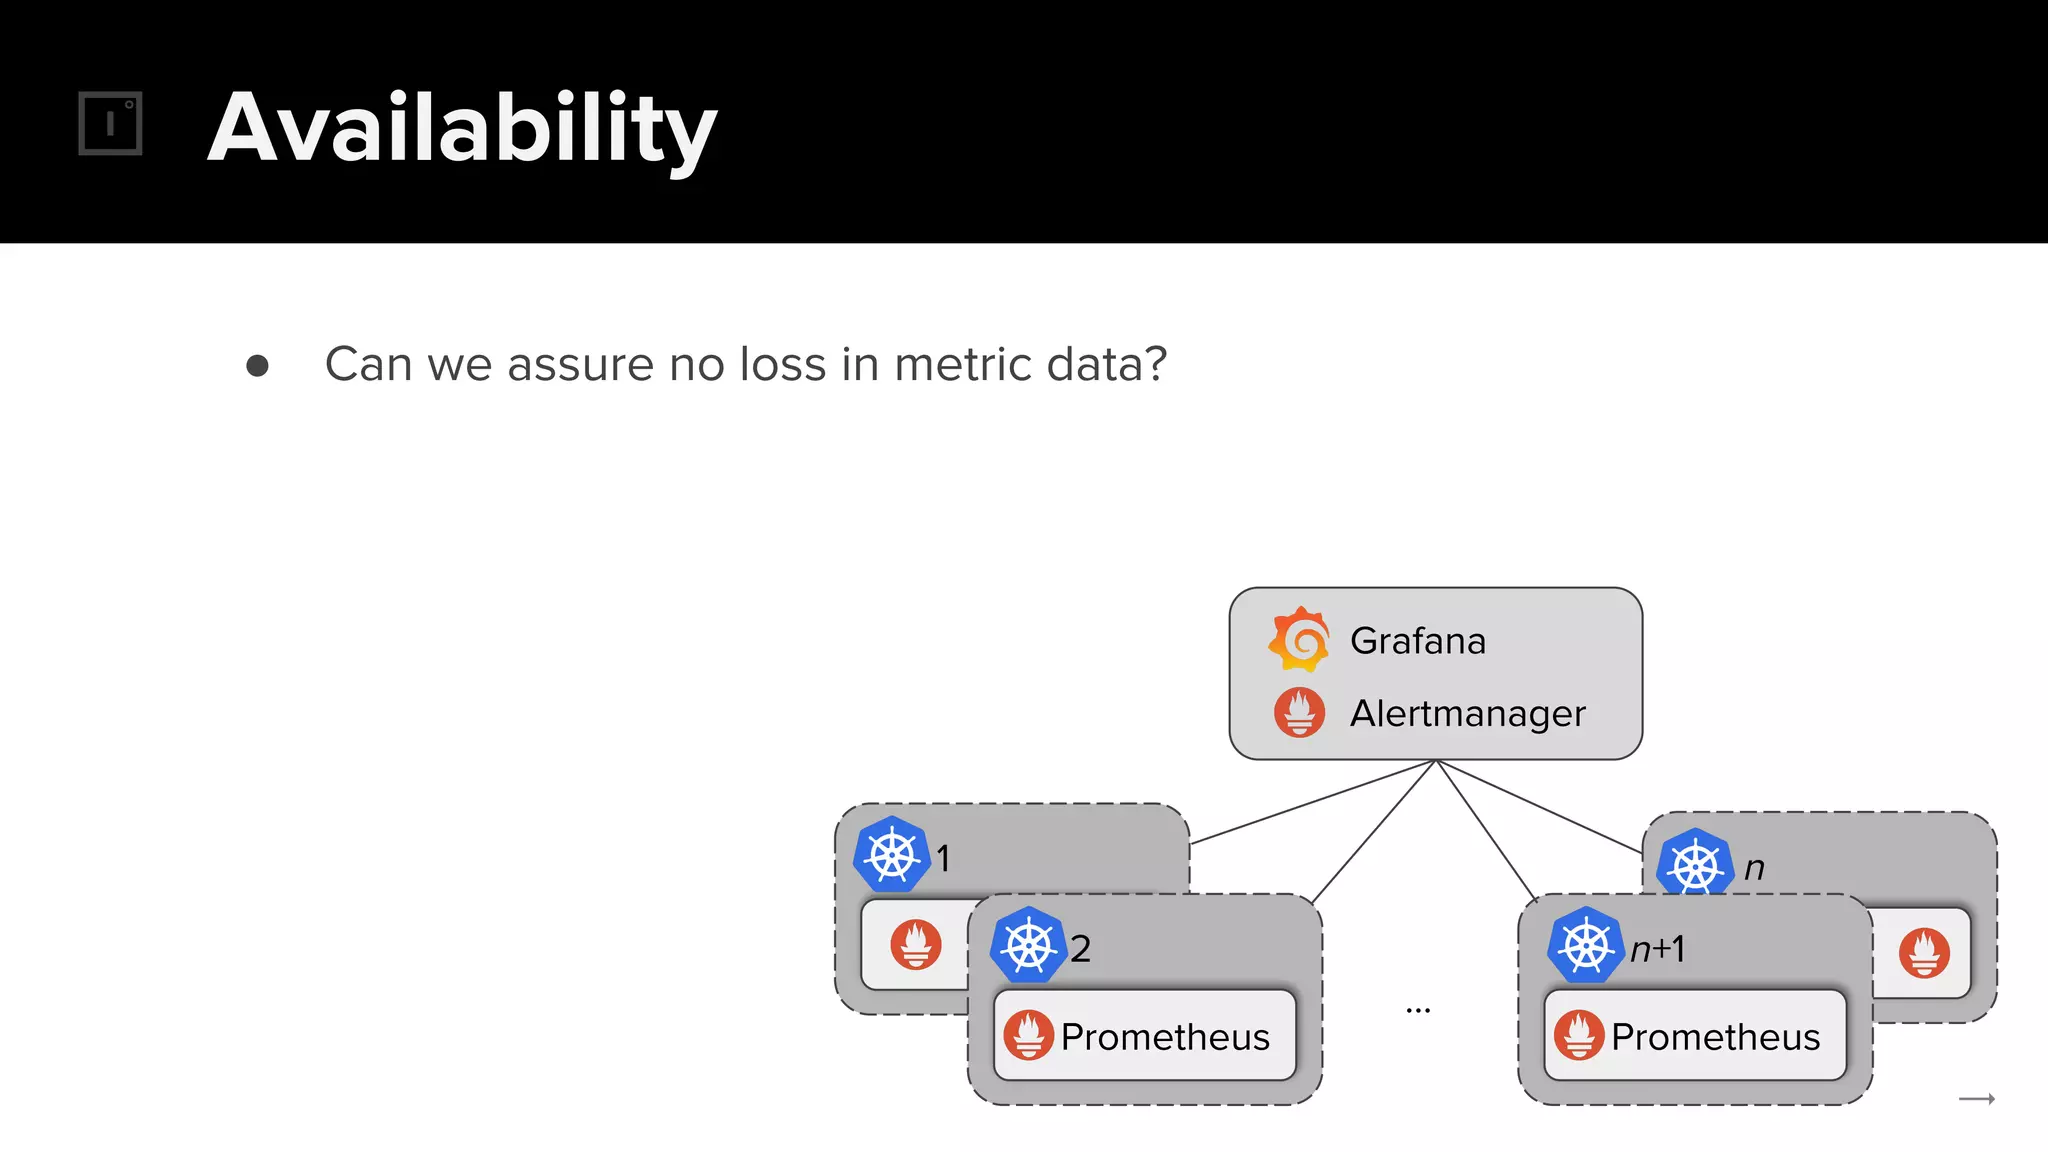
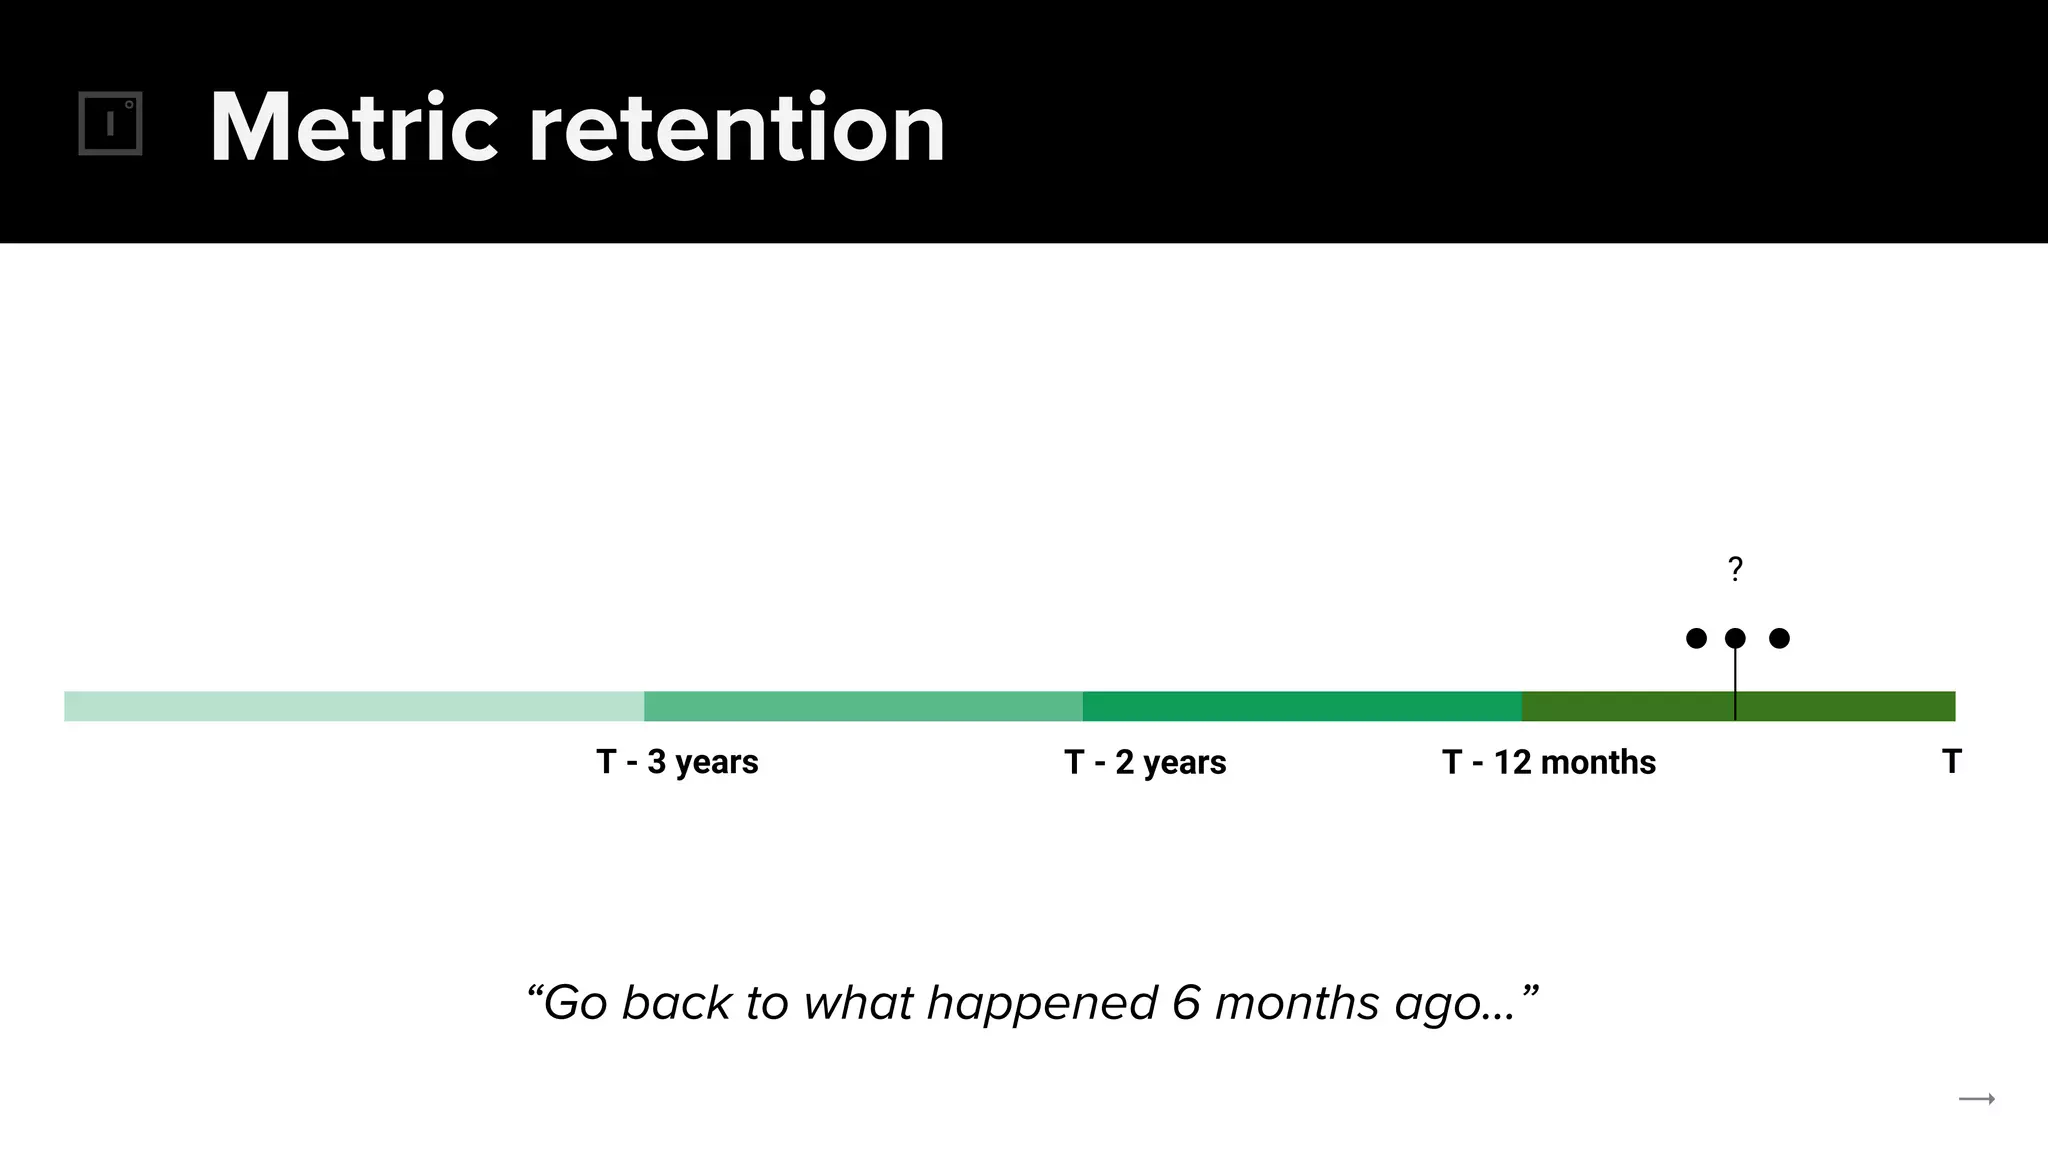
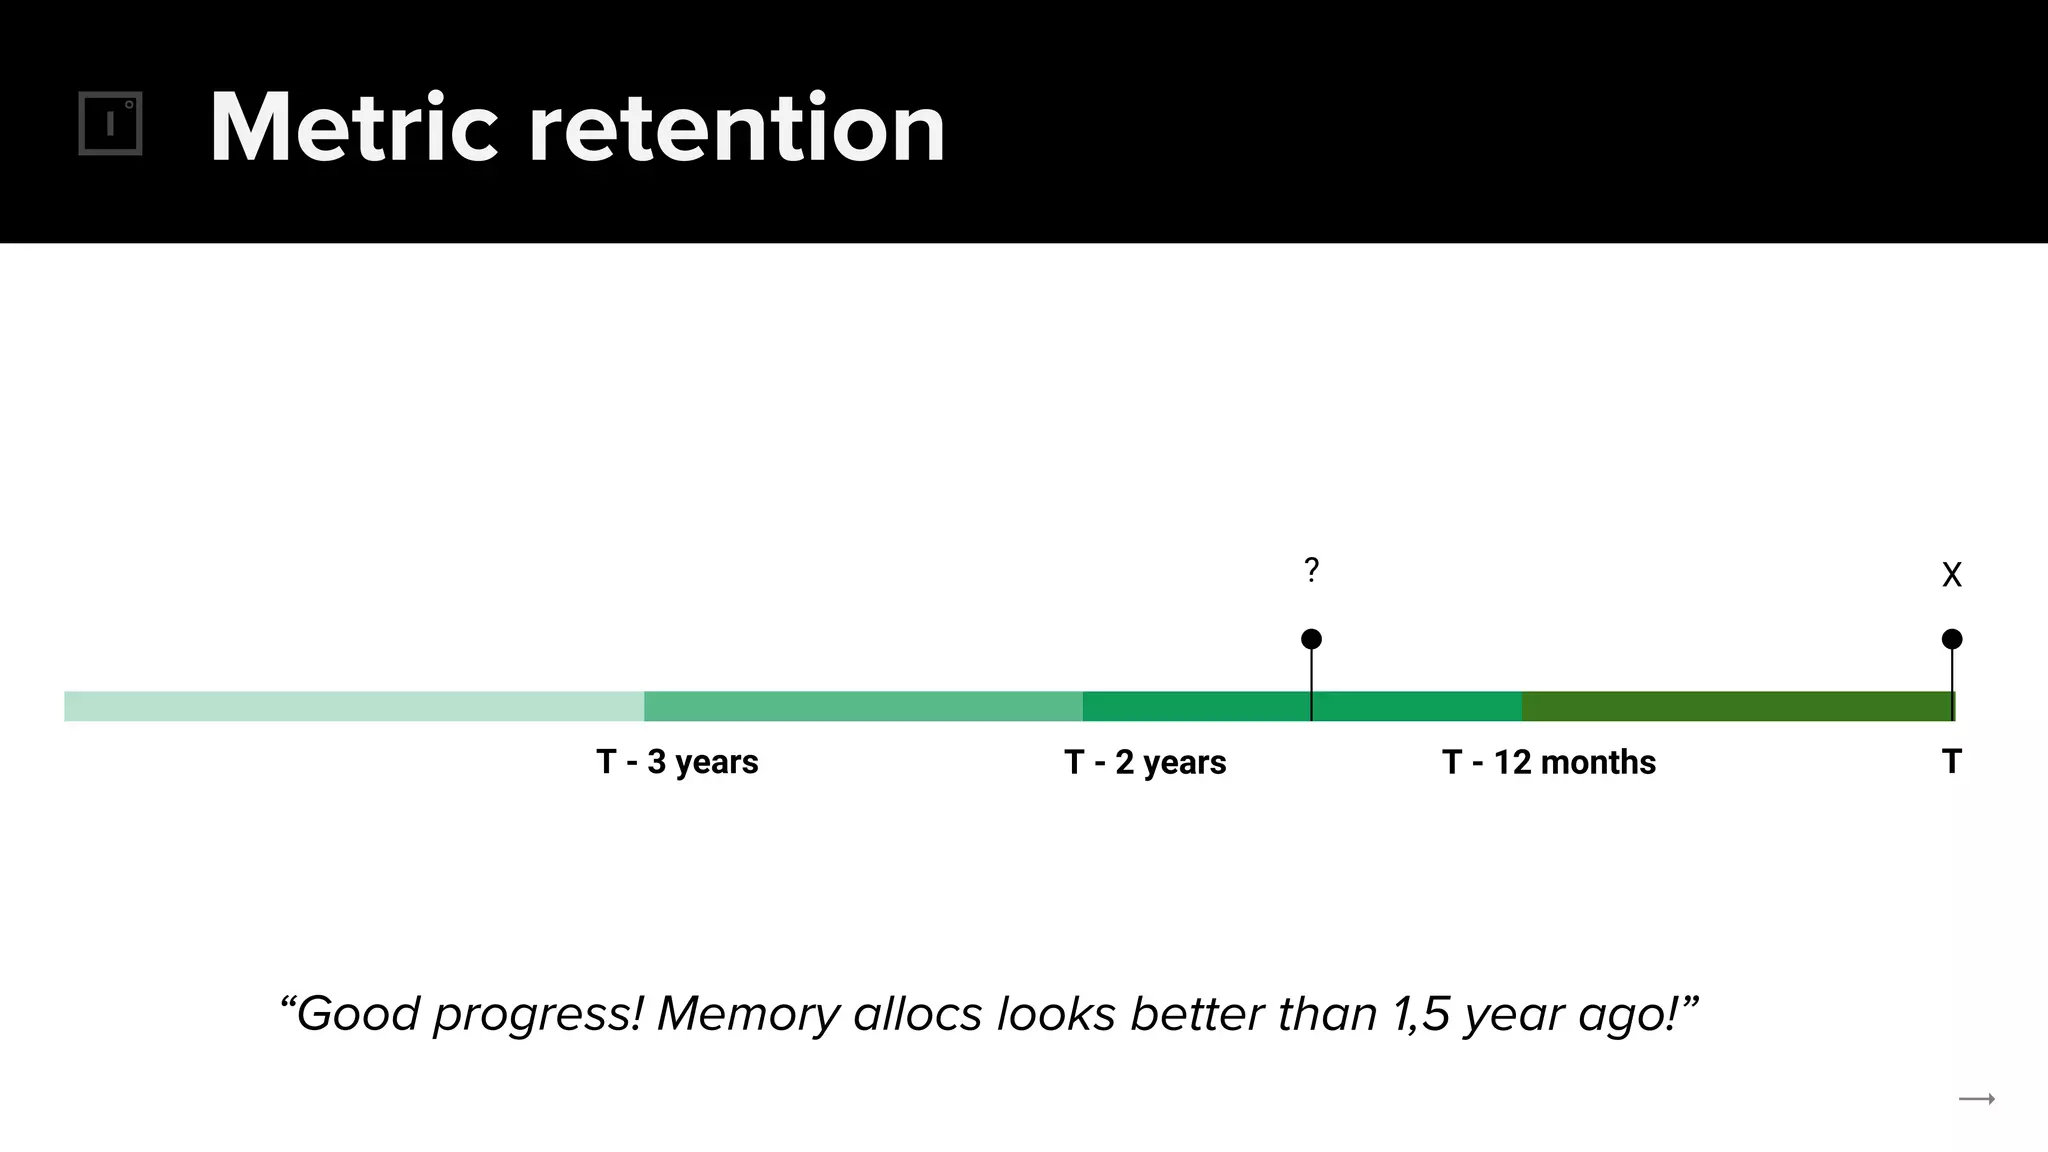
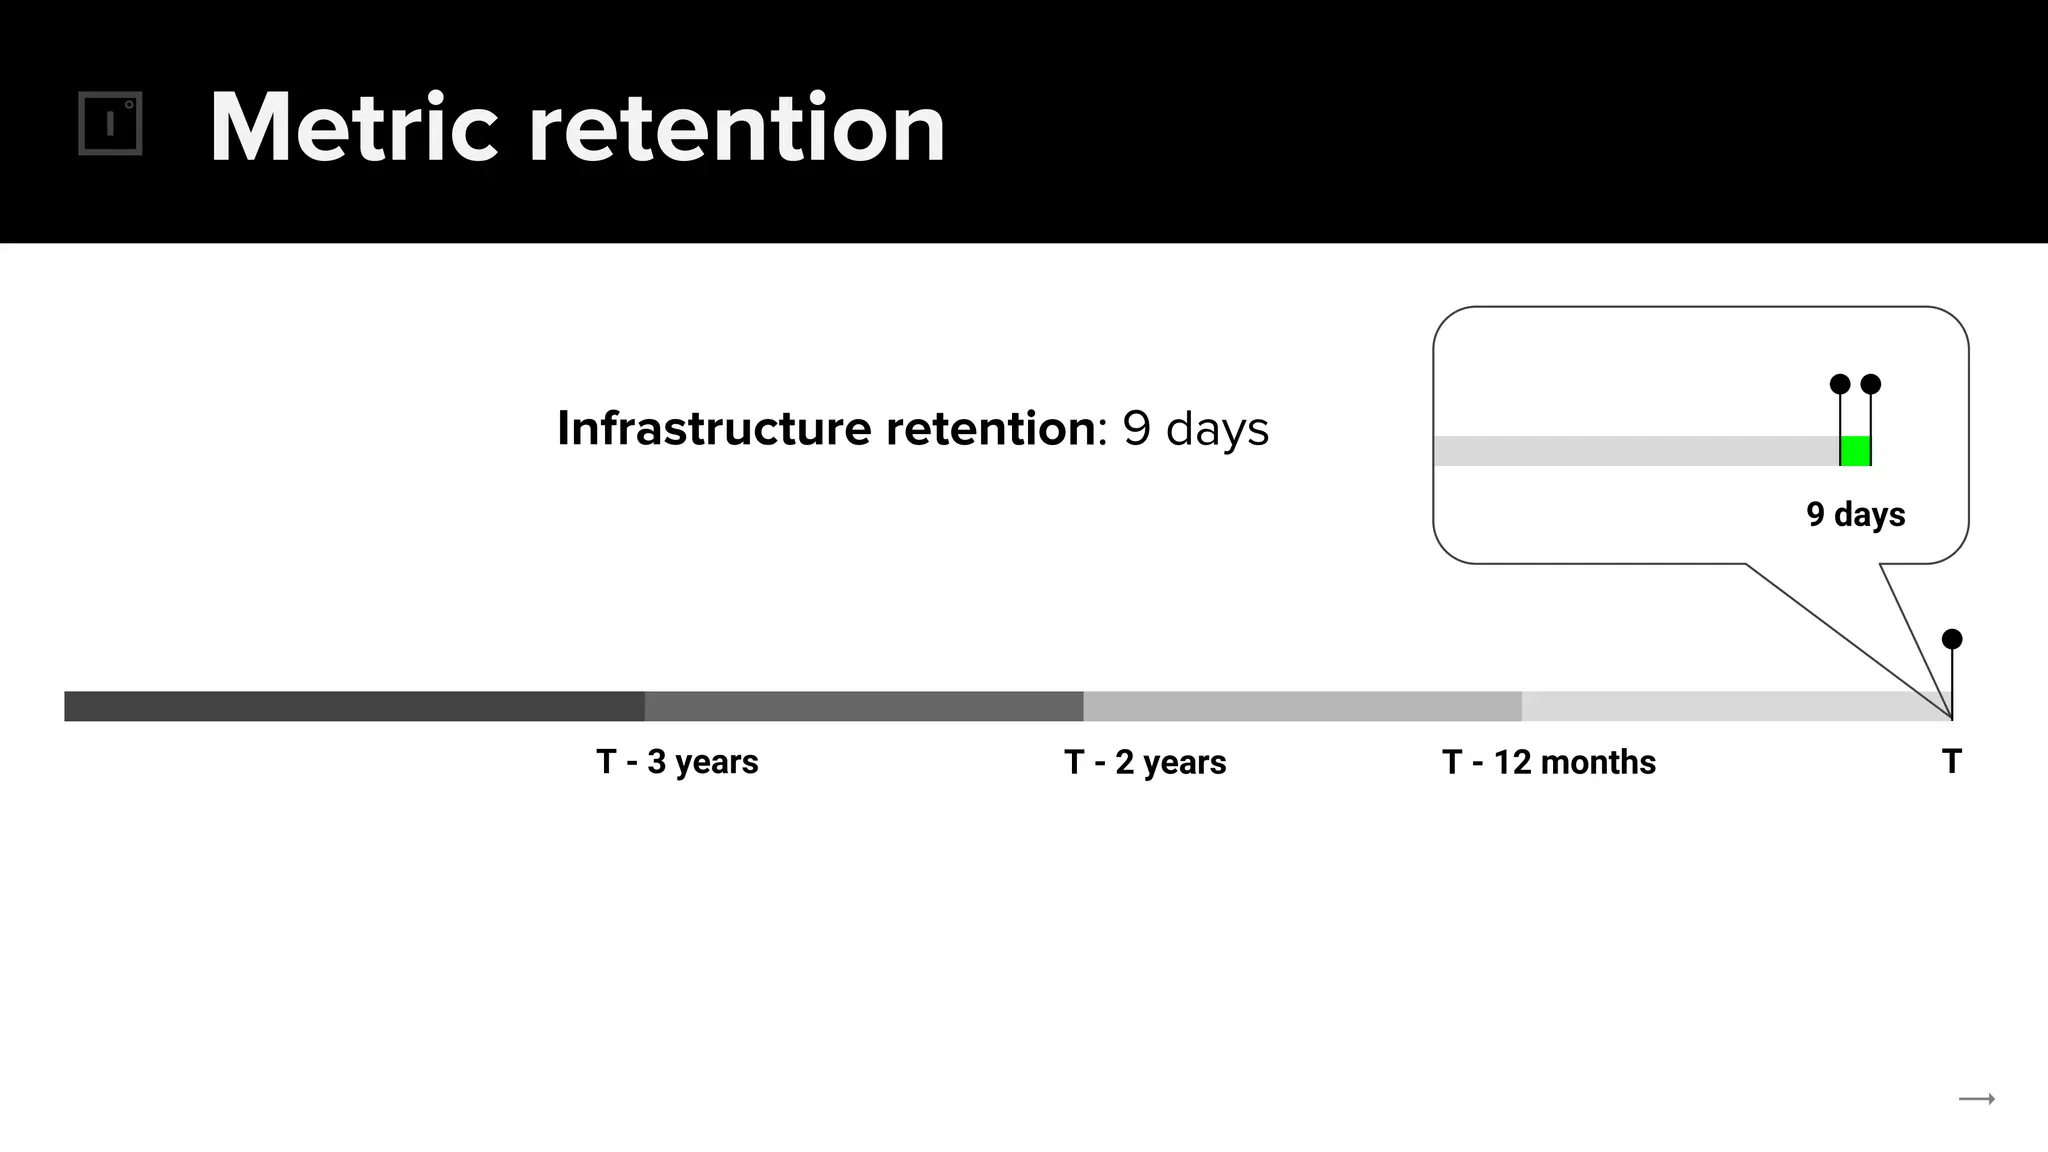
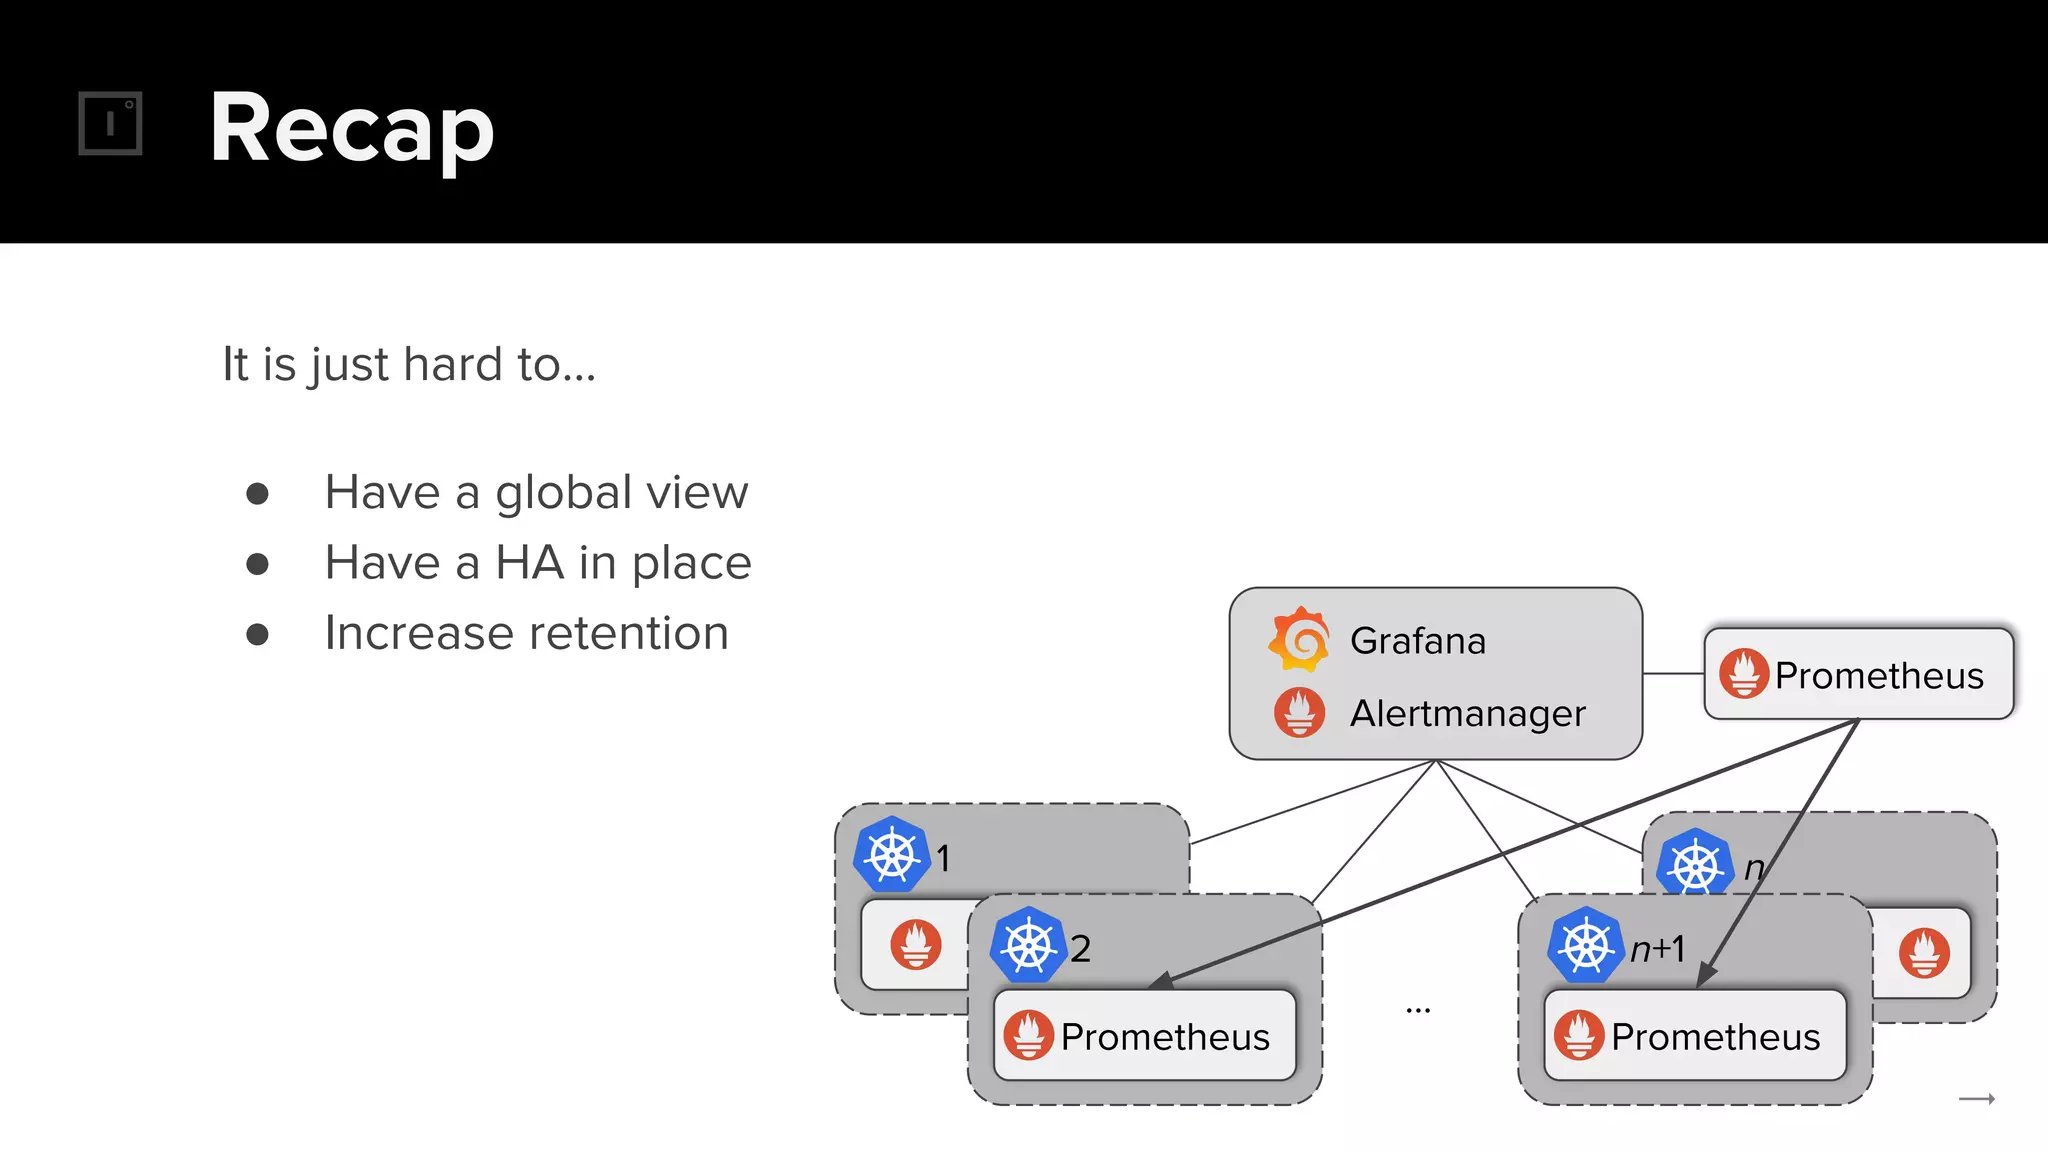
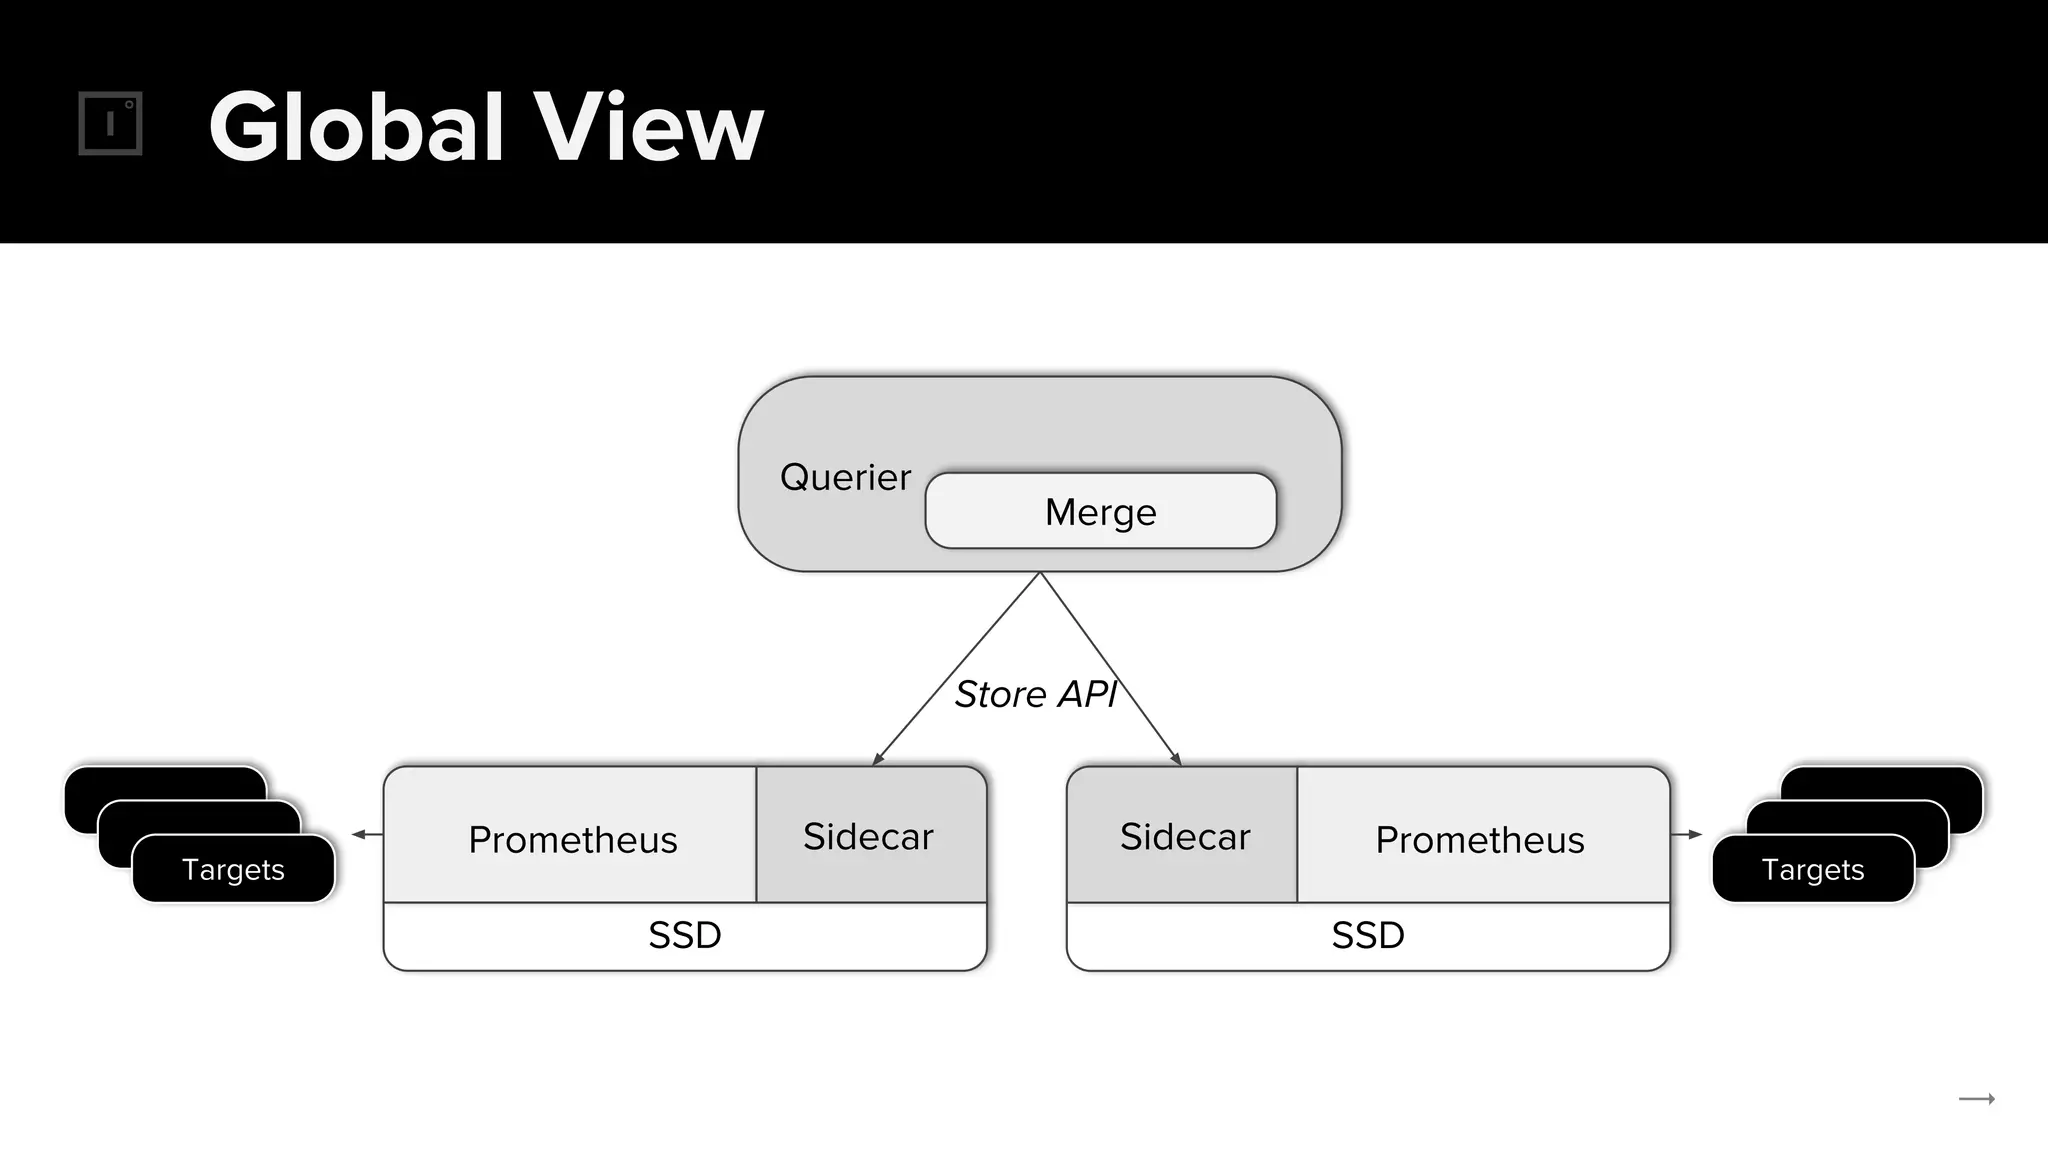
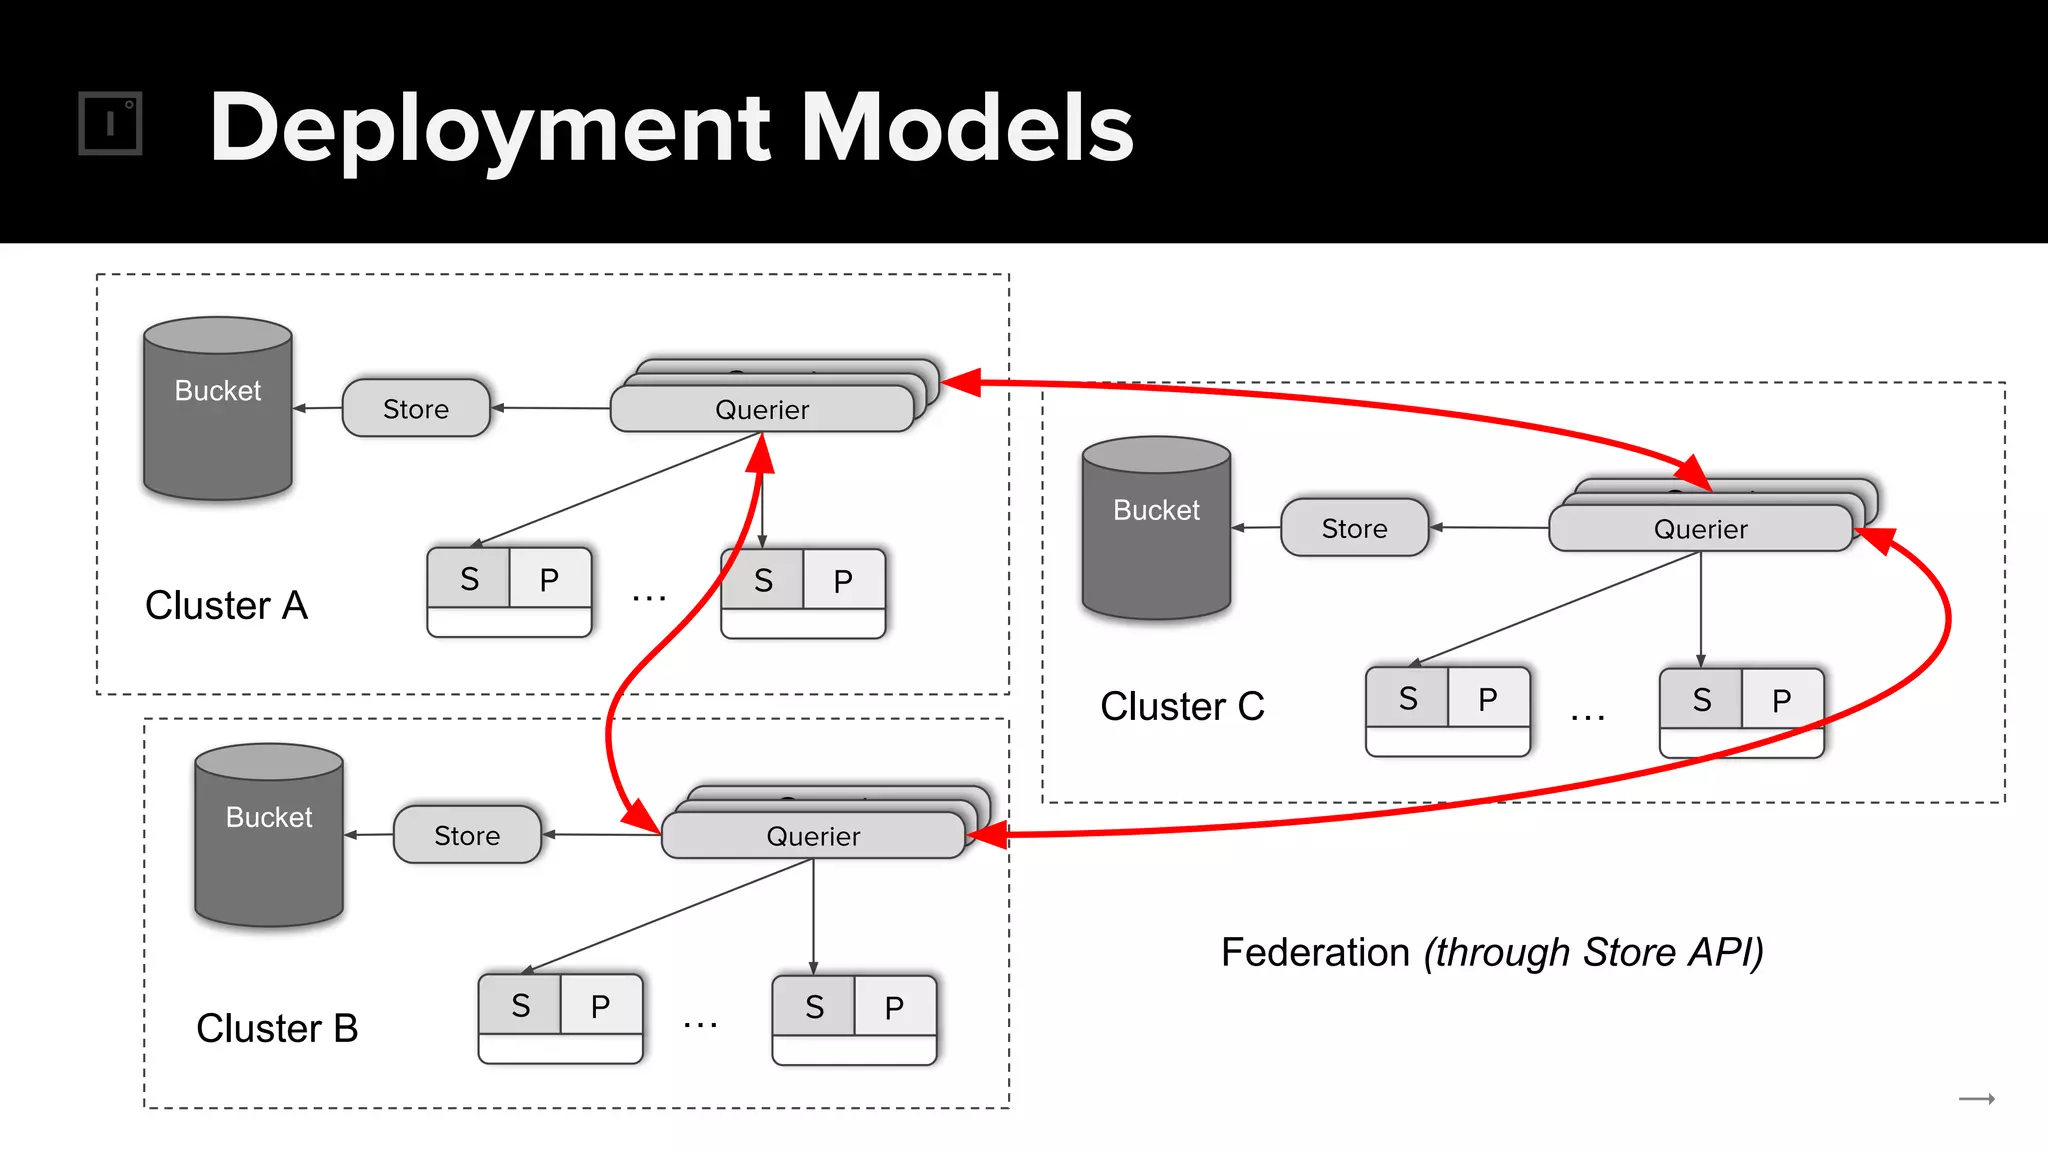
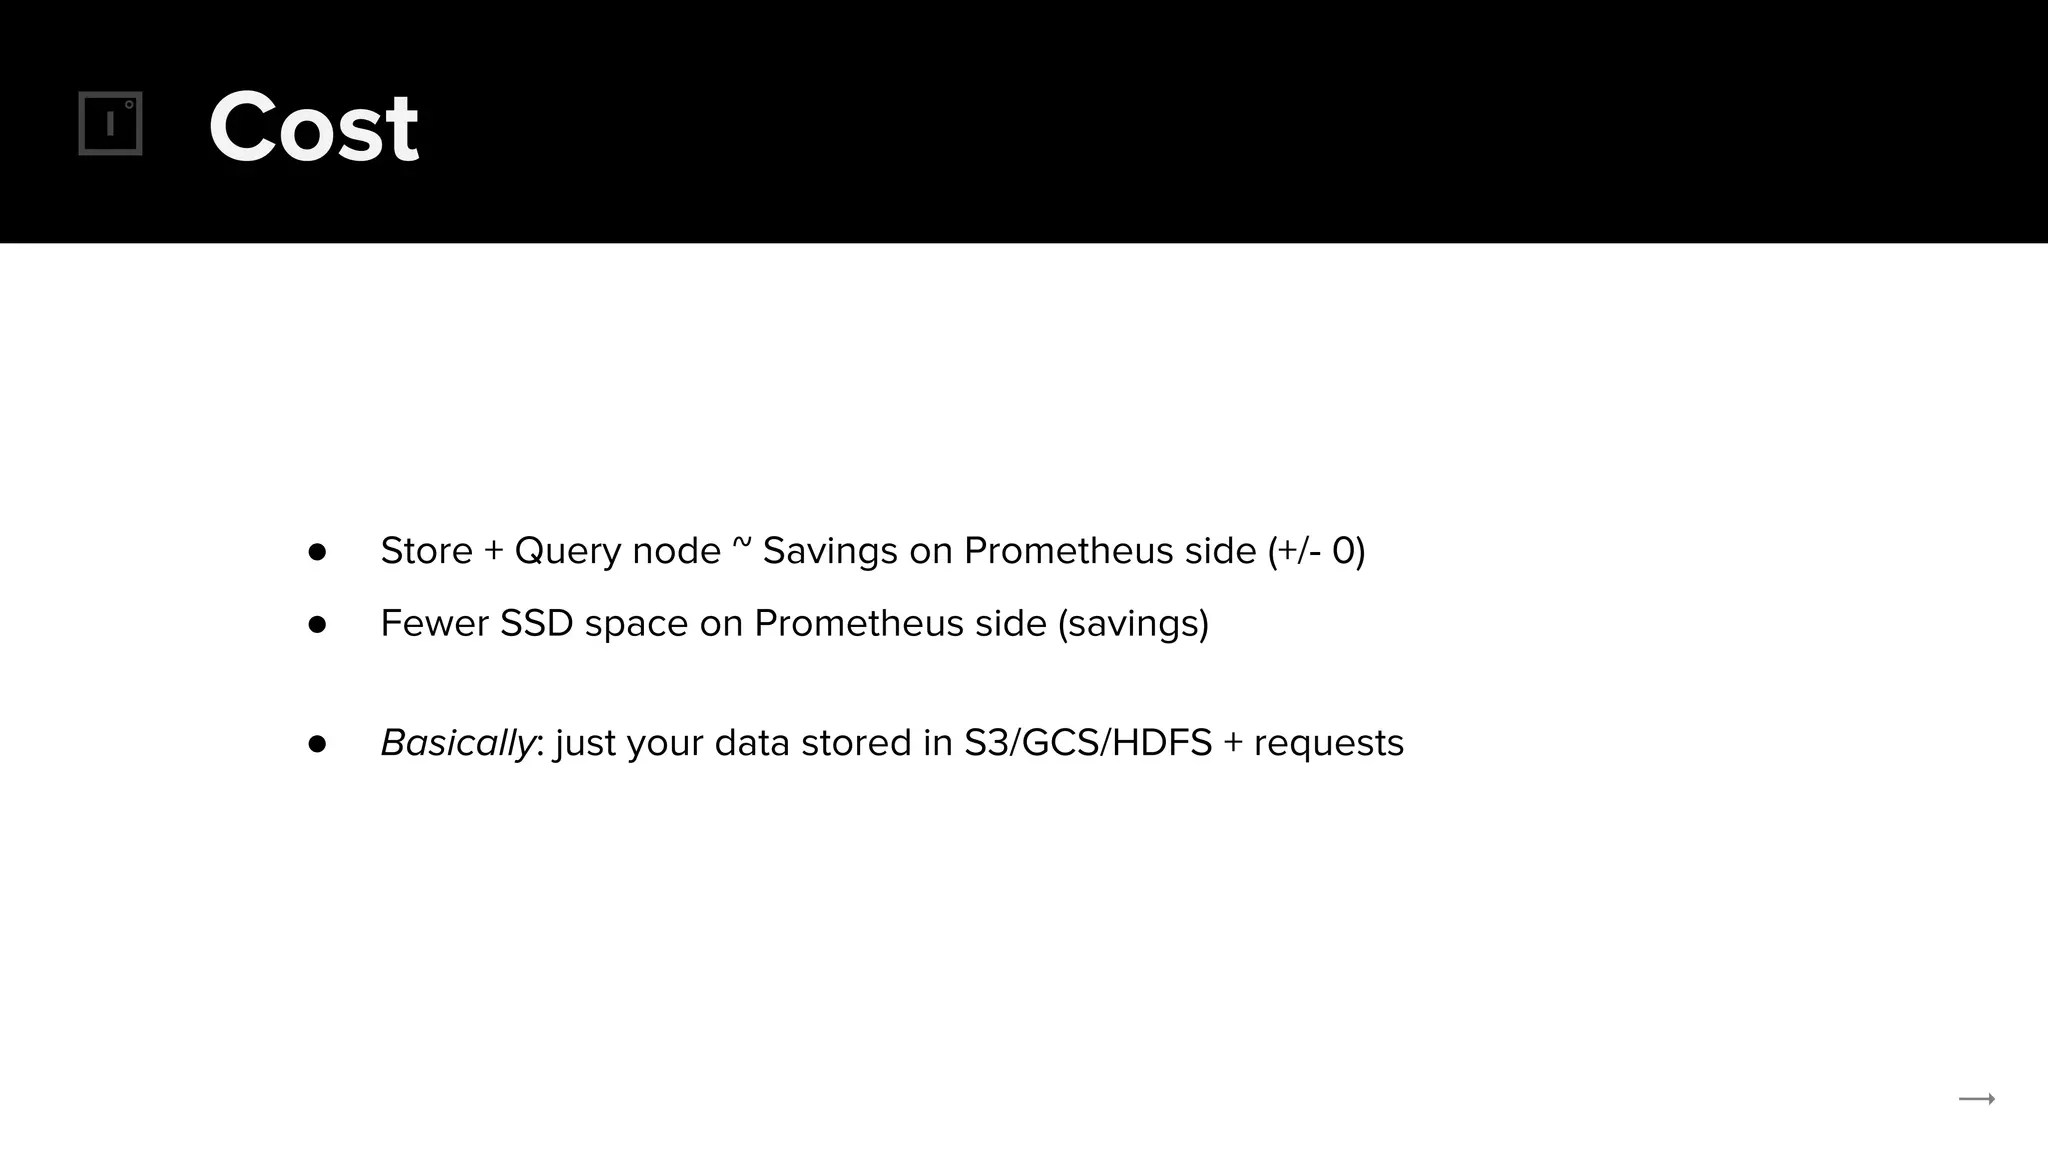
The document discusses the challenges and solutions related to implementing Prometheus monitoring at scale, focusing on aspects like global views, high availability, and long-term metric retention. It highlights the use of Thanos for enhancing Prometheus, enabling features such as data aggregation, downsampling, and cost-efficient storage solutions. Additionally, it provides examples and deployment models to optimize performance and reduce operational costs.


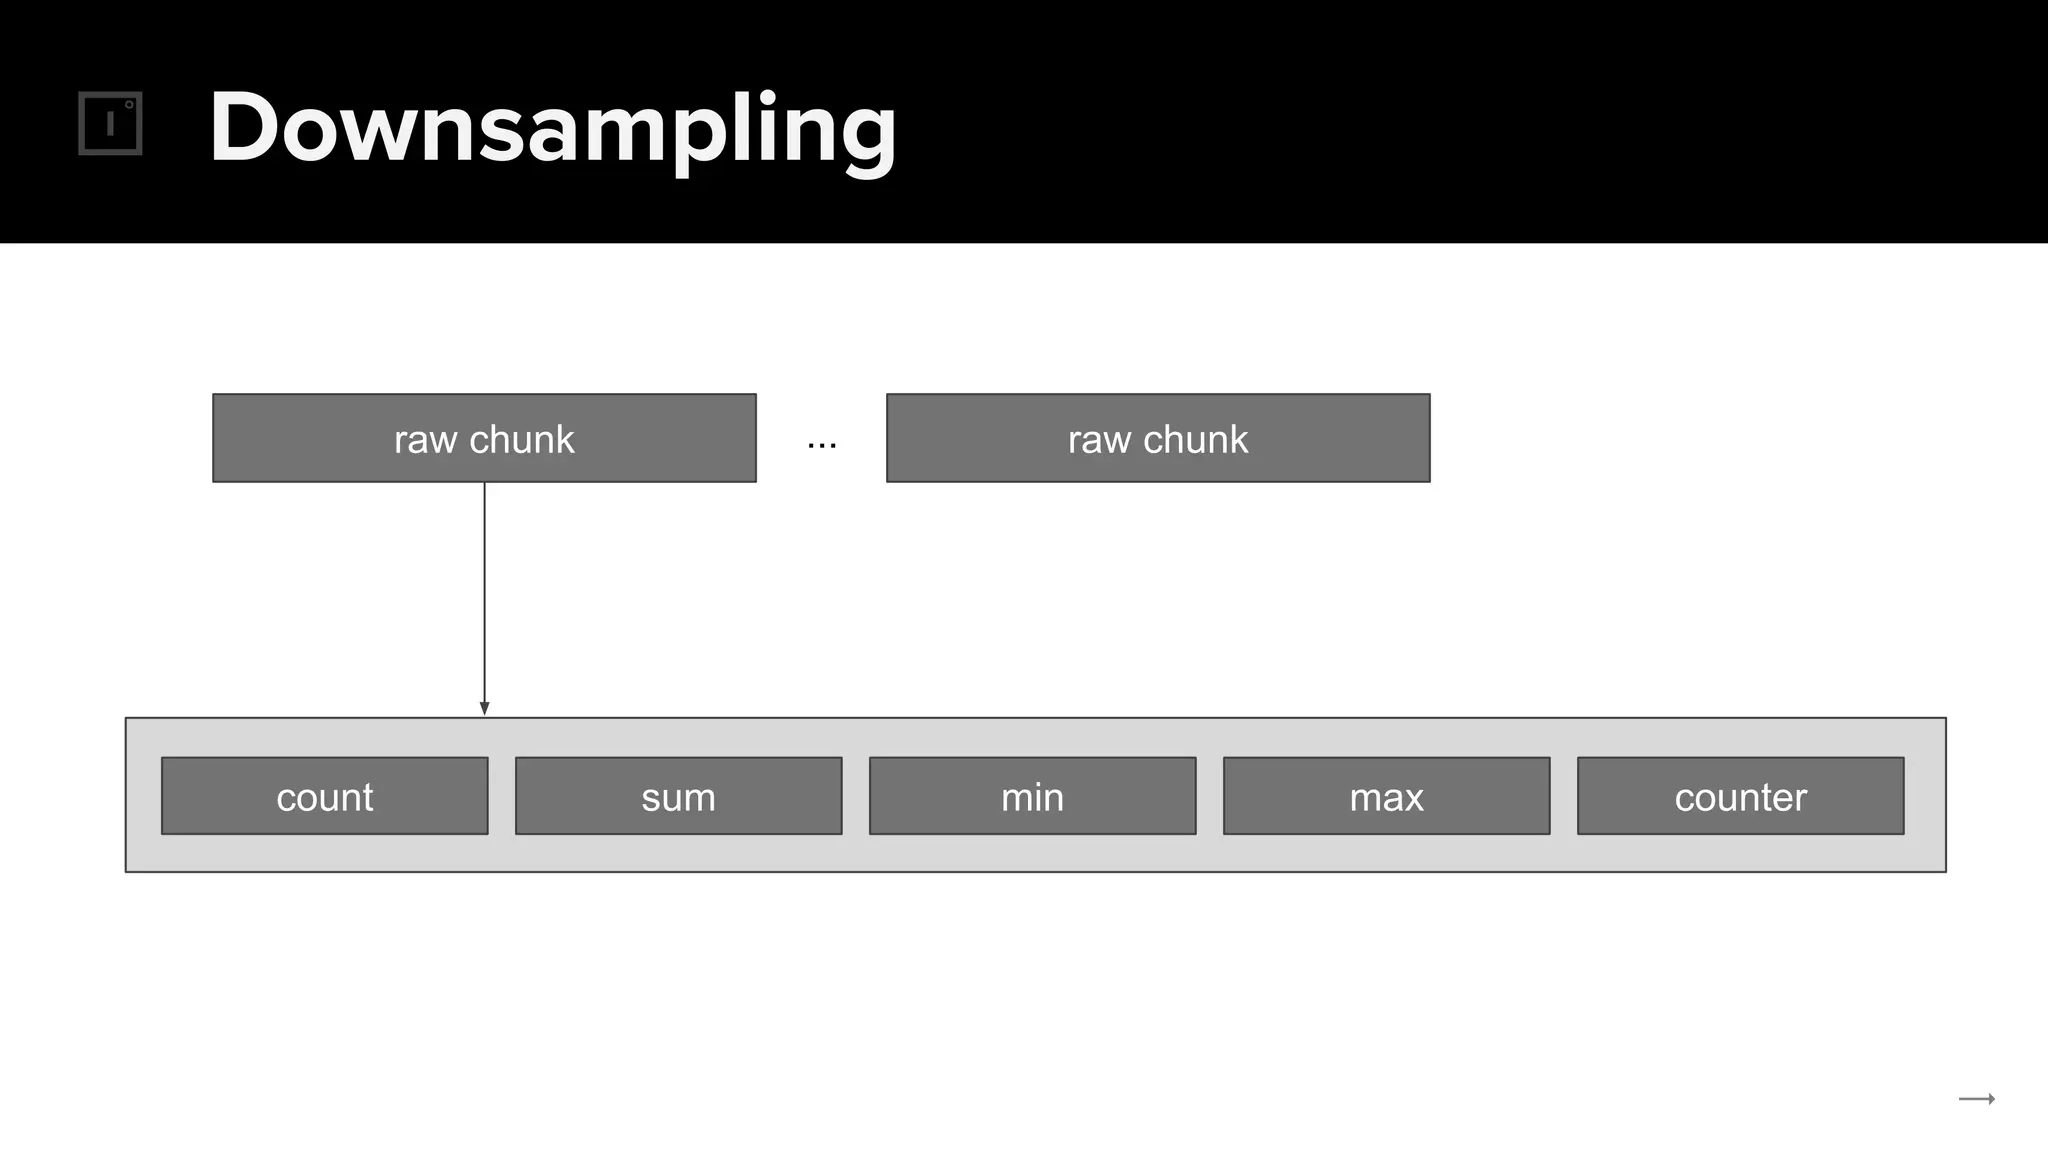

![Downsampling
count sum min max counter
count_over_time(requests_total[1h])](https://image.slidesharecdn.com/thanos-globaldurableprometheusmonitoring-prommeetup2018london-180119112336/75/Thanos-Global-durable-Prometheus-monitoring-70-2048.jpg)
![Downsampling
count sum min max counter
sum_over_time(requests_total[1h])](https://image.slidesharecdn.com/thanos-globaldurableprometheusmonitoring-prommeetup2018london-180119112336/75/Thanos-Global-durable-Prometheus-monitoring-71-2048.jpg)
![Downsampling
count sum min max counter
min(requests_total)
min_over_time(requests_total[1h])](https://image.slidesharecdn.com/thanos-globaldurableprometheusmonitoring-prommeetup2018london-180119112336/75/Thanos-Global-durable-Prometheus-monitoring-72-2048.jpg)
![Downsampling
count sum min max counter
max(requests_total)
max_over_time(requests_total[1h])](https://image.slidesharecdn.com/thanos-globaldurableprometheusmonitoring-prommeetup2018london-180119112336/75/Thanos-Global-durable-Prometheus-monitoring-73-2048.jpg)
![Downsampling
count sum min max counter
rate(requests_total[1h])
increase(requests_total[1h])](https://image.slidesharecdn.com/thanos-globaldurableprometheusmonitoring-prommeetup2018london-180119112336/75/Thanos-Global-durable-Prometheus-monitoring-74-2048.jpg)


![Coded Agents – with UiPath SDK + LangGraph [Virtual Hands-on Workshop]](https://cdn.slidesharecdn.com/ss_thumbnails/codedagentsdeck-251215155422-5497c599-thumbnail.jpg?width=640&height=640&fit=bounds)


