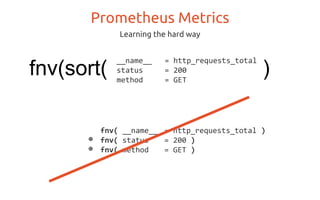
This document discusses time series data storage in Prometheus. It describes how Prometheus stores time series data using key-value pairs with labels to identify different time series. It stores data in chunks that are appended to and compressed for efficient storage and querying. Prometheus uses a log-structured storage to write time series data efficiently and allows querying of data using PromQL queries against the stored time series chunks.


![time [~weeks]
series
[~millions]
Writes
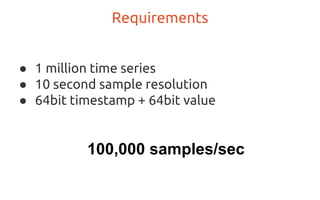
The Fundamental Problem
Orthogonal write and read patterns.
Reads](https://image.slidesharecdn.com/copyofprometheusstorage-151119161149-lva1-app6892/85/Prometheus-Storage-6-320.jpg)

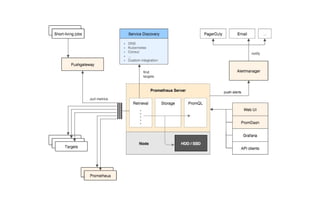

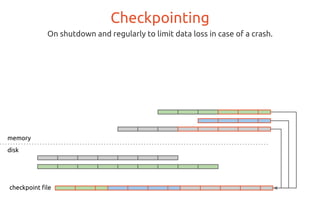
![1KB chunks
chunk in memory
[complete and immutable]
head chunk
[incomplete]
Sample
Ingestion
append(series, time, value)
memory
disk
evictable chunks (LRU)
chunk on disk
[complete and immutable]
PromQL
series iterator
one file per time series
series hash:](https://image.slidesharecdn.com/copyofprometheusstorage-151119161149-lva1-app6892/85/Prometheus-Storage-13-320.jpg)
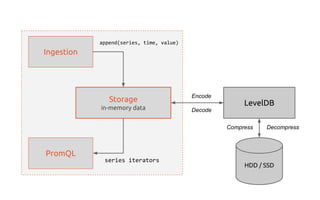
![basetime
Anatomy of a chunk [v0]5bytesheader
basevalue
valuetime
valuetime
valuetime
valuetime
... (one per timestamp)
... (one per value)
1000000 1441558420098
1001050 1441558432221
1002040 1441558444311
1002040
1441558444311
1000000
1441558420098
1001050
1441558432221](https://image.slidesharecdn.com/copyofprometheusstorage-151119161149-lva1-app6892/85/Prometheus-Storage-16-320.jpg)
![basetime
Anatomy of a chunk [v1]5bytesheader
basevalue
valuetime
valuetime
valuetime
valuetime
... (one per timestamp)
... (one per value)
1000000 1441558420098
1050 12123
2040 24213
3100 36313
4250 48500
1002040
1441558444311
1000000
1441558420098
1001050
1441558432221
+12123
+1050
+12090
+1000](https://image.slidesharecdn.com/copyofprometheusstorage-151119161149-lva1-app6892/85/Prometheus-Storage-17-320.jpg)
![basetime
Anatomy of a chunk [v2]5bytesheader
basevalue
valuetime
valuetime
valuetime
valuetime
... (one per timestamp)
... (one per value)
1002040
1441558444311
1000000
1441558420098
1001050
1441558432221
1000000 1441558420098
1050 12123
-60 -33
-50 -56
+50 -8
+12123
+1050
+12090
+1000](https://image.slidesharecdn.com/copyofprometheusstorage-151119161149-lva1-app6892/85/Prometheus-Storage-18-320.jpg)
![basetime
Anatomy of a chunk [v2]5bytesheader
basevalue
valuetime
valuetime
valuetime
valuetime
... (one per timestamp)
... (one per value)
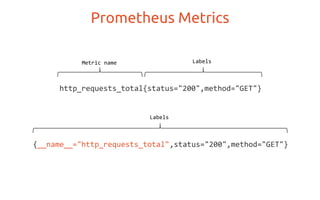
13:14 < nostrovsk> Hey guys, Looking for a sanity check here
13:15 < nostrovsk> 500 machines per server, each running node and jmx exporters, for 1 week is
only 30gb of data?
13:36 <@ bbrazil> what's your scrape rate and how heavy are those jmx exporters?
13:37 <@ bbrazil> doesn't sound implausible to me
13:42 <@ bbrazil> we're 25GB/two weeks with ~5k samples/s
13:45 <@ beorn7> Compression, it works... ;)
13:53 < fish_> beorn7: nothing says better 'good job' than people coming to this channel
because they can't believe that things are soo good :)](https://image.slidesharecdn.com/copyofprometheusstorage-151119161149-lva1-app6892/85/Prometheus-Storage-19-320.jpg)

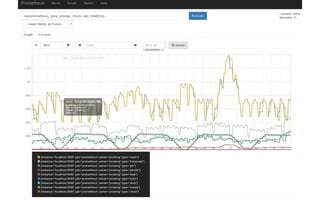
![rate(prometheus_local_storage_ingested_samples_total[1m])](https://image.slidesharecdn.com/copyofprometheusstorage-151119161149-lva1-app6892/85/Prometheus-Storage-21-320.jpg)