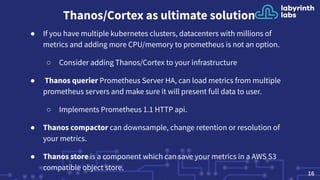
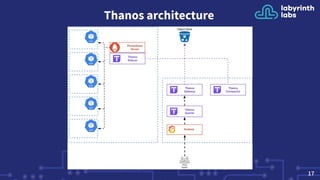
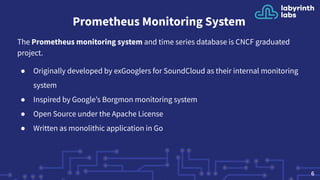
Prometheus is an open-source monitoring system that can scale from a single server to large clusters. While a single Prometheus instance is sufficient for many deployments, tools like Trickster, sharding, and Thanos/Cortex can help scale Prometheus further. Trickster caches query results to reduce load, sharding splits data across servers, and Thanos provides high availability and long term storage across multiple clusters.


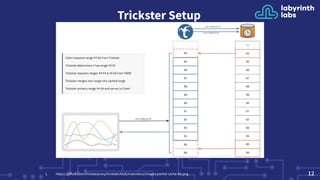
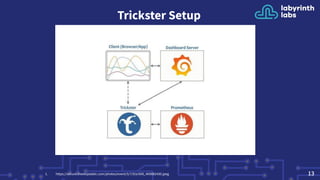
![Trickster Setup
● Loading complicated/big dashboard on Grafana can overload your
prometheus server
○ Use trickster to cache PromQL results for future reuse
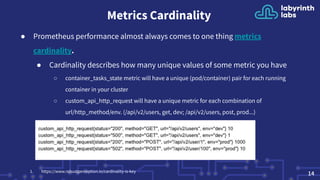
○ Queries on metrics with high cardinality can use a lot of memory on
you prometheus instance[1].
○ Use limits to make sure user will not overload your server
query.max-concurrency/query.max-samples
● Delta Proxy caching - inspects the time range of a client query to
determine what data points are already cached
111. https://www.robustperception.io/limiting-promql-resource-usage](https://image.slidesharecdn.com/monitoringwithprometheusatscale-200924184114/85/Monitoring-with-prometheus-at-scale-11-320.jpg)