SlideShare a Scribd company logo
1 of 19
Download to read offline
Store name                      Year   Sales revenue

e-Fashion Austin                2003          $1,135,479

e-Fashion Boston Newbury        2003           $887,169

e-Fashion Chicago 33rd          2003          $1,134,085

e-Fashion Colorado Springs      2003           $843,584

e-Fashion Dallas                2003           $803,421

e-Fashion Houston               2003           $910,451

e-Fashion Houston Leighton      2003          $1,335,747

e-Fashion Los Angeles           2003          $1,656,676

e-Fashion Miami Sundance        2003           $811,924

e-Fashion New York 5th          2003          $1,239,587

e-Fashion New York Magnolia     2003          $1,911,434

e-Fashion San Francisco         2003          $1,336,003

e-Fashion Washington Tolbooth   2003          $1,053,581

e-Fashion Austin                2002          $1,003,071

e-Fashion Boston Newbury        2002           $157,719

e-Fashion Chicago 33rd          2002          $1,150,659
e-Fashion Colorado Springs      2002           $768,390

e-Fashion Dallas                2002           $739,369

e-Fashion Houston               2002           $863,653

e-Fashion Houston Leighton      2002          $1,126,796

e-Fashion Los Angeles           2002          $1,581,616

e-Fashion Miami Sundance        2002           $661,250

e-Fashion New York 5th          2002          $1,076,144

e-Fashion New York Magnolia     2002          $1,687,359

e-Fashion San Francisco         2002          $1,201,064
Store name                      Year   Sales revenue

e-Fashion Washington Tolbooth   2002          $1,215,158

e-Fashion Austin                2001           $561,123

e-Fashion Boston Newbury        2001           $238,819

e-Fashion Chicago 33rd          2001           $737,914

e-Fashion Colorado Springs      2001           $448,302

e-Fashion Dallas                2001           $427,245

e-Fashion Houston               2001           $529,079

e-Fashion Houston Leighton      2001           $682,231

e-Fashion Los Angeles           2001           $982,637

e-Fashion Miami Sundance        2001           $405,985

e-Fashion New York 5th          2001           $644,635

e-Fashion New York Magnolia     2001          $1,023,061

e-Fashion San Francisco         2001           $721,574

e-Fashion Washington Tolbooth   2001           $693,211
e-Fashion Austin


e-Fashion Boston Newbury


 e-Fashion Chicago 33rd
e-Fashion Colorado Springs


     e-Fashion Dallas
e-Fashion Houston


e-Fashion Houston Leighton


  e-Fashion Los Angeles
e-Fashion Miami Sundance


 e-Fashion New York 5th
e-Fashion New York Magnolia


   e-Fashion San Francisco


e-Fashion Washington Tolbooth
e-Fashion Austin


 Year         Sales revenue

 2001                 $561,123

 2002                $1,003,071

 2003                $1,135,479


e-Fashion Boston Newbury


 Year         Sales revenue

 2001                 $238,819

 2002                 $157,719
 2003                 $887,169


e-Fashion Chicago 33rd
Year         Sales revenue

 2001                 $737,914

 2002                $1,150,659
 2003                $1,134,085


e-Fashion Colorado Springs


 Year         Sales revenue

 2001                 $448,302

 2002                 $768,390

 2003                 $843,584


e-Fashion Dallas


 Year         Sales revenue

 2001                 $427,245

 2002                 $739,369

 2003                 $803,421
e-Fashion Houston


 Year         Sales revenue

 2001                 $529,079

 2002                 $863,653

 2003                 $910,451


e-Fashion Houston Leighton


 Year         Sales revenue

 2001                 $682,231

 2002                $1,126,796

 2003                $1,335,747
e-Fashion Los Angeles


 Year         Sales revenue
 2001                 $982,637

 2002                $1,581,616

 2003                $1,656,676


e-Fashion Miami Sundance


 Year         Sales revenue

 2001                 $405,985

 2002                 $661,250

 2003                 $811,924


e-Fashion New York 5th


 Year         Sales revenue
Year         Sales revenue

 2001                 $644,635

 2002                $1,076,144
 2003                $1,239,587


e-Fashion New York Magnolia


 Year         Sales revenue

 2001                $1,023,061

 2002                $1,687,359

 2003                $1,911,434


e-Fashion San Francisco


 Year         Sales revenue

 2001                 $721,574

 2002                $1,201,064

 2003                $1,336,003
e-Fashion Washington Tolbooth


 Year         Sales revenue

 2001                 $693,211

 2002                $1,215,158

 2003                $1,053,581
Change in
              Store          Quarter        2002             2003
                                                                         Revenue

                             Q1           $263,162         $314,430      51,267.6

                             Q2           $240,204         $273,608      33,403.8

e-Fashion Austin             Q3           $204,691         $294,798       90,107

                             Q4           $295,014         $252,644       -42,370

                             Total     $1,003,071       $1,135,479    $2,138,550

                             Q1          Discontinued      $220,301      220,300.9

                             Q2          Discontinued      $220,528      220,528.3

e-Fashion Boston Newbury     Q3          Discontinued      $237,464      237,463.5

                             Q4           $157,719         $208,877      51,157.8

                             Total     $157,719         $887,169      $1,044,888

                             Q1           $334,297         $255,658       -78,639

                             Q2           $254,722         $354,724      100,002.3

e-Fashion Chicago 33rd       Q3           $230,573         $273,186      42,612.9

                             Q4           $331,067         $250,517      -80,549.6

                             Total     $1,150,659       $1,134,085    $2,284,744

                             Q1           $189,131         $204,754      15,622.5

                             Q2           $157,337         $213,663      56,325.5

e-Fashion Colorado Springs   Q3           $192,267         $232,889      40,621.8

                             Q4           $229,654         $192,279      -37,375.1

                             Total     $768,390         $843,584      $1,611,974
Change in
              Store          Quarter        2002          2003
                                                                      Revenue

                             Q1           $188,898      $215,874      26,976.7

                             Q2           $140,909      $194,689      53,780.7

e-Fashion Dallas             Q3           $190,696      $204,066      13,370.6

                             Q4           $218,867      $188,791      -30,075.9

                             Total     $739,369      $803,421      $1,542,790

                             Q1           $214,874      $233,375       18,501

                             Q2           $170,089      $245,516      75,427.1

e-Fashion Houston            Q3           $170,776      $220,757      49,980.6

                             Q4           $307,914      $210,803      -97,110.6

                             Total     $863,653      $910,451      $1,774,104

                             Q1           $347,359      $338,801       -8,557.6

                             Q2           $244,778      $374,408      129,630.4

e-Fashion Houston Leighton   Q3           $218,398      $313,009      94,610.6

                             Q4           $316,262      $309,529       -6,732.3

                             Total     $1,126,796    $1,335,747    $2,462,543

                             Q1           $398,860      $421,390      22,529.4

                             Q2           $303,980      $423,867      119,886.9

e-Fashion Los Angeles        Q3           $443,591      $432,215      -11,376.5

                             Q4           $435,185      $379,205      -55,980.1

                             Total     $1,581,616    $1,656,676    $3,238,292
Change in
             Store            Quarter        2002          2003
                                                                       Revenue

                              Q1           $174,276      $203,882      29,606.4

                              Q2           $147,358      $221,469      74,110.9

e-Fashion Miami Sundance      Q3           $121,314      $215,569      94,254.7

                              Q4           $218,301      $171,003      -47,298.2

                              Total     $661,250      $811,924      $1,473,173

                              Q1           $286,176      $295,283       9,107.1

                              Q2           $282,370      $321,744      39,374.4

e-Fashion New York 5th        Q3           $178,727      $363,888      185,160.5

                              Q4           $328,871      $258,673      -70,198.6

                              Total     $1,076,144    $1,239,587    $2,315,731

                              Q1           $397,795      $451,878      54,082.5

                              Q2           $410,143      $533,872      123,729.6

e-Fashion New York Magnolia   Q3           $322,493      $550,359      227,866.3

                              Q4           $556,928      $375,325      -181,603.2

                              Total     $1,687,359    $1,911,434    $3,598,793

                              Q1           $251,855      $308,356      56,500.9

                              Q2           $225,276      $365,531      140,254.9

e-Fashion San Francisco       Q3           $316,850      $343,552      26,701.2

                              Q4           $407,083      $318,565      -88,517.2

                              Total     $1,201,064    $1,336,003    $2,537,067
Change in
             Store              Quarter        2002          2003
                                                                         Revenue

                                Q1           $279,490      $279,008        -481.7

                                Q2           $263,486      $263,098        -388.1

e-Fashion Washington Tolbooth   Q3           $288,926      $271,645      -17,280.9

                                Q4           $383,257      $239,831      -143,425.9

                                Total     $1,215,158    $1,053,581    $2,268,739
Q1                       Q2                       Q3                       Q4


                                Sales                    Sales                    Sales                    Sales
                                            Store Rank               Store Rank               Store Rank               Store Rank
                                Revenue                  Revenue                  Revenue                  Revenue

e-Fashion Austin                 $577,592           6     $513,812           8     $499,488           8     $547,658           8

e-Fashion Boston Newbury         $220,301           13    $220,528           13    $237,464           13    $366,595           13

e-Fashion Chicago 33rd           $589,955           4     $609,446           4     $503,760           7     $581,584           7

e-Fashion Colorado Springs       $393,885           11    $371,000           10    $425,156           9     $421,933           10

e-Fashion Dallas                 $404,772           10    $335,598           12    $394,762           10    $407,658           11

e-Fashion Houston                $448,250           9     $415,605           9     $391,533           11    $518,717           9

e-Fashion Houston Leighton       $686,160           3     $619,186           3     $531,406           6     $625,791           4

e-Fashion Los Angeles            $820,250           2     $727,847           2     $875,806           1     $814,389           2

e-Fashion Miami Sundance         $378,158           12    $368,828           11    $336,884           12    $389,304           12

e-Fashion New York 5th           $581,459           5     $604,114           5     $542,615           5     $587,544           6

e-Fashion New York Magnolia      $849,673           1     $944,015           1     $872,852           2     $932,254           1

e-Fashion San Francisco          $560,210           7     $590,807           6     $660,402           3     $725,648           3

e-Fashion Washington Tolbooth    $558,497           8     $526,584           7     $560,572           4     $623,087           5

More Related Content

Viewers also liked

AEGEE - Model European Union Konstanz - Agora Aachen
AEGEE - Model European Union Konstanz - Agora AachenAEGEE - Model European Union Konstanz - Agora Aachen
AEGEE - Model European Union Konstanz - Agora Aachen
aegee.statutory
 
Sorte...
Sorte...Sorte...
Sorte...
AN7ONYO
 
2009 통일백서
2009 통일백서2009 통일백서
2009 통일백서
unikorea
 
Peer feedback factual layout
Peer feedback factual layoutPeer feedback factual layout
Peer feedback factual layout
ashboyne
 
Cambium networks pmp_450_access_point_specification
Cambium networks pmp_450_access_point_specificationCambium networks pmp_450_access_point_specification
Cambium networks pmp_450_access_point_specification
Advantec Distribution
 
What,Where,How
What,Where,HowWhat,Where,How
What,Where,How
swegn001
 
predictive sales models v4 - Brief
predictive sales models v4 - Briefpredictive sales models v4 - Brief
predictive sales models v4 - Brief
Stuart Weinstein ✔
 
Dsa Chiro Inc 2009
Dsa Chiro Inc 2009Dsa Chiro Inc 2009
Dsa Chiro Inc 2009
DSAChiroInc
 

Viewers also liked (20)

Game Reports Eng
Game Reports EngGame Reports Eng
Game Reports Eng
 
South carolina[1]
South carolina[1]South carolina[1]
South carolina[1]
 
NAS Partner Marketing Workshop: Engaging with schools breakout
NAS Partner Marketing Workshop: Engaging with schools breakoutNAS Partner Marketing Workshop: Engaging with schools breakout
NAS Partner Marketing Workshop: Engaging with schools breakout
 
Mobile government presentation - Bull and Citrix - March 6th 2014
Mobile government presentation - Bull and Citrix - March 6th 2014Mobile government presentation - Bull and Citrix - March 6th 2014
Mobile government presentation - Bull and Citrix - March 6th 2014
 
AEGEE - Model European Union Konstanz - Agora Aachen
AEGEE - Model European Union Konstanz - Agora AachenAEGEE - Model European Union Konstanz - Agora Aachen
AEGEE - Model European Union Konstanz - Agora Aachen
 
Sorte...
Sorte...Sorte...
Sorte...
 
2009 통일백서
2009 통일백서2009 통일백서
2009 통일백서
 
Peer feedback factual layout
Peer feedback factual layoutPeer feedback factual layout
Peer feedback factual layout
 
Big data_郭惠民
Big data_郭惠民Big data_郭惠民
Big data_郭惠民
 
REST in peace @ Codemotion 2011
REST in peace @ Codemotion 2011REST in peace @ Codemotion 2011
REST in peace @ Codemotion 2011
 
Alexander the great powerpoint1
Alexander the great powerpoint1Alexander the great powerpoint1
Alexander the great powerpoint1
 
Cambium networks pmp_450_access_point_specification
Cambium networks pmp_450_access_point_specificationCambium networks pmp_450_access_point_specification
Cambium networks pmp_450_access_point_specification
 
New Culture of Storytelling
New Culture of StorytellingNew Culture of Storytelling
New Culture of Storytelling
 
What,Where,How
What,Where,HowWhat,Where,How
What,Where,How
 
predictive sales models v4 - Brief
predictive sales models v4 - Briefpredictive sales models v4 - Brief
predictive sales models v4 - Brief
 
Dsa Chiro Inc 2009
Dsa Chiro Inc 2009Dsa Chiro Inc 2009
Dsa Chiro Inc 2009
 
Dossier
DossierDossier
Dossier
 
Using protease to enhance the utilization of corn amino acids by broilers
Using protease to enhance the utilization of corn amino acids by broilersUsing protease to enhance the utilization of corn amino acids by broilers
Using protease to enhance the utilization of corn amino acids by broilers
 
Using Silent Grouping to Size User Stories (XP2011)
Using Silent Grouping to Size User Stories (XP2011)Using Silent Grouping to Size User Stories (XP2011)
Using Silent Grouping to Size User Stories (XP2011)
 
Heterologous proteins
Heterologous proteinsHeterologous proteins
Heterologous proteins
 

Similar to Test

Digital everywhere 2% growth with debt
Digital everywhere 2% growth with debtDigital everywhere 2% growth with debt
Digital everywhere 2% growth with debt
Bea Morales
 
Recycli Fence Travel Expenses
Recycli Fence Travel ExpensesRecycli Fence Travel Expenses
Recycli Fence Travel Expenses
Salena Shemilt
 
Lesson 8 charts presentation
Lesson 8 charts presentationLesson 8 charts presentation
Lesson 8 charts presentation
Monica-Gomez
 
TREB - Condo report Q3-2016
TREB - Condo report Q3-2016TREB - Condo report Q3-2016
TREB - Condo report Q3-2016
Gloria Yeung
 
Market Watch APRIL 2015
Market Watch APRIL 2015Market Watch APRIL 2015
Market Watch APRIL 2015
Chaba Tamasi
 
Napco Better Result
Napco Better ResultNapco Better Result
Napco Better Result
pmoskie
 
39348363 google-earnings-slides-q3-2010
39348363 google-earnings-slides-q3-201039348363 google-earnings-slides-q3-2010
39348363 google-earnings-slides-q3-2010
Pranav Bhatnagar
 

Similar to Test (20)

Financial Forecasting
Financial ForecastingFinancial Forecasting
Financial Forecasting
 
Austin Real Estate Statistics May 2013 Austin Home Team
Austin Real Estate Statistics May 2013 Austin Home TeamAustin Real Estate Statistics May 2013 Austin Home Team
Austin Real Estate Statistics May 2013 Austin Home Team
 
Ctia Survey Midyear 2009 Graphics
Ctia Survey Midyear 2009 GraphicsCtia Survey Midyear 2009 Graphics
Ctia Survey Midyear 2009 Graphics
 
Digital everywhere 2% growth with debt
Digital everywhere 2% growth with debtDigital everywhere 2% growth with debt
Digital everywhere 2% growth with debt
 
Recycli Fence Travel Expenses
Recycli Fence Travel ExpensesRecycli Fence Travel Expenses
Recycli Fence Travel Expenses
 
Teacher Concessions
Teacher ConcessionsTeacher Concessions
Teacher Concessions
 
September 2020 - Market Report - Toronto & GTA Housing Sales
September 2020 - Market Report - Toronto & GTA Housing SalesSeptember 2020 - Market Report - Toronto & GTA Housing Sales
September 2020 - Market Report - Toronto & GTA Housing Sales
 
Lesson 8 charts presentation
Lesson 8 charts presentationLesson 8 charts presentation
Lesson 8 charts presentation
 
Copy Tested Of Imc09 Payback Analysis Jc 072209
Copy Tested  Of Imc09 Payback Analysis Jc 072209Copy Tested  Of Imc09 Payback Analysis Jc 072209
Copy Tested Of Imc09 Payback Analysis Jc 072209
 
TREB - Condo report Q3-2016
TREB - Condo report Q3-2016TREB - Condo report Q3-2016
TREB - Condo report Q3-2016
 
May Market Watch 2021
May Market Watch 2021May Market Watch 2021
May Market Watch 2021
 
Market Watch APRIL 2015
Market Watch APRIL 2015Market Watch APRIL 2015
Market Watch APRIL 2015
 
Napco Better Result
Napco Better ResultNapco Better Result
Napco Better Result
 
Market Watch June 2013
Market Watch June 2013Market Watch June 2013
Market Watch June 2013
 
July 2021 - Market Report
July 2021 - Market Report July 2021 - Market Report
July 2021 - Market Report
 
39348363 google-earnings-slides-q3-2010
39348363 google-earnings-slides-q3-201039348363 google-earnings-slides-q3-2010
39348363 google-earnings-slides-q3-2010
 
2010 q3 google_earnings_slides
2010 q3 google_earnings_slides2010 q3 google_earnings_slides
2010 q3 google_earnings_slides
 
2013 04 market watch
2013 04 market watch2013 04 market watch
2013 04 market watch
 
November 2021 Market Watch
November 2021 Market WatchNovember 2021 Market Watch
November 2021 Market Watch
 
DENVER MARKET WATCH YEAR END 2009
DENVER MARKET WATCH YEAR END 2009DENVER MARKET WATCH YEAR END 2009
DENVER MARKET WATCH YEAR END 2009
 

Recently uploaded

會考英文會考英文會考英文會考英文會考英文會考英文會考英文會考英文會考英文會考英文會考英文
會考英文會考英文會考英文會考英文會考英文會考英文會考英文會考英文會考英文會考英文會考英文會考英文會考英文會考英文會考英文會考英文會考英文會考英文會考英文會考英文會考英文會考英文
會考英文會考英文會考英文會考英文會考英文會考英文會考英文會考英文會考英文會考英文會考英文
中 央社
 
會考英聽會考英聽會考英聽會考英聽會考英聽會考英聽會考英聽會考英聽會考英聽會考英聽
會考英聽會考英聽會考英聽會考英聽會考英聽會考英聽會考英聽會考英聽會考英聽會考英聽會考英聽會考英聽會考英聽會考英聽會考英聽會考英聽會考英聽會考英聽會考英聽會考英聽
會考英聽會考英聽會考英聽會考英聽會考英聽會考英聽會考英聽會考英聽會考英聽會考英聽
中 央社
 
ppt your views.ppt your views of your college in your eyes
ppt your views.ppt your views of your college in your eyesppt your views.ppt your views of your college in your eyes
ppt your views.ppt your views of your college in your eyes
ashishpaul799
 

Recently uploaded (20)

slides CapTechTalks Webinar May 2024 Alexander Perry.pptx
slides CapTechTalks Webinar May 2024 Alexander Perry.pptxslides CapTechTalks Webinar May 2024 Alexander Perry.pptx
slides CapTechTalks Webinar May 2024 Alexander Perry.pptx
 
會考英文會考英文會考英文會考英文會考英文會考英文會考英文會考英文會考英文會考英文會考英文
會考英文會考英文會考英文會考英文會考英文會考英文會考英文會考英文會考英文會考英文會考英文會考英文會考英文會考英文會考英文會考英文會考英文會考英文會考英文會考英文會考英文會考英文
會考英文會考英文會考英文會考英文會考英文會考英文會考英文會考英文會考英文會考英文會考英文
 
會考英聽會考英聽會考英聽會考英聽會考英聽會考英聽會考英聽會考英聽會考英聽會考英聽
會考英聽會考英聽會考英聽會考英聽會考英聽會考英聽會考英聽會考英聽會考英聽會考英聽會考英聽會考英聽會考英聽會考英聽會考英聽會考英聽會考英聽會考英聽會考英聽會考英聽
會考英聽會考英聽會考英聽會考英聽會考英聽會考英聽會考英聽會考英聽會考英聽會考英聽
 
Basic Civil Engg Notes_Chapter-6_Environment Pollution & Engineering
Basic Civil Engg Notes_Chapter-6_Environment Pollution & EngineeringBasic Civil Engg Notes_Chapter-6_Environment Pollution & Engineering
Basic Civil Engg Notes_Chapter-6_Environment Pollution & Engineering
 
Behavioral-sciences-dr-mowadat rana (1).pdf
Behavioral-sciences-dr-mowadat rana (1).pdfBehavioral-sciences-dr-mowadat rana (1).pdf
Behavioral-sciences-dr-mowadat rana (1).pdf
 
Matatag-Curriculum and the 21st Century Skills Presentation.pptx
Matatag-Curriculum and the 21st Century Skills Presentation.pptxMatatag-Curriculum and the 21st Century Skills Presentation.pptx
Matatag-Curriculum and the 21st Century Skills Presentation.pptx
 
philosophy and it's principles based on the life
philosophy and it's principles based on the lifephilosophy and it's principles based on the life
philosophy and it's principles based on the life
 
How to Manage Notification Preferences in the Odoo 17
How to Manage Notification Preferences in the Odoo 17How to Manage Notification Preferences in the Odoo 17
How to Manage Notification Preferences in the Odoo 17
 
An Overview of the Odoo 17 Discuss App.pptx
An Overview of the Odoo 17 Discuss App.pptxAn Overview of the Odoo 17 Discuss App.pptx
An Overview of the Odoo 17 Discuss App.pptx
 
REPRODUCTIVE TOXICITY STUDIE OF MALE AND FEMALEpptx
REPRODUCTIVE TOXICITY  STUDIE OF MALE AND FEMALEpptxREPRODUCTIVE TOXICITY  STUDIE OF MALE AND FEMALEpptx
REPRODUCTIVE TOXICITY STUDIE OF MALE AND FEMALEpptx
 
[GDSC YCCE] Build with AI Online Presentation
[GDSC YCCE] Build with AI Online Presentation[GDSC YCCE] Build with AI Online Presentation
[GDSC YCCE] Build with AI Online Presentation
 
2024_Student Session 2_ Set Plan Preparation.pptx
2024_Student Session 2_ Set Plan Preparation.pptx2024_Student Session 2_ Set Plan Preparation.pptx
2024_Student Session 2_ Set Plan Preparation.pptx
 
Exploring Gemini AI and Integration with MuleSoft | MuleSoft Mysore Meetup #45
Exploring Gemini AI and Integration with MuleSoft | MuleSoft Mysore Meetup #45Exploring Gemini AI and Integration with MuleSoft | MuleSoft Mysore Meetup #45
Exploring Gemini AI and Integration with MuleSoft | MuleSoft Mysore Meetup #45
 
Removal Strategy _ FEFO _ Working with Perishable Products in Odoo 17
Removal Strategy _ FEFO _ Working with Perishable Products in Odoo 17Removal Strategy _ FEFO _ Working with Perishable Products in Odoo 17
Removal Strategy _ FEFO _ Working with Perishable Products in Odoo 17
 
factors influencing drug absorption-final-2.pptx
factors influencing drug absorption-final-2.pptxfactors influencing drug absorption-final-2.pptx
factors influencing drug absorption-final-2.pptx
 
....................Muslim-Law notes.pdf
....................Muslim-Law notes.pdf....................Muslim-Law notes.pdf
....................Muslim-Law notes.pdf
 
The Ultimate Guide to Social Media Marketing in 2024.pdf
The Ultimate Guide to Social Media Marketing in 2024.pdfThe Ultimate Guide to Social Media Marketing in 2024.pdf
The Ultimate Guide to Social Media Marketing in 2024.pdf
 
Championnat de France de Tennis de table/
Championnat de France de Tennis de table/Championnat de France de Tennis de table/
Championnat de France de Tennis de table/
 
INU_CAPSTONEDESIGN_비밀번호486_업로드용 발표자료.pdf
INU_CAPSTONEDESIGN_비밀번호486_업로드용 발표자료.pdfINU_CAPSTONEDESIGN_비밀번호486_업로드용 발표자료.pdf
INU_CAPSTONEDESIGN_비밀번호486_업로드용 발표자료.pdf
 
ppt your views.ppt your views of your college in your eyes
ppt your views.ppt your views of your college in your eyesppt your views.ppt your views of your college in your eyes
ppt your views.ppt your views of your college in your eyes
 

Test

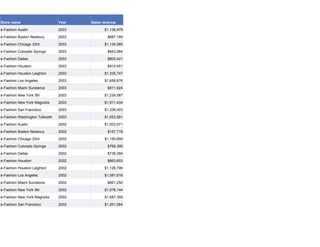
  • 1. Store name Year Sales revenue e-Fashion Austin 2003 $1,135,479 e-Fashion Boston Newbury 2003 $887,169 e-Fashion Chicago 33rd 2003 $1,134,085 e-Fashion Colorado Springs 2003 $843,584 e-Fashion Dallas 2003 $803,421 e-Fashion Houston 2003 $910,451 e-Fashion Houston Leighton 2003 $1,335,747 e-Fashion Los Angeles 2003 $1,656,676 e-Fashion Miami Sundance 2003 $811,924 e-Fashion New York 5th 2003 $1,239,587 e-Fashion New York Magnolia 2003 $1,911,434 e-Fashion San Francisco 2003 $1,336,003 e-Fashion Washington Tolbooth 2003 $1,053,581 e-Fashion Austin 2002 $1,003,071 e-Fashion Boston Newbury 2002 $157,719 e-Fashion Chicago 33rd 2002 $1,150,659 e-Fashion Colorado Springs 2002 $768,390 e-Fashion Dallas 2002 $739,369 e-Fashion Houston 2002 $863,653 e-Fashion Houston Leighton 2002 $1,126,796 e-Fashion Los Angeles 2002 $1,581,616 e-Fashion Miami Sundance 2002 $661,250 e-Fashion New York 5th 2002 $1,076,144 e-Fashion New York Magnolia 2002 $1,687,359 e-Fashion San Francisco 2002 $1,201,064
  • 2. Store name Year Sales revenue e-Fashion Washington Tolbooth 2002 $1,215,158 e-Fashion Austin 2001 $561,123 e-Fashion Boston Newbury 2001 $238,819 e-Fashion Chicago 33rd 2001 $737,914 e-Fashion Colorado Springs 2001 $448,302 e-Fashion Dallas 2001 $427,245 e-Fashion Houston 2001 $529,079 e-Fashion Houston Leighton 2001 $682,231 e-Fashion Los Angeles 2001 $982,637 e-Fashion Miami Sundance 2001 $405,985 e-Fashion New York 5th 2001 $644,635 e-Fashion New York Magnolia 2001 $1,023,061 e-Fashion San Francisco 2001 $721,574 e-Fashion Washington Tolbooth 2001 $693,211
  • 3. e-Fashion Austin e-Fashion Boston Newbury e-Fashion Chicago 33rd
  • 4. e-Fashion Colorado Springs e-Fashion Dallas
  • 5. e-Fashion Houston e-Fashion Houston Leighton e-Fashion Los Angeles
  • 6. e-Fashion Miami Sundance e-Fashion New York 5th
  • 7. e-Fashion New York Magnolia e-Fashion San Francisco e-Fashion Washington Tolbooth
  • 8.
  • 9. e-Fashion Austin Year Sales revenue 2001 $561,123 2002 $1,003,071 2003 $1,135,479 e-Fashion Boston Newbury Year Sales revenue 2001 $238,819 2002 $157,719 2003 $887,169 e-Fashion Chicago 33rd
  • 10. Year Sales revenue 2001 $737,914 2002 $1,150,659 2003 $1,134,085 e-Fashion Colorado Springs Year Sales revenue 2001 $448,302 2002 $768,390 2003 $843,584 e-Fashion Dallas Year Sales revenue 2001 $427,245 2002 $739,369 2003 $803,421
  • 11. e-Fashion Houston Year Sales revenue 2001 $529,079 2002 $863,653 2003 $910,451 e-Fashion Houston Leighton Year Sales revenue 2001 $682,231 2002 $1,126,796 2003 $1,335,747
  • 12. e-Fashion Los Angeles Year Sales revenue 2001 $982,637 2002 $1,581,616 2003 $1,656,676 e-Fashion Miami Sundance Year Sales revenue 2001 $405,985 2002 $661,250 2003 $811,924 e-Fashion New York 5th Year Sales revenue
  • 13. Year Sales revenue 2001 $644,635 2002 $1,076,144 2003 $1,239,587 e-Fashion New York Magnolia Year Sales revenue 2001 $1,023,061 2002 $1,687,359 2003 $1,911,434 e-Fashion San Francisco Year Sales revenue 2001 $721,574 2002 $1,201,064 2003 $1,336,003
  • 14. e-Fashion Washington Tolbooth Year Sales revenue 2001 $693,211 2002 $1,215,158 2003 $1,053,581
  • 15. Change in Store Quarter 2002 2003 Revenue Q1 $263,162 $314,430 51,267.6 Q2 $240,204 $273,608 33,403.8 e-Fashion Austin Q3 $204,691 $294,798 90,107 Q4 $295,014 $252,644 -42,370 Total $1,003,071 $1,135,479 $2,138,550 Q1 Discontinued $220,301 220,300.9 Q2 Discontinued $220,528 220,528.3 e-Fashion Boston Newbury Q3 Discontinued $237,464 237,463.5 Q4 $157,719 $208,877 51,157.8 Total $157,719 $887,169 $1,044,888 Q1 $334,297 $255,658 -78,639 Q2 $254,722 $354,724 100,002.3 e-Fashion Chicago 33rd Q3 $230,573 $273,186 42,612.9 Q4 $331,067 $250,517 -80,549.6 Total $1,150,659 $1,134,085 $2,284,744 Q1 $189,131 $204,754 15,622.5 Q2 $157,337 $213,663 56,325.5 e-Fashion Colorado Springs Q3 $192,267 $232,889 40,621.8 Q4 $229,654 $192,279 -37,375.1 Total $768,390 $843,584 $1,611,974
  • 16. Change in Store Quarter 2002 2003 Revenue Q1 $188,898 $215,874 26,976.7 Q2 $140,909 $194,689 53,780.7 e-Fashion Dallas Q3 $190,696 $204,066 13,370.6 Q4 $218,867 $188,791 -30,075.9 Total $739,369 $803,421 $1,542,790 Q1 $214,874 $233,375 18,501 Q2 $170,089 $245,516 75,427.1 e-Fashion Houston Q3 $170,776 $220,757 49,980.6 Q4 $307,914 $210,803 -97,110.6 Total $863,653 $910,451 $1,774,104 Q1 $347,359 $338,801 -8,557.6 Q2 $244,778 $374,408 129,630.4 e-Fashion Houston Leighton Q3 $218,398 $313,009 94,610.6 Q4 $316,262 $309,529 -6,732.3 Total $1,126,796 $1,335,747 $2,462,543 Q1 $398,860 $421,390 22,529.4 Q2 $303,980 $423,867 119,886.9 e-Fashion Los Angeles Q3 $443,591 $432,215 -11,376.5 Q4 $435,185 $379,205 -55,980.1 Total $1,581,616 $1,656,676 $3,238,292
  • 17. Change in Store Quarter 2002 2003 Revenue Q1 $174,276 $203,882 29,606.4 Q2 $147,358 $221,469 74,110.9 e-Fashion Miami Sundance Q3 $121,314 $215,569 94,254.7 Q4 $218,301 $171,003 -47,298.2 Total $661,250 $811,924 $1,473,173 Q1 $286,176 $295,283 9,107.1 Q2 $282,370 $321,744 39,374.4 e-Fashion New York 5th Q3 $178,727 $363,888 185,160.5 Q4 $328,871 $258,673 -70,198.6 Total $1,076,144 $1,239,587 $2,315,731 Q1 $397,795 $451,878 54,082.5 Q2 $410,143 $533,872 123,729.6 e-Fashion New York Magnolia Q3 $322,493 $550,359 227,866.3 Q4 $556,928 $375,325 -181,603.2 Total $1,687,359 $1,911,434 $3,598,793 Q1 $251,855 $308,356 56,500.9 Q2 $225,276 $365,531 140,254.9 e-Fashion San Francisco Q3 $316,850 $343,552 26,701.2 Q4 $407,083 $318,565 -88,517.2 Total $1,201,064 $1,336,003 $2,537,067
  • 18. Change in Store Quarter 2002 2003 Revenue Q1 $279,490 $279,008 -481.7 Q2 $263,486 $263,098 -388.1 e-Fashion Washington Tolbooth Q3 $288,926 $271,645 -17,280.9 Q4 $383,257 $239,831 -143,425.9 Total $1,215,158 $1,053,581 $2,268,739
  • 19. Q1 Q2 Q3 Q4 Sales Sales Sales Sales Store Rank Store Rank Store Rank Store Rank Revenue Revenue Revenue Revenue e-Fashion Austin $577,592 6 $513,812 8 $499,488 8 $547,658 8 e-Fashion Boston Newbury $220,301 13 $220,528 13 $237,464 13 $366,595 13 e-Fashion Chicago 33rd $589,955 4 $609,446 4 $503,760 7 $581,584 7 e-Fashion Colorado Springs $393,885 11 $371,000 10 $425,156 9 $421,933 10 e-Fashion Dallas $404,772 10 $335,598 12 $394,762 10 $407,658 11 e-Fashion Houston $448,250 9 $415,605 9 $391,533 11 $518,717 9 e-Fashion Houston Leighton $686,160 3 $619,186 3 $531,406 6 $625,791 4 e-Fashion Los Angeles $820,250 2 $727,847 2 $875,806 1 $814,389 2 e-Fashion Miami Sundance $378,158 12 $368,828 11 $336,884 12 $389,304 12 e-Fashion New York 5th $581,459 5 $604,114 5 $542,615 5 $587,544 6 e-Fashion New York Magnolia $849,673 1 $944,015 1 $872,852 2 $932,254 1 e-Fashion San Francisco $560,210 7 $590,807 6 $660,402 3 $725,648 3 e-Fashion Washington Tolbooth $558,497 8 $526,584 7 $560,572 4 $623,087 5