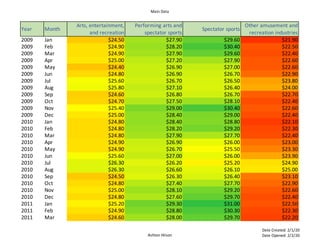
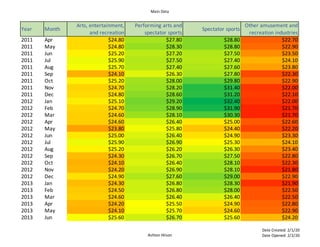
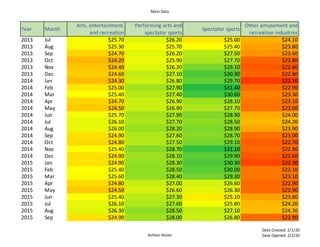
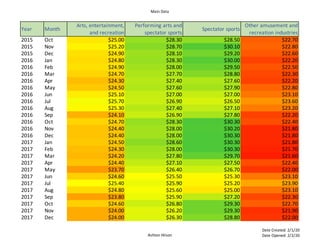
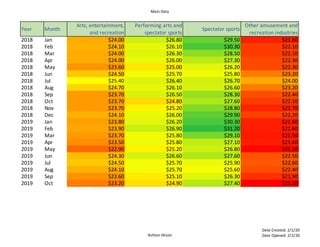
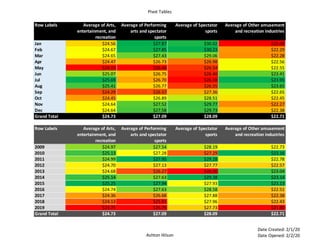
The document analyzes average pay rates across four industries from 2009-2019. It finds that spectator sports had the highest average rates for most recent years while other amusement and recreation had the lowest. Pay in arts, entertainment and recreation, and other amusement peaked in summer months while the other two industries did not show consistency. There has been an overall steady decrease in rates across all industries since 2016.
Data Analysis and Reporting spreadsheet AlexLeite33
Here is an example of a report, pivot table, and insights, complete with conditional formatting, created for my Data Analysis and Reporting course at Full Sail University.
The document summarizes data on wages in four related industries in the leisure and hospitality sector over time:
- Arts, entertainment, and recreation had the lowest average wages of the four industries over the past two years. Performing arts and spectator sports had the highest average wages.
- Performing arts companies and arts and sports promoters had very similar wages on average.
- Arts and sports promoters saw the smallest increase in wages over the last decade at 6%.
Thomas Scovens created two summary reports analyzing average wage rates across different leisure and entertainment industries from 2010-2019 using industry and month as filters. The reports found that performing arts and spectator sports had the highest average rates for most recent years while amusement parks and arcades had the lowest. June through August consistently had the lowest reported averages across industries. 2013 displayed a lower average among most surveyed industries.
The document is a report analyzing average monthly pay rates for four industries from 2009 to 2019: Arts, Entertainment, & Recreation; Performing Arts Companies; Arts & Sports Promoters; and Independent Artists, Writers, and Performers. It finds that Arts & Sports Promoters started with very high average pay that increased in 2015, while June to August are consistently lower months for Arts, Entertainment, & Recreation and Performing Arts Companies. The report also analyzes differences in average pay between industries and across years using pivot tables.
The document summarizes data on average pay rates for four industries from 2010-2020. It finds that:
1) June, July, and August consistently have the lowest average pay among all industries.
2) The average pay for independent artists, writers and performers increased $10 over 10 years, while other industries increased around $5.
3) Independent artists, writers and performers have the highest average pay in recent years, while amusements, gambling and recreation have the lowest.
The document is an assignment submission analyzing wage data for different industries from 2010-2020. It includes tables showing average monthly wages for each industry. The author concluded that an arts and sports manager position provided the most consistent pay over time compared to the other industries analyzed. Overall, independent artists had the highest average wages from 2018-2020 while sporting goods had the lowest in recent years.
The document analyzes average salaries from 2008-2018 for four industries: legal services, graphic design services, management and technical consulting services, and marketing consulting services. It finds that legal services had the highest average salary overall, graphic design the lowest, and management/technical and marketing services had similar average salaries in between. September typically had the highest monthly average while January had the lowest.
This document contains monthly wage data from 2009 to 2019 for four different industries: administrative and support services, professional employer organizations, business support services, and travel arrangement and reservation services. It shows the average wages for each month and year over the period. Some key insights include: travel arrangement/reservation services wages increased each year; May and June averages are almost identical for all industries; and administrative/support services and business support services have the most similar average wages.
The document analyzes average pay rates across four industries from 2009-2019 using two pivot tables. The first pivot table shows that radio broadcasting and independent artists have the highest average rates in recent years, while gambling and spectator sports have the lowest. The second pivot table reveals that over time, the industry with the highest and lowest rates has changed. The analysis found pay varies by both industry and month, with most industries paying highest at year-end.
The document contains data on average pay rates for four industries from 2011-2021: Arts, entertainment, and recreation; Performing arts and spectator sports; Arts and sports promoters and agents and managers for public figures; and Independent artists, writers, and performers. The data shows that November consistently has high pay rates, 2013 consistently had low pay rates, and 2021 consistently had high pay rates across all industries. The industry with the highest recent average pay is Independent artists, writers, and performers, while Arts, entertainment, and recreation has the lowest.
The document contains data on average pay rates for four industries from 2011-2021: Arts, entertainment, and recreation; Performing arts and spectator sports; Arts and sports promoters and agents and managers for public figures; and Independent artists, writers, and performers. The data shows that November consistently has high pay rates across industries, while 2013 consistently had low pay rates. The industry with the highest recent average pay is Independent artists, writers, and performers, while Arts, entertainment, and recreation has the lowest.
The document contains data on average pay rates for four industries from 2011-2021: Arts, entertainment, and recreation; Performing arts and spectator sports; Arts and sports promoters and agents and managers for public figures; and Independent artists, writers, and performers. It finds that November consistently has high pay rates, 2013 consistently had low pay rates, and 2021 consistently had high pay rates across all industries. The industry with the highest recent average pay is Independent artists, writers, and performers, while Arts, entertainment, and recreation has the lowest.
The document analyzes pay data for four industries related to arts and entertainment over multiple years. It finds that independent artists, writers and performers had the highest average pay of $37.34, while arts, entertainment and recreation had the lowest of $22.15. Independent artists and motion picture/sound recording industries had similar average pays of around $36-37. Arts and entertainment pay was highest from September to April each year and lowest from June to August.
This summary report analyzes wage data from 2010-2020 for four industries: arts, entertainment, and recreation; independent artists, writers, and performers; amusements, gambling, and recreation; and amusement parks and arcades. The key findings are that independent artists had the highest average wages in 2019-2020, amusement parks had the lowest in 2019-2020, and all industries saw their lowest average wages in 2020. Pivot tables in the report also show monthly and annual wage averages for each industry over this period.
The document summarizes wage data from 2011-2021 for four different industries: Motion Picture and Sound Recording Industries, Marketing Consulting Services, Arts, Entertainment, and Recreation, and Performing Arts and Spectator Sports. It finds that Marketing Consulting Services consistently had the highest average wages over the past decade while Motion Picture and Sound Recording saw the largest increase at 37%. It also notes that wages in all industries tend to be lowest from May to August and that Arts, Entertainment, and Recreation consistently had the lowest average rates from 2011-2021.
The document contains data on average hourly pay rates for four occupations in different industries from 2012-2022. It includes pivot tables showing monthly and yearly averages. The highest paying industry was Independent artists, writers, and performers while the lowest was Arts, entertainment, and recreation. Pay rates were generally highest in late fall/winter and lowest in late spring/summer. Arts, entertainment, and recreation consistently had the lowest pay over the past decade.
The document analyzes sales data for four industries - men's clothing stores, sporting goods stores, hobby/toy/game stores, and electronic/mail-order houses - over the period of 2009-2019. It finds that electronic/mail-order houses had the highest average rates and consistency over months and years, while hobby/toy/game stores had the lowest averages and consistency. Sporting goods stores and hobby/toy/game stores had similar average pay.
The document contains data on average rates for different industries from 2008 to 2018. It includes a pivot table with monthly averages for each industry and a series report with monthly rates. The industry with the highest average rates for recent years is management consulting services, while the lowest is financial transaction processing and clearing.
This document contains monthly wage data from 2009 to 2019 for four different industries: administrative and support services, professional employer organizations, business support services, and travel arrangement and reservation services. It shows the average hourly wage for each industry by year and month. Some key insights include: travel arrangement/reservation services wages increased yearly; May and June averages are almost identical for many industries; and administrative/support services and business support services have similar average wages in recent years.
The document shows weekly savings amounts and balances over 52 weeks. It starts with a $1 deposit on December 29th and $1 balance. Each following week an additional $1-51 is deposited, increasing the running balance. By the final week of December 22nd, the balance reached $1,378 after deposits totalling $1,326 over the course of the year.
The document contains summaries of pay data for four retail industries: furniture and home furnishings stores, electronics and appliance stores, building material and garden supply stores, and food and beverage stores. It provides average pay rates by month and year for each industry from 2009 to 2019. The electronics and appliance stores industry had the highest average pay, while food and beverage stores consistently had the lowest average pay. Pay rates increased over time for all industries.
The document contains data on various industries from 2008-2018 including average rates, monthly rates, and yearly rates. It analyzes the computer systems design industry, which had the highest average rates in recent years, as well as the building inspection industry, which had the lowest. The data shows all industries increased over the 10-year period from 2008 to 2018. The document also notes September had the highest values across industries each year.
The document is a summary report analyzing trends in four financial industries from 2012-2022. It finds that portfolio management had the highest average rates in the last two years while commercial banking had the lowest. All industries generally increased over the past decade with 2022 being the highest year for most. The greatest increase in average rates over the last year was in all other financial investment activities.
This document contains monthly wage data from 2012 to 2022 for four professional services industries: professional and business services, marketing consulting services, public relations agencies, and marketing research and public opinion polling. There was a steady increase in average wages across all four industries over the 10-year period. Public relations agencies consistently had the highest average wages, while professional and business services generally had the lowest. Marketing consulting services saw relatively stable average pay throughout each year.
This document contains summary reports and pivot tables analyzing average rates for four construction industries from 2011-2021. The commercial building industry had the highest average rates from 2019-2021 at $36.24 while residential remodelers had the lowest at $27.83. The industrial and commercial building industries had similar average rates that differed by only $0.42. The month of June generally had the lowest average rates across all industries.
The document contains monthly capacity and budgeting projections for a hotel called the Futurist Hotel Concept Z'Dublin'I**** for the year 2016. It includes projections for room numbers, prices, budgets, expenses, room rates and packages, and projected totals for accommodation, exploitation and risks. The projections show steady occupancy from January through December with rates varying by month. A total annual budget of over 12 million euros is projected along with potential risks and additional projected figures.
This document outlines a 52-week forex trading plan, starting with an opening balance of $1,000 and gradually increasing the trade size and expected profits over time. It projects the balance, trade size, PIP target, daily profit, and weekly profit for each week. The plan aims to reach a balance of $119,800 after 52 weeks by consistently trading with profits of $50-2,500 per day and $150-7,500 per week depending on the month and trade size.
At Techbox Square, in Singapore, we're not just creative web designers and developers, we're the driving force behind your brand identity. Contact us today.
B2B payments are rapidly changing. Find out the 5 key questions you need to be asking yourself to be sure you are mastering B2B payments today. Learn more at www.BlueSnap.com.
Digital Marketing with a Focus on Sustainabilitysssourabhsharma
Digital Marketing best practices including influencer marketing, content creators, and omnichannel marketing for Sustainable Brands at the Sustainable Cosmetics Summit 2024 in New York
Easily Verify Compliance and Security with Binance KYCAny kyc Account
Use our simple KYC verification guide to make sure your Binance account is safe and compliant. Discover the fundamentals, appreciate the significance of KYC, and trade on one of the biggest cryptocurrency exchanges with confidence.
Discover timeless style with the 2022 Vintage Roman Numerals Men's Ring. Crafted from premium stainless steel, this 6mm wide ring embodies elegance and durability. Perfect as a gift, it seamlessly blends classic Roman numeral detailing with modern sophistication, making it an ideal accessory for any occasion.
https://rb.gy/usj1a2
Best practices for project execution and deliveryCLIVE MINCHIN
A select set of project management best practices to keep your project on-track, on-cost and aligned to scope. Many firms have don't have the necessary skills, diligence, methods and oversight of their projects; this leads to slippage, higher costs and longer timeframes. Often firms have a history of projects that simply failed to move the needle. These best practices will help your firm avoid these pitfalls but they require fortitude to apply.
Understanding User Needs and Satisfying ThemAggregage
https://www.productmanagementtoday.com/frs/26903918/understanding-user-needs-and-satisfying-them
We know we want to create products which our customers find to be valuable. Whether we label it as customer-centric or product-led depends on how long we've been doing product management. There are three challenges we face when doing this. The obvious challenge is figuring out what our users need; the non-obvious challenges are in creating a shared understanding of those needs and in sensing if what we're doing is meeting those needs.
In this webinar, we won't focus on the research methods for discovering user-needs. We will focus on synthesis of the needs we discover, communication and alignment tools, and how we operationalize addressing those needs.
Industry expert Scott Sehlhorst will:
• Introduce a taxonomy for user goals with real world examples
• Present the Onion Diagram, a tool for contextualizing task-level goals
• Illustrate how customer journey maps capture activity-level and task-level goals
• Demonstrate the best approach to selection and prioritization of user-goals to address
• Highlight the crucial benchmarks, observable changes, in ensuring fulfillment of customer needs
HOW TO START UP A COMPANY A STEP-BY-STEP GUIDE.pdf46adnanshahzad
How to Start Up a Company: A Step-by-Step Guide Starting a company is an exciting adventure that combines creativity, strategy, and hard work. It can seem overwhelming at first, but with the right guidance, anyone can transform a great idea into a successful business. Let's dive into how to start up a company, from the initial spark of an idea to securing funding and launching your startup.
Introduction
Have you ever dreamed of turning your innovative idea into a thriving business? Starting a company involves numerous steps and decisions, but don't worry—we're here to help. Whether you're exploring how to start a startup company or wondering how to start up a small business, this guide will walk you through the process, step by step.
3 Simple Steps To Buy Verified Payoneer Account In 2024SEOSMMEARTH
Buy Verified Payoneer Account: Quick and Secure Way to Receive Payments
Buy Verified Payoneer Account With 100% secure documents, [ USA, UK, CA ]. Are you looking for a reliable and safe way to receive payments online? Then you need buy verified Payoneer account ! Payoneer is a global payment platform that allows businesses and individuals to send and receive money in over 200 countries.
If You Want To More Information just Contact Now:
Skype: SEOSMMEARTH
Telegram: @seosmmearth
Gmail: seosmmearth@gmail.com
How are Lilac French Bulldogs Beauty Charming the World and Capturing Hearts....Lacey Max
“After being the most listed dog breed in the United States for 31
years in a row, the Labrador Retriever has dropped to second place
in the American Kennel Club's annual survey of the country's most
popular canines. The French Bulldog is the new top dog in the
United States as of 2022. The stylish puppy has ascended the
rankings in rapid time despite having health concerns and limited
color choices.”
Navigating the world of forex trading can be challenging, especially for beginners. To help you make an informed decision, we have comprehensively compared the best forex brokers in India for 2024. This article, reviewed by Top Forex Brokers Review, will cover featured award winners, the best forex brokers, featured offers, the best copy trading platforms, the best forex brokers for beginners, the best MetaTrader brokers, and recently updated reviews. We will focus on FP Markets, Black Bull, EightCap, IC Markets, and Octa.
The 10 Most Influential Leaders Guiding Corporate Evolution, 2024.pdfthesiliconleaders
In the recent edition, The 10 Most Influential Leaders Guiding Corporate Evolution, 2024, The Silicon Leaders magazine gladly features Dejan Štancer, President of the Global Chamber of Business Leaders (GCBL), along with other leaders.
[To download this presentation, visit:
https://www.oeconsulting.com.sg/training-presentations]
This PowerPoint compilation offers a comprehensive overview of 20 leading innovation management frameworks and methodologies, selected for their broad applicability across various industries and organizational contexts. These frameworks are valuable resources for a wide range of users, including business professionals, educators, and consultants.
Each framework is presented with visually engaging diagrams and templates, ensuring the content is both informative and appealing. While this compilation is thorough, please note that the slides are intended as supplementary resources and may not be sufficient for standalone instructional purposes.
This compilation is ideal for anyone looking to enhance their understanding of innovation management and drive meaningful change within their organization. Whether you aim to improve product development processes, enhance customer experiences, or drive digital transformation, these frameworks offer valuable insights and tools to help you achieve your goals.
INCLUDED FRAMEWORKS/MODELS:
1. Stanford’s Design Thinking
2. IDEO’s Human-Centered Design
3. Strategyzer’s Business Model Innovation
4. Lean Startup Methodology
5. Agile Innovation Framework
6. Doblin’s Ten Types of Innovation
7. McKinsey’s Three Horizons of Growth
8. Customer Journey Map
9. Christensen’s Disruptive Innovation Theory
10. Blue Ocean Strategy
11. Strategyn’s Jobs-To-Be-Done (JTBD) Framework with Job Map
12. Design Sprint Framework
13. The Double Diamond
14. Lean Six Sigma DMAIC
15. TRIZ Problem-Solving Framework
16. Edward de Bono’s Six Thinking Hats
17. Stage-Gate Model
18. Toyota’s Six Steps of Kaizen
19. Microsoft’s Digital Transformation Framework
20. Design for Six Sigma (DFSS)
To download this presentation, visit:
https://www.oeconsulting.com.sg/training-presentations
Hamster Kombat' Telegram Game Surpasses 100 Million Players—Token Release Sch...
Market Analysis
1. Summary
Ashton Hilson
Date Created: 2/1/20
Date Opened: 2/2/20
Industry Series ID
Arts, entertainment, and recreation CEU7071000002
Performing arts and spectator sports CEU7071100002
Spectator sports CEU7071120002
Other amusement and recreation industries CEU7071390002
The industries with similar pay are spectator sports and performing arts from
2009-2019
Something I noticed in Other Amusement that the pay would be at its highest
during the summer months (Jun, July, Aug) before spiking back down.
For Arts, entertainment, recreation, and other amusement and recreation they
peek during June, July, and Aug. While the other two are opposite.
There is no consistency to be found among the industries.
There has been a steady decrease starting from 2016 to now in the going rates
for all industries.
I chose these four industries because this is where I see my career
path starting.
Industry with the highest Average Rates for most recent years is spectator
sports.
Industry with the lowest Average Rates for most recent years is other
amusement and recreation industries.
2. Main Data
Ashton Hilson
Date Created: 2/1/20
Date Opened: 2/2/20
Year Month
Arts, entertainment,
and recreation
Performing arts and
spectator sports
Spectator sports
Other amusement and
recreation industries
2009 Jan $24.50 $27.90 $29.60 $21.90
2009 Feb $24.90 $28.20 $30.40 $22.50
2009 Mar $24.90 $27.90 $29.60 $22.40
2009 Apr $25.00 $27.20 $27.90 $22.60
2009 May $24.40 $26.90 $27.00 $22.60
2009 Jun $24.80 $26.90 $26.70 $22.90
2009 Jul $25.60 $26.70 $26.50 $23.80
2009 Aug $25.80 $27.10 $26.40 $24.00
2009 Sep $24.60 $26.80 $26.70 $22.70
2009 Oct $24.70 $27.50 $28.10 $22.40
2009 Nov $25.40 $29.00 $30.40 $22.60
2009 Dec $25.00 $28.40 $29.00 $22.40
2010 Jan $24.80 $28.40 $28.80 $22.10
2010 Feb $24.80 $28.20 $29.20 $22.30
2010 Mar $24.80 $27.90 $27.70 $22.40
2010 Apr $24.90 $26.90 $26.00 $23.00
2010 May $24.90 $26.70 $25.50 $23.30
2010 Jun $25.60 $27.00 $26.00 $23.90
2010 Jul $26.30 $26.20 $25.20 $24.90
2010 Aug $26.30 $26.60 $26.10 $25.00
2010 Sep $24.50 $26.30 $26.40 $23.10
2010 Oct $24.80 $27.40 $27.70 $22.90
2010 Nov $25.00 $28.10 $29.20 $22.60
2010 Dec $24.80 $27.60 $29.70 $22.40
2011 Jan $25.20 $29.30 $31.00 $22.50
2011 Feb $24.90 $28.80 $30.30 $22.30
2011 Mar $24.60 $28.00 $29.70 $22.20
3. Main Data
Ashton Hilson
Date Created: 2/1/20
Date Opened: 2/2/20
Year Month
Arts, entertainment,
and recreation
Performing arts and
spectator sports
Spectator sports
Other amusement and
recreation industries
2011 Apr $24.80 $27.80 $28.80 $22.70
2011 May $24.80 $28.30 $28.80 $22.90
2011 Jun $25.20 $27.20 $27.50 $23.50
2011 Jul $25.90 $27.50 $27.40 $24.10
2011 Aug $25.70 $27.40 $27.60 $23.80
2011 Sep $24.10 $26.30 $27.80 $22.30
2011 Oct $25.20 $28.00 $29.80 $22.90
2011 Nov $24.70 $28.20 $31.40 $22.00
2011 Dec $24.80 $28.60 $31.20 $22.10
2012 Jan $25.10 $29.20 $32.40 $22.00
2012 Feb $24.70 $28.90 $31.90 $21.70
2012 Mar $24.60 $28.10 $30.30 $21.70
2012 Apr $24.60 $26.40 $25.00 $22.60
2012 May $23.80 $25.80 $24.40 $22.20
2012 Jun $25.00 $26.40 $24.90 $23.30
2012 Jul $25.90 $26.90 $25.30 $24.10
2012 Aug $25.20 $26.20 $26.30 $23.40
2012 Sep $24.30 $26.70 $27.50 $22.80
2012 Oct $24.10 $26.40 $28.10 $22.30
2012 Nov $24.20 $26.90 $28.10 $21.80
2012 Dec $24.90 $27.60 $29.00 $22.90
2013 Jan $24.30 $26.80 $28.30 $21.90
2013 Feb $24.50 $26.80 $28.00 $22.50
2013 Mar $24.60 $26.40 $26.40 $22.50
2013 Apr $24.20 $25.50 $24.90 $22.80
2013 May $24.10 $25.70 $24.60 $22.90
2013 Jun $25.60 $26.70 $25.60 $24.20
4. Main Data
Ashton Hilson
Date Created: 2/1/20
Date Opened: 2/2/20
Year Month
Arts, entertainment,
and recreation
Performing arts and
spectator sports
Spectator sports
Other amusement and
recreation industries
2013 Jul $25.70 $26.20 $25.00 $24.10
2013 Aug $25.30 $25.70 $25.40 $23.80
2013 Sep $24.70 $26.20 $27.50 $23.60
2013 Oct $24.20 $25.90 $27.70 $22.80
2013 Nov $24.40 $26.20 $29.10 $22.60
2013 Dec $24.60 $27.10 $30.30 $22.80
2014 Jan $24.30 $26.80 $29.70 $22.10
2014 Feb $25.00 $27.90 $31.40 $22.90
2014 Mar $25.40 $27.40 $30.60 $23.30
2014 Apr $24.70 $26.90 $28.10 $23.10
2014 May $24.50 $26.90 $27.70 $23.00
2014 Jun $25.70 $27.90 $28.90 $24.00
2014 Jul $26.10 $27.70 $28.50 $24.20
2014 Aug $26.00 $28.20 $28.90 $23.90
2014 Sep $24.90 $27.60 $28.70 $23.00
2014 Oct $24.80 $27.50 $29.10 $22.70
2014 Nov $25.40 $28.70 $31.10 $22.90
2014 Dec $24.90 $28.10 $29.90 $22.60
2015 Jan $24.90 $28.30 $30.30 $22.30
2015 Feb $25.40 $28.50 $30.00 $23.10
2015 Mar $25.60 $28.40 $29.30 $23.10
2015 Apr $24.80 $27.00 $26.60 $22.90
2015 May $24.50 $26.60 $26.30 $22.90
2015 Jun $25.40 $27.30 $25.10 $23.80
2015 Jul $26.10 $27.60 $25.80 $24.20
2015 Aug $26.30 $28.50 $27.10 $24.30
2015 Sep $24.90 $28.00 $26.80 $22.90
5. Main Data
Ashton Hilson
Date Created: 2/1/20
Date Opened: 2/2/20
Year Month
Arts, entertainment,
and recreation
Performing arts and
spectator sports
Spectator sports
Other amusement and
recreation industries
2015 Oct $25.00 $28.30 $28.50 $22.70
2015 Nov $25.20 $28.70 $30.10 $22.80
2015 Dec $24.90 $28.10 $29.20 $22.60
2016 Jan $24.80 $28.30 $30.00 $22.20
2016 Feb $24.90 $28.00 $29.50 $22.50
2016 Mar $24.70 $27.70 $28.80 $22.30
2016 Apr $24.30 $27.40 $27.60 $22.20
2016 May $24.50 $27.60 $27.90 $22.80
2016 Jun $25.10 $27.00 $27.00 $23.10
2016 Jul $25.70 $26.90 $26.50 $23.60
2016 Aug $25.30 $27.40 $27.10 $23.20
2016 Sep $24.10 $26.90 $27.80 $22.20
2016 Oct $24.70 $28.30 $30.30 $22.40
2016 Nov $24.40 $28.00 $30.20 $21.80
2016 Dec $24.40 $28.00 $30.30 $21.80
2017 Jan $24.50 $28.60 $30.30 $21.80
2017 Feb $24.30 $28.00 $30.30 $21.70
2017 Mar $24.20 $27.80 $29.70 $21.60
2017 Apr $24.40 $27.10 $27.50 $22.40
2017 May $23.70 $26.40 $26.70 $22.00
2017 Jun $24.60 $25.50 $25.30 $23.10
2017 Jul $25.40 $25.90 $25.20 $23.90
2017 Aug $24.80 $25.60 $25.00 $23.10
2017 Sep $23.80 $25.90 $27.20 $22.30
2017 Oct $24.60 $26.80 $29.30 $22.70
2017 Nov $24.00 $26.20 $29.30 $21.90
2017 Dec $24.00 $26.30 $28.80 $22.00
6. Main Data
Ashton Hilson
Date Created: 2/1/20
Date Opened: 2/2/20
Year Month
Arts, entertainment,
and recreation
Performing arts and
spectator sports
Spectator sports
Other amusement and
recreation industries
2018 Jan $24.00 $26.80 $29.50 $21.60
2018 Feb $24.10 $26.10 $30.30 $22.10
2018 Mar $24.00 $26.30 $28.50 $22.10
2018 Apr $24.00 $26.00 $27.30 $22.30
2018 May $23.60 $25.00 $26.20 $22.30
2018 Jun $24.50 $25.70 $25.80 $23.20
2018 Jul $25.40 $26.40 $26.70 $24.00
2018 Aug $24.70 $26.10 $26.60 $23.20
2018 Sep $23.70 $26.50 $28.30 $22.40
2018 Oct $23.70 $24.80 $27.60 $22.10
2018 Nov $23.70 $25.20 $28.80 $21.70
2018 Dec $24.10 $26.00 $29.90 $22.20
2019 Jan $23.80 $26.20 $30.30 $21.60
2019 Feb $23.90 $26.90 $31.20 $21.60
2019 Mar $23.70 $25.80 $29.10 $21.50
2019 Apr $23.50 $25.80 $27.10 $21.60
2019 May $22.90 $25.20 $26.80 $21.20
2019 Jun $24.30 $26.60 $27.60 $22.50
2019 Jul $24.50 $25.70 $25.90 $22.60
2019 Aug $24.10 $25.70 $25.60 $22.40
2019 Sep $23.60 $25.10 $26.30 $21.90
2019 Oct $23.20 $24.90 $27.40 $21.10
7. Pivot Tables
Ashton Hilson
Date Created: 2/1/20
Date Opened: 2/2/20
Row Labels Average of Arts,
entertainment, and
recreation
Average of Performing
arts and spectator
sports
Average of Spectator
sports
Average of Other amusement
and recreation industries
Jan $24.56 $27.87 $30.02 $22.00
Feb $24.67 $27.85 $30.23 $22.29
Mar $24.65 $27.43 $29.06 $22.28
Apr $24.47 $26.73 $26.98 $22.56
May $24.15 $26.46 $26.54 $22.55
Jun $25.07 $26.75 $26.40 $23.41
Jul $25.69 $26.70 $26.18 $23.95
Aug $25.41 $26.77 $26.55 $23.65
Sep $24.29 $26.57 $27.36 $22.65
Oct $24.45 $26.89 $28.51 $22.45
Nov $24.64 $27.52 $29.77 $22.27
Dec $24.64 $27.58 $29.73 $22.38
Grand Total $24.73 $27.09 $28.09 $22.71
Row Labels Average of Arts,
entertainment, and
recreation
Average of Performing
arts and spectator
sports
Average of Spectator
sports
Average of Other amusement
and recreation industries
2009 $24.97 $27.54 $28.19 $22.73
2010 $25.13 $27.28 $27.29 $23.16
2011 $24.99 $27.95 $29.28 $22.78
2012 $24.70 $27.13 $27.77 $22.57
2013 $24.68 $26.27 $26.90 $23.04
2014 $25.14 $27.63 $29.38 $23.14
2015 $25.25 $27.94 $27.93 $23.13
2016 $24.74 $27.63 $28.58 $22.51
2017 $24.36 $26.68 $27.88 $22.38
2018 $24.13 $25.91 $27.96 $22.43
2019 $23.75 $25.79 $27.73 $21.80
Grand Total $24.73 $27.09 $28.09 $22.71