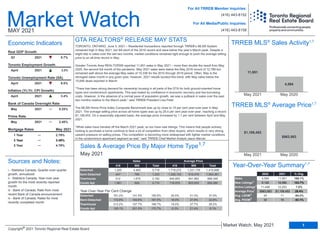
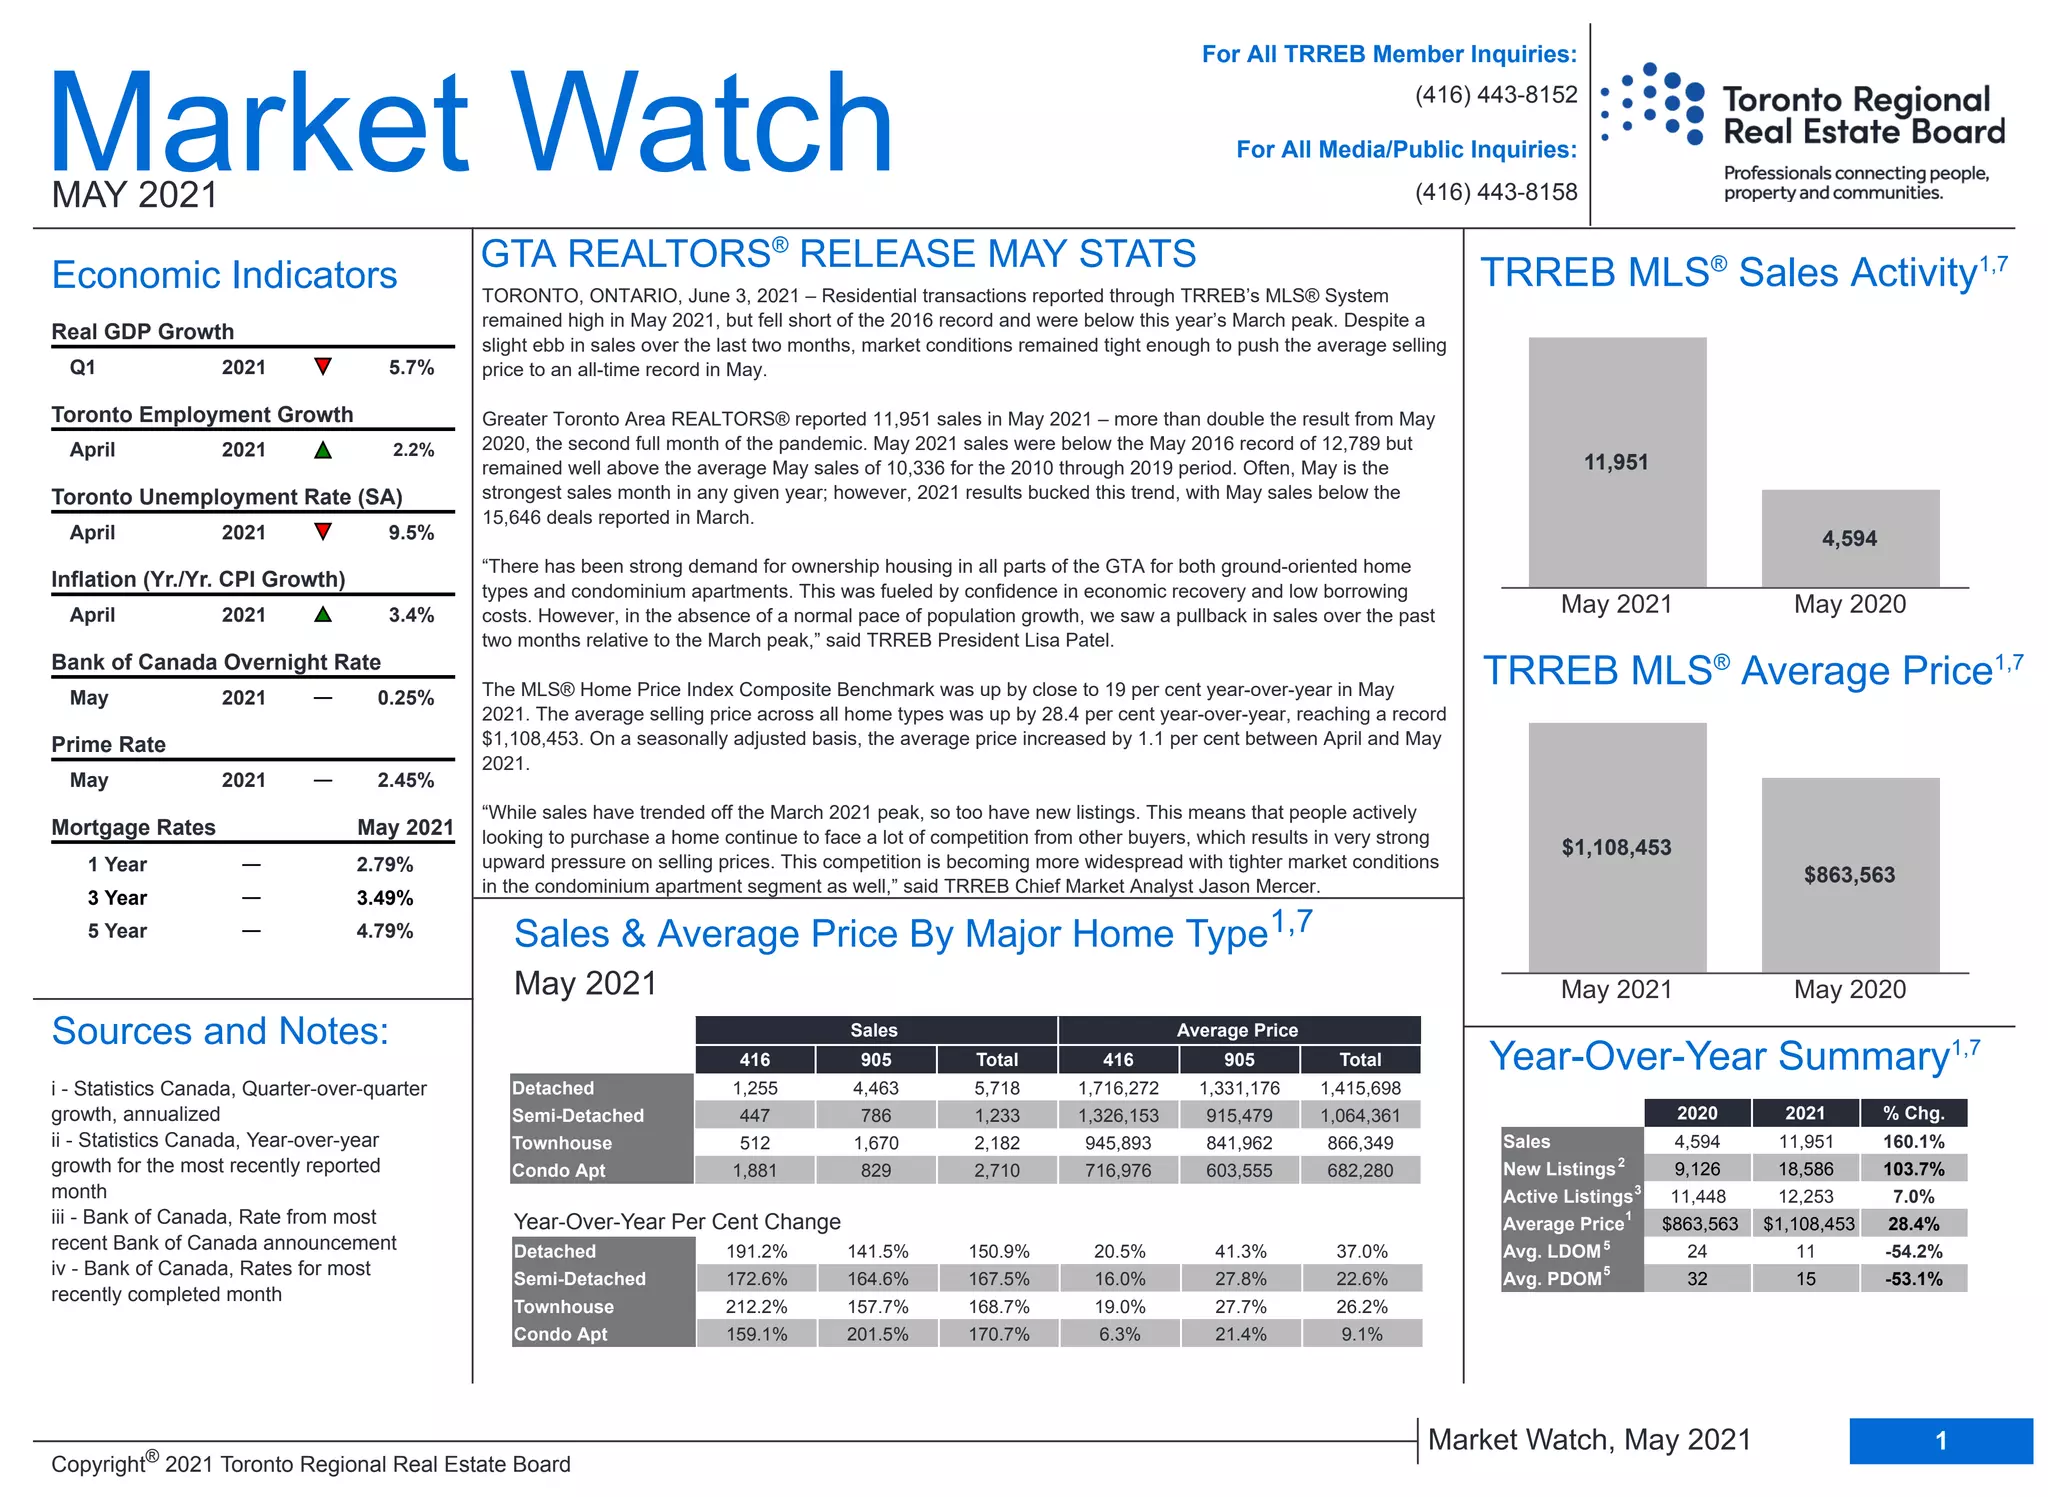
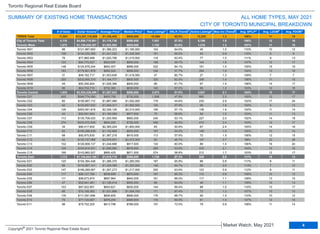
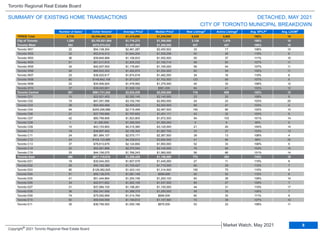
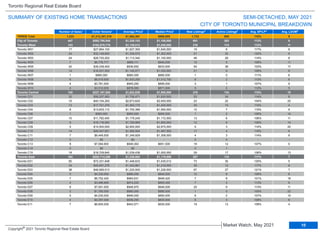
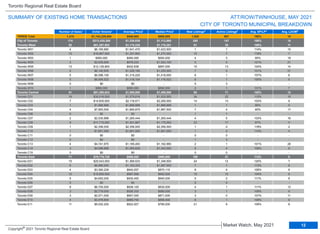
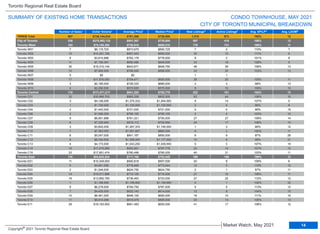
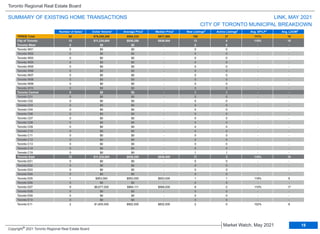
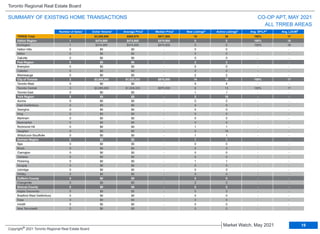
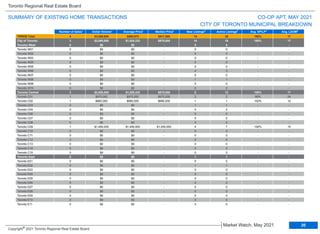
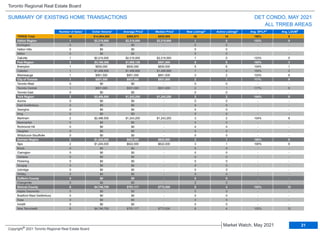
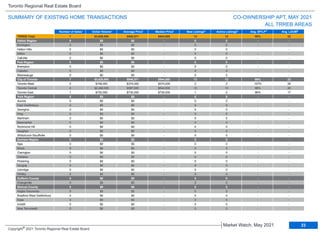
Residential real estate transactions in the Greater Toronto Area remained high in May 2021 compared to the same period last year, though sales have declined slightly from the peak in March 2021. The average home selling price reached a new record high of $1,108,453 in May 2021, up 28.4% from May 2020. While sales activity has slowed, new listings have also decreased, keeping market conditions tight and upward pressure on home prices. The decline in sales over the past two months is likely due to the absence of typical population growth rather than a cooling housing market.
The average selling price for April 2013 transactions was $526,335
–
up by two per cent
in comparison to April 2012. The MLS® HPI Composite Benchmark Price was up by 2.9
per cent
As a growing number of homebuyers, many of whom put their purchase on hold due to stricter lending guidelines, now reactivate their search, the expectation is for
renewed growth in home sales in the second half of 2013,"
THE TORONTO REAL ESTATE BOARD'S MAY 2018 MARKET SALES STATISTICS WITH MEDIA R...Shawn Venasse
June 4, 2018 -- Greater Toronto Area REALTORS® reported 7,834 sales through TREB's MLS® System in May 2018. This result was down by 22.2 per cent compared to May 2017. While the number of sales was down year-over-year, the annual rate of decline was less than reported in February, March and April, when sales were down by more than 30 per cent. On a month-over-month basis, seasonally adjusted May sales were basically flat compared to April.
The Real Estate Board of Greater Vancouver (REBGV) reports that residential home sales in the
region totalled 1,929 in August 2018, a 36.6 per cent decrease from the 3,043 sales record
"We are on track for record home sales reported through TREB's MLS® System this year. Barring a drastic shift in the economy over the next three months, total transactions reported by TREB Members in 2015 are expected to be at or near the 100,000 mark. This is a testament to the importance that GTA households put on home ownership as a long-term investment," said Mr. McLean.
“Whether we’re talking about existing homeowners or people looking to purchase for the first time, there is no shortage of buyers in the marketplace today. So, while the record number of home sales through the first five months of 2016 is not necessarily
surprising, it does sometimes mask the larger story in the GTA: the shortage of listings, which has resulted in strong upward pressure on home prices,” said Mr. McLean.
Strong Sales & Price Growth in August
The MLS® Home Price Index (HPI) Composite Benchmark for August 2016 was up by 17.2 per cent on a year-over-year basis. Similarly, the average selling price for all home types combined
was up by 17.7 per cent on an annual basis to $710,410. Both the MLS® HPI benchmarks and average prices for low-rise home types were up by double digits percentage-wise.
TORONTO REAL ESTATE BOARD'S -- MARKET WATCH - JULY 2019Shawn Venasse
Toronto Real Estate Board President Michael Collins announced that Greater Toronto Area REALTORS® reported 8,595 sales through TREB's MLS® System in July 2019. This result was up by 24.3 per cent compared to July 2018. On a month-over-month basis, sales were up by 5.1 per cent, after preliminary seasonal adjustment.
New listings entered into TREB's MLS® System in July 2019 were up compared to July 2018, but by a much lesser annual rate than sales, at 3.7 per cent. With annual growth in sales far outstripping annual growth in new listings, market conditions clearly tightened compared to last year. Active listings at the end of July were down by 9.1 per cent year-over-year, further reflecting tightening market conditions.
As market conditions continued to tighten in July, the average selling price increased by 3.2 per cent on a year-over-year basis to $806,755. The MLS® Home Price Index Composite benchmark was up by 4.4 per cent. Higher density home types continued to drive price growth, whereas detached home prices remained down in many communities throughout the GTA.
Broadly speaking, increased competition between buyers for available properties has resulted in relatively strong price growth above the rate of inflation for semi-detached houses, townhouses and condominium apartments. However, the single-detached market segment, which has arguably been impacted most by the OSFI stress test, has experienced a slower pace of price growth, with average detached prices remaining lower than last year's levels in some parts of the GTA.
Toronto Real Estate Board released this Outlook Report 2017. Interesting facts and analysis of what the year ahead will hold. What is impacting housing affordability and beyond.
BricknBolt Understanding Load-Bearing Walls and Their Structural Support in H...BrickAndBolt
Load-bearing walls are the backbone of any home construction, providing crucial structural support that carries the weight of the house above. For companies like Brick and Bolt Mysore and Bricknbolt Faridabad, understanding and properly implementing these elements are key to constructing safe and durable buildings.
Referans Bahcesehir which is being constructed, in the center of the most regional destination as Bahçeşehir, shines out with its central location and unique landscape including social facilities such as a fitness center, sauna, sports facilities, children’s playground and recreational areas.
Not only drawing attention for immediate surroundings including commercial centers and private schools but also providing the easily accessible location with closeness to Tem Highway and connection roads, ongoing construction of 3rd Bridge Connection roads and Metro Projects
Bahcesehir is a rising value in the great city of Istanbul… Located at a new transportation junction in the northwest of the City… Located at such a spot that the access roads for the 3rd bridge and for the 3rd Airport will reach the region in 2016. The Marmaray and the Subway will extend all the way to Referans Bahcesehir respectively in 2018 and 2019.
465 flats and 34 stores are designed with an outstanding approach and arranged with a unique perspective offering the following options: 1 plus 1, 2 plus 1, 3 plus 1, 3.5 plus 1, 4 plus 1, and 4.5 plus 1. It is planned so as to safeguard you and your loved ones based upon a modern, technological safety approach. As you experience the joy and luxury here, you will be content and feet at ease.
It is worth seeing both inside and outside with heart-warming cafes, tasty restaurants and elegant stores… And it is ready to offer a vivacious social life with a warm and cozy space design.
A folding swimming pool and indoor swimming pools, playgrounds, Turkish bath, sauna… It has them all. Everything you need for your well-being and for having a pleasant time will be at your service. You simply need to align the rhythm of life with the rhythm of Referans Bahcesehir.
https://listingturkey.com/property/referans-bahcesehir/
Simpolo Tiles & Bathware
Tile ho,
toh Simpolo.
Since the first steps were taken in 1977, Simpolo Ceramics has carved its niche as a consistently growing organisation with unparalleled innovation and passion rooted in simplicity.
We endure gratification for every experience we offer, created to share something meaningful. It may not resonate with the majority, but that makes us a class apart. If only a handful were to understand the purpose of our existence, we would be proud to have found our believers. Rather, people with whom we can share our beliefs.
VISUALIZER
Design your space in your style with our very own Visualizer. Now, you can choose the tiles of your liking from our wide selection and see how they would look in a space. Select the tile from the multiple options and the visualiser will replace the surfaces in the image with the selected tiles. This way, instead of just your imagination, you can choose the tiles for your place by getting an actual picture of how they would look in a space. So, design your space the way you desire digitally and implement it in real life to get the best results!
You can also share this visualiser with others to help them design their space.
Committed to delighting customers with world-class ceramic products and services. Make Simpolo synonymous with the best quality and set new benchmarks of excellence for all stakeholders. Pursue best business practices with utmost integrity to make Simpolo an exciting organisation to work with, for vendors, channel partners, investors and employees alike.
Gain worldwide recognition in the field of ceramic building products through Research and Innovation and bring an enhanced lifestyle within reach for every household.
The SVN® organization shares a portion of their new weekly listings via their SVN Live® Weekly Property Broadcast. Visit https://svn.com/svn-live/ if you would like to attend our weekly call, which we open up to the brokerage community.
Rixos Tersane Istanbul Residences Brochure_May2024_ENG.pdfListing Turkey
Tersane Suites Residences is a luxurious real estate project located in the heart of Istanbul, next to the beautiful Golden Horn. This unique development offers hotel concept residences with Rixos management, making it the perfect choice for both homeowners and investors.
The Tersane Suites Residences offers a wide range of options, from studio apartments to spacious four-bedroom units, all designed to the highest standard. The suites are finished with high-quality materials and feature modern, open-plan living spaces, fully-equipped kitchens, and large balconies with stunning views of the city and sea.
One of the standout features of Tersane Suites Residences is the Rixos management, which provides a truly exclusive and upscale living experience. Residents will have access to a range of luxury amenities, including a fitness center, spa, and indoor and outdoor swimming pools. Plus, the on-site restaurants and cafes provide a taste of the local and international cuisine.
The Tersane Suites Residences also offers a great opportunity for investors, as it provides a rental guarantee program. This means that investors can enjoy a steady income stream, with the peace of mind that their property is being managed by a reputable and experienced team.
The location of Tersane Suites Residences is also unbeatable, with easy access to the city’s main transportation links and within close proximity to the historic center, making it the perfect base for exploring all that Istanbul has to offer.
Torun Center Residences Istanbul - Listing TurkeyListing Turkey
THERE IS LIFE IN ITS CENTER!
The most energetic spot of the city that will add utterly different pleasures to your life, with a park that will make Istanbul breathe, delighting indoor and outdoor bistros, cafes, restaurants, the brand-new Food Hall concept, where dozens of unique tastes are served together, market area, cinema, theater, fitness club, SPA and event venue...
All the pleasures that will enrich your lives are awaiting you on the most beautiful side of the city, at Torun Center Residences. In Mecidiyeköy, where the heart of Istanbul beats, business, life and entertainment opportunities are located at the exact center, at Torun Center, the most beautiful side of the city.
Penthouse apartments and different styles of flats from 1 + 1 to 4 + 1, from 100 to 425 square meters in a 42-story residence tower, have been designed for those who want to live in the center of magnificence. Torun Center is the redefinition of a better life with specially landscaped floor gardens, apartment options with private balconies, and automatic glass systems equipped with Trickle Ventilation that offers clean air comfort.
Business and life in the same place
Excellent service
Torun Center has many delightful details, from a swimming pool to sunbathing and resting terrace. With 24/7 concierge services, 24/7 security, valet, technical service, closed-circuit camera system (CCTV), central heating and cooling system, it makes your life easier.
Delightful details
The two-story Torun Center Lounge, with its indoor and outdoor seating areas, children's playroom, private dining and TV lounge, promises unforgettable memories to you and your loved ones with its unique Istanbul view.
Neighboring to the most pleasant square of Istanbul
A few steps from the Torun Center Residences, you can reach the city's most modern city square and open the doors of a quality city life. Torun Center Residences brings together on the same project the long-awaited city life for Istanbul and gourmet restaurants, cafes, gym and SPA, and state-of-the-art cinema and Artı Stage, hosting the most famous plays of the season.
Located at the intersection of alternative public transportation options such as the metro and Metrobus, Torun Center comes to the fore as the most accessible office for both sides of Istanbul. With a central location and rich transportation lines, Torun Center offices make life easier for employees and increase productivity.
Scanning tenants in NYC requires a thorough and compliant approach to ensure you find reliable renters. For a positive rental experience, consider hiring a property management service. Belgium Management LLC specializes in NYC rental property management and tenant relationship management. We prioritize tenant satisfaction, making us a trusted name in New York property management. Our dedicated team ensures tenants feel valued and supported throughout their lease.
Keep Your Home Naturally Cool and Warm Out Change in Seasons
Vinra Construction is a private limited company registered under the ROC. The management has an experience of over 15 years of understanding the needs and delivering apt solutions to the end users We are providing turnkey solutions in construction fields. like Construction, Interior Designing Facility Management, Plantation Management, etc..
Vinra Construction Tech Enabled Company for Eco-Friendly Home Construction
Contact With Vinra for a Greener Future >>> Call us @ 888 4898 765
Elegant Evergreen Homes - Luxury Apartments Redefining Comfort in Yelahanka, ...JagadishKR1
Experience unmatched luxury at Elegant Evergreen Homes, offering exquisite 2, 3, and 4 BHK apartments in the serene locality of Yelahanka, Bangalore. These meticulously crafted homes blend modern design with timeless elegance, providing a harmonious living environment. Enjoy top-tier amenities and a prime location, making Elegant Evergreen Homes the ideal choice for discerning homeowners.
Investing In The US As A Canadian… And How To Do It RIGHT!! (feat. Erwin Szet...Volition Properties
=== Investing In The US As A Canadian… And How To Do It RIGHT!! (feat. Erwin Szeto) ===
Ever been curious about Real Estate Investing in the US?? At Volition, for the past 14 years, we have been focused on helping investors invest in over $250M of real estate and generate $100M of wealth in the Toronto market, but we are always open to learning more about other business models and learning from other investors.
The US has always been an intriguing market to invest in. But the US is a big place… if you’re interested in investing in the US, you probably have a lot of questions, like:
☑️ Specifically WHERE should you invest?
☑️ What are the best markets to invest in and why?
☑️ How much are property prices there?
☑️ What are the returns like?
☑️ What is cashflow like?
☑️ Compared to investing in Toronto or other cities in Ontario, what are the benefits / tradeoffs?
☑️ What ownership structure should I use?
☑️ What are the tax implications?
☑️ Can I get financing?
☑️ What are tenants like?
Enter Erwin Szeto, a longtime friend of Volition. Since 2005, Erwin Szeto and his team have navigated the challenging landscape of being landlords in Ontario. Now, they are shifting their focus and guiding their clients' investments toward the more landlord-friendly environment of the USA. This decision comes after assisting Canadian clients in transacting over $440,000,000 in income properties. Faced with issues like affordability constraints, tenant-friendly laws, rent control, and rental licensing in Canada, Erwin sees a clear opportunity in the U.S. Here, there is a significant influx of investments leading to the creation of high-paying manufacturing jobs. Erwin and his clients are poised to capitalize on these opportunities where landlord rights are stronger and there is no rent control.
To facilitate this transition, Erwin has partnered with and become a client of SHARE, a one-stop-shop U.S. Asset Manager. Founded by Canadians for Canadians, SHARE enables as passive an ownership experience as possible for landlords in the U.S., while still maintaining direct, 100% ownership.
Erwin is “Making Real Estate Investing Great Again”!!
Website: https://www.infinitywealth.ca/
Facebook: https://www.facebook.com/iwinrealestate and https://www.facebook.com/ErwinSzetoOfficial
Podcast: https://www.truthaboutrealestateinvesting.ca/
Instagram: https://www.instagram.com/iwinrealestate/ and https://www.instagram.com/erwinszeto/
MC Heights-Best Construction Company in jhanglaraibfatim009
MC Heights stands as the epitome of excellence in construction within Jhang. With a commitment to unparalleled quality and innovative design, MC Heights redefines urban living in the heart of Jhang. Offering luxurious residential spaces, cutting-edge commercial complexes, and vibrant community areas, MC Heights caters to the diverse needs of modern lifestyles. Our dedication to superior craftsmanship and customer satisfaction ensures that every aspect of MC Heights exceeds expectations, making it the premier choice for those seeking unparalleled sophistication and comfort in Jhang.
Presentation to Windust Meadows HOA Board of Directors June 4, 2024: Focus o...Joseph Lewis Aguirre
Presentation to Windust Meadows HOA Board of Directors June 4, 2024: Focus on Public Safety as Job #1, Engagement, Wealth of HOA, Branding, Communication, Culture, Civic Responsibility
Omaxe Sports City Dwarka stands out as a premier residential and recreational destination, offering a blend of luxury and sports-centric living. Located in the thriving area of Dwarka, this project by Omaxe Limited is designed to cater to modern lifestyle needs while promoting a healthy, active living environment.
Avrupa Konutlari Yenimahalle - Listing TurkeyListing Turkey
Welcome to Avrupa Konutları Yenimahalle, where luxury living meets unparalleled convenience in the heart of Istanbul. Developed by Artaş Holding, one of Turkey’s leading construction companies, this prestigious residential project offers a contemporary lifestyle experience like no other.
https://listingturkey.com/property/avrupa-konutlari-yenimahalle/
Oeiras Tech City, Developed by RE Capital and REIG, Will Become Lisbon's Futu...Newman George Leech
Oeiras Tech City, a historic development in the Oeiras municipality of Lisbon, is acquired by RE Capital and REIG. It is located on a 93,000-square-meter plot of land and combines co-living, business, and residential areas. It highlights ESG principles and is close to Tagus Park, which improves the urban landscape of Lisbon.
One FNG by Group 108 Sector 142 Noida Construction UpdateOne FNG
One FNG by Group 108 is launching a new commercial project in Sector 142 Noida. Office space and high street retail shops on the FNG and Noida Expressway. For more information visit the website https://www.onefng.com/
500 acres of brilliance await you here at Riverview City which offers modern living, effortless convenience, and a beautiful natural setting. It is a mega township by Magarpatta City in Loni Kalbhor, Pune. Enjoy easy access to work, schools, and fun while experiencing a perfect work-life balance.
Visit - magarpattacity.developerprojects.in
Urbanrise Paradise on Earth - Unveiling Unprecedented Luxury in Exquisite Vil...JagadishKR1
Immerse yourself in the epitome of luxury living at Urbanrise Paradise on Earth. These opulent 4 BHK villas, nestled off the prestigious Kanakapura Road in Bangalore, redefine elegance and sophistication. With meticulous craftsmanship, breathtaking design, and unparalleled amenities, Urbanrise Paradise on Earth offers a sanctuary where every moment is infused with luxury and serenity. Experience a life of grandeur and indulgence at this exclusive residential enclave.
Lixin Azarmehr, a Los Angeles-based real estate development trailblazer, co-founded JL Real Estate Development (JL RED) in 2015 and serves as its CEO. Her expertise has propelled the firm to specialize in luxury residential and mixed-use commercial projects, with a portfolio that features upscale retail spaces and sophisticated care facilities.
1. Sales
New Listings
Active Listings
Average Price
Avg. LDOM
Avg. PDOM
4,594 11,951 160.1%
9,126 18,586 103.7%
11,448 12,253 7.0%
$863,563 $1,108,453 28.4%
24 11 -54.2%
32 15 -53.1%
2020 2021 % Chg.
Year
Market Watch
MAY 2021
Economic Indicators
May 2021
GTA REALTORS®
RELEASE MAY STATS
TORONTO, ONTARIO, June 3, 2021 – Residential transactions reported through TRREB’s MLS® System
remained high in May 2021, but fell short of the 2016 record and were below this year’s March peak. Despite a
slight ebb in sales over the last two months, market conditions remained tight enough to push the average selling
price to an all-time record in May.
Greater Toronto Area REALTORS® reported 11,951 sales in May 2021 – more than double the result from May
2020, the second full month of the pandemic. May 2021 sales were below the May 2016 record of 12,789 but
remained well above the average May sales of 10,336 for the 2010 through 2019 period. Often, May is the
strongest sales month in any given year; however, 2021 results bucked this trend, with May sales below the
15,646 deals reported in March.
“There has been strong demand for ownership housing in all parts of the GTA for both ground-oriented home
types and condominium apartments. This was fueled by confidence in economic recovery and low borrowing
costs. However, in the absence of a normal pace of population growth, we saw a pullback in sales over the past
two months relative to the March peak,” said TRREB President Lisa Patel.
The MLS® Home Price Index Composite Benchmark was up by close to 19 per cent year-over-year in May
2021. The average selling price across all home types was up by 28.4 per cent year-over-year, reaching a record
$1,108,453. On a seasonally adjusted basis, the average price increased by 1.1 per cent between April and May
2021.
“While sales have trended off the March 2021 peak, so too have new listings. This means that people actively
looking to purchase a home continue to face a lot of competition from other buyers, which results in very strong
upward pressure on selling prices. This competition is becoming more widespread with tighter market conditions
in the condominium apartment segment as well,” said TRREB Chief Market Analyst Jason Mercer.
Sources and Notes:
i - Statistics Canada, Quarter-over-quarter
growth, annualized
ii - Statistics Canada, Year-over-year
growth for the most recently reported
month
iii - Bank of Canada, Rate from most
recent Bank of Canada announcement
iv - Bank of Canada, Rates for most
recently completed month
For All TRREB Member Inquiries:
For All Media/Public Inquiries:
(416) 443-8152
(416) 443-8158
May 2020
May 2021
11,951
4,594
Detached
Semi-Detached
Townhouse
Condo Apt
1,255 4,463 5,718 1,716,272 1,331,176 1,415,698
447 786 1,233 1,326,153 915,479 1,064,361
512 1,670 2,182 945,893 841,962 866,349
1,881 829 2,710 716,976 603,555 682,280
Sales Average Price
416 905 Total 416 905 Total
Home Type
Year-Over-Year Per Cent Change
May 2020
May 2021
$1,108,453
$863,563
Detached
Semi-Detached
Townhouse
Condo Apt
191.2% 141.5% 150.9% 20.5% 41.3% 37.0%
172.6% 164.6% 167.5% 16.0% 27.8% 22.6%
212.2% 157.7% 168.7% 19.0% 27.7% 26.2%
159.1% 201.5% 170.7% 6.3% 21.4% 9.1%
TRREB MLS®
Sales Activity1,7
TRREB MLS®
Average Price1,7
Sales & Average Price By Major Home Type1,7
Year-Over-Year Summary1,7
May 2021 0.25%
May 2021 2.45%
1 Year 2.79%
3 Year 3.49%
5 Year 4.79%
April 2021 3.4%
April 2021 9.5%
April 2021 2.2%
Q1 2021 5.7%
Real GDP Growth
Toronto Employment Growth
Toronto Unemployment Rate (SA)
Inflation (Yr./Yr. CPI Growth)
Bank of Canada Overnight Rate
Prime Rate
1
Market Watch, May 2021
Copyright®
2021 Toronto Regional Real Estate Board
May 2021
Mortgage Rates
2
3
1
5
5
2. Toronto Regional Real Estate Board
YEAR-TO-DATE, 2021
$0 to $99,999
$100,000 to $199,999
$200,000 to $299,999
$300,000 to $399,999
$400,000 to $499,999
$500,000 to $599,999
$600,000 to $699,999
$700,000 to $799,999
$800,000 to $899,999
$900,000 to $999,999
$1,000,000 to $1,249,999
$1,250,000 to $1,499,999
$1,500,000 to $1,749,999
$1,750,000 to $1,999,999
$2,000,000+
0 0 0 0 0 0 0 0 0 0
1 0 0 0 1 0 0 0 0 2
2 0 0 0 6 0 0 0 1 9
12 0 0 1 35 0 0 0 0 48
25 2 0 27 301 0 1 0 2 358
52 10 6 121 864 0 0 0 2 1,055
119 58 84 269 681 7 1 4 0 1,223
291 113 231 269 328 14 0 2 1 1,249
481 224 325 162 196 16 0 3 1 1,408
629 317 228 45 97 16 1 1 0 1,334
1,259 286 215 35 111 21 0 2 0 1,929
1,143 93 84 17 36 7 1 2 0 1,383
622 77 20 12 23 1 0 0 0 755
362 16 7 3 15 0 0 0 0 403
719 37 15 6 16 0 0 1 0 794
Detached Semi-Detached Att/Row/Twnhouse Condo Townhouse Condo Apt Link Co-Op Apt Det Condo Co-Ownership Apt Total
Name
$0 to $99,999
$100,000 to $199,999
$200,000 to $299,999
$300,000 to $399,999
$400,000 to $499,999
$500,000 to $599,999
$600,000 to $699,999
$700,000 to $799,999
$800,000 to $899,999
$900,000 to $999,999
$1,000,000 to $1,249,999
$1,250,000 to $1,499,999
$1,500,000 to $1,749,999
$1,750,000 to $1,999,999
$2,000,000+
0 0 0 0 4 0 0 0 0 4
1 0 0 0 24 0 1 0 0 26
11 0 0 2 47 0 8 0 1 69
32 0 4 15 276 0 12 1 12 352
91 6 4 182 2,303 0 8 0 9 2,603
292 44 31 610 4,830 3 6 3 7 5,826
651 248 369 1,225 3,756 23 11 13 3 6,299
1,394 442 1,031 1,282 1,686 49 1 6 1 5,892
2,307 1,109 1,507 702 1,005 77 4 7 2 6,720
3,036 1,439 1,101 223 559 68 4 8 0 6,438
6,241 1,262 1,041 213 478 118 1 5 0 9,359
5,466 432 339 72 193 36 4 4 0 6,546
3,002 269 100 37 92 2 1 1 0 3,504
1,661 109 29 15 54 1 2 1 0 1,872
3,265 134 50 18 96 0 0 1 0 3,564
Detached Semi-Detached Att/Row/Twnhouse Condo Townhouse Condo Apt Link Co-Op Apt Det Condo Co-Ownership Apt Total
Name
MAY 2021
SALES BY PRICE RANGE AND HOUSE TYPE 1,7
Total Sales
Share of Total Sales (%)
Average Price ($)
5,718 1,233 1,215 967 2,710 82 4 15 7 11,951
47.8% 10.3% 10.2% 8.1% 22.7% 0.7% 0.0% 0.1% 0.1% 100.0%
$1,415,698 $1,064,361 $949,983 $761,266 $682,280 $954,333 $889,975 $986,973 $546,571 $1,108,453
27,452 5,495 5,606 4,596 15,403 377 63 50 35 59,077
46.5% 9.3% 9.5% 7.8% 26.1% 0.6% 0.1% 0.1% 0.1% 100.0%
$1,391,920 $1,051,890 $944,553 $750,072 $661,725 $973,417 $646,818 $905,321 $474,354 $1,073,104
Total Sales
Share of Total Sales (%)
Average Price ($)
27. 2009 86,980 $395,234
2010 85,860 $431,262
2011 89,110 $464,989
2012 85,488 $497,073
2013 87,047 $522,951
2014 92,776 $566,611
2015 101,214 $622,116
2016 113,040 $729,821
2017 92,340 $822,496
2018 78,017 $787,800
2019 87,749 $819,057
Year Sales Average Price
Toronto Regional Real Estate Board
January 4,546 838,087
February 7,193 910,068
March 7,944 902,737
April 2,957 820,226
May 4,594 863,563
June 8,645 931,131
July 11,033 943,594
August 10,738 951,219
September 11,033 960,613
October 10,503 968,535
November 8,728 955,889
December 7,156 932,277
January 6,889 $966,108
February 10,941 $1,045,203
March 15,646 $1,097,299
April 13,650 $1,090,784
May 11,951 $1,108,453
June - -
July - -
August - -
September - -
October - -
November - -
December - -
Annual 95,070 $929,629
HISTORIC ANNUAL STATISTICS1,6,7
Year to Date 59,077 $1,073,104
NOTES
*For historic annual sales and average price data over a longer time frame go to:
http://www.torontorealestateboard.com/market_news/market_watch/historic_stats/
pdf/TREB_historic_statistics.pdf
Ajax
Aurora
Bradford West
Gwillimbury
Brampton
Brock
Burlington
C01
C02
C03
C04
C06
C07
C08
C10 C11
C12 C13
C14
C15
Caledon
Clarington
E01
E02
E03
E04
E06
E07
E08
E09
E10
E11
East Gwillimbury
Essa
Georgina
Halton Hills
Innisfil
King
Markham
Milton
Mississauga
New Tecumseth
Newmarket
Oakville
Oshawa
Pickering
Richmond
Hill
Scugog
Uxbridge
Vaughan
W02
W03
W04
W05
W06
W07
W08
W09
W10
Whitchurch-Stouffville
Adjala-Tosorontio
Orangeville
Whitby
Dufferin
Durham
Halton
Peel
Simcoe
Toronto
York
27
Market Watch, May 2021
Copyright® 2021 Toronto Regional Real Estate Board
1 - Sales, dollar volume, average sale prices and median sale prices are based on firm transactions entered into the TRREB
MLS® system between the first and last day of the month/period being reported.
2 - New listings entered into the TRREB MLS® system between the first and last day of the month/period being reported.
3 - Active listings at the end of the last day of the month/period being reported.
4 - Ratio of the average selling price to the average listing price for firm transactions entered into the TRREB MLS® system
between the first and last day of the month/period being reported.
5 - Average Listing Days on Market (Avg. LDOM) refers to the average number of days sold listings were on the market.
Average Property Days on Market (Avg. PDOM) refers to the average number of days a property was on the market before
selling irrespective of whether the property was listed more than once by the same combination of seller and brokerage during
the original listing contract period.
6 - Active listings at the end of the last day of the month/period being reported.
7 - Past monthly and year-to-date figures are revised on a monthly basis.
8 - SNLR = Sales-to-New Listings Ratio. Calculated using a 12-month moving average (sales/new listings).
9 - Mos. Inv. = Months of Inventory. Calculated using a 12-month moving average (active listings/sales).
2021 MONTHLY STATISTICS1,7
2020 MONTHLY STATISTICS1,7