SlideShare a Scribd company logo
1 of 10
Download to read offline
Background on CTIA’s Semi-Annual Wireless Industry Survey


        CTIA-The Wireless Association®’s Semi-annual wireless industry survey develops industry-wide information drawn from
operational member and non-member wireless service providers. It has been conducted since January 1985, originally as a cellular-
only survey instrument, and now including PCS, ESMR and AWS licensees. No break-out of results specific to spectrum bands or
licenses is performed.
       The information solicited from the service providers includes: direct employment, number of cell sites, total service revenues,
roaming revenues as a subset of total service revenues, the average local monthly bill, and the average length of call. The average
local monthly bill is developed on a weighted basis, to avoid skewing the figures. It is not an average of averages. No adjustments are
made to these figures.
        The CTIA survey also develops information on the number of reported wireless service subscribers for the responding systems,
and an estimated total subscriber figure (taking into account non-responding systems). Because the CTIA survey is a voluntary survey,
it cannot compel responses from wireless carriers. However, the survey has an excellent response rate. For the June 30, 2009,
installment of the semi-annual survey, CTIA received responses from companies serving 95.9 percent of wireless subscribers.
        Because not all systems do respond, CTIA develops an estimate of total subscribership. The estimated subscriber figure is
developed by determining the identity and character of non-responding markets (i.e., RSA/MSA or equivalent-market designation, age
of system, market population), and using a surrogate penetration rate applicable to similar, known systems to derive probable
subscribership. These numbers are then summed with the reported subscriber numbers to reach the total estimated subscriber figures.
No carrier-specific or market-specific information is maintained as a result of the survey. All such information is aggregated by an
independent accounting firm to a nationwide level. The underlying source material for the survey is then destroyed per confidentiality
agreements.
The following tables and charts reflect selected top-of-the-line data. Complete results of CTIA’s semi-annual survey are available for
purchase in the comprehensive report, CTIA’s Wireless Industry Indices: 1985 – 2008, including data on revenues, subscriber usage,
investment, digital subscribership, and other operational indicators and ratios. The report is available for a member price of $850 and a
non-member price of $1,075. Subsequent copies are available to members at $475 each and to non-members at $535 each. Annual
subscriptions are available at a member price of $1,445 and non-member price of $1,825. The report may be ordered by contacting
research@ctia.org or by ordering directly from CTIA’s Research e-Store at
http://www.ctia.org/store/producttyperesults.cfm?group_id=1. Order forms are also available on CTIA’s web site, at
http://files.ctia.org/pdf/Indices_Order_Form1.pdf.


                         Materials May not be reproduced or photocopied in any form without written permission from CTIA
                                                    © 2009 CTIA-The Wireless Association®
CTIA-THE WIRELESS ASSOCIATION®
        ANNUALIZED U.S. WIRELESS INDUSTRY SURVEY RESULTS - JUNE 1985 TO JUNE 2009
                       Twelve-Month          12-Month                                         Average Local
                       Total Service          Roamer                      Direct Service       Monthly Bill        Average Local Call
       Estimated Total   Revenues            Revenues                       Provider          (June Survey        Length (June Survey
Date     Subscribers     (in $000s)          (in $000s)      Cell Sites    Employees            Periods)               Periods)
1985       203,600        $354,316               N/a            599           1,697                N/a                    N/a
1986       500,000        $666,782               N/a           1,194          3,556                N/a                    N/a
1987       883,778        $941,981               N/a           1,732          5,656                N/a                    N/a
1988      1,608,697      $1,558,080              N/a           2,789          9,154              $95.00                   2.25
1989      2,691,793      $2,479,936           $210,699         3,577          13,719             $85.52                   2.35
1990      4,368,686      $4,060,494           $365,549         4,768          18,973             $83.94                   2.32
1991      6,380,053      $5,075,963           $565,989         6,685          25,545             $74.56                   2.20
1992      8,892,535      $6,688,302           $838,077         8,901          30,595             $68.51                   2.38
1993      13,067,318     $9,008,700          $1,124,493       11,551          36,501             $67.31                   2.38
1994      19,283,306    $12,591,947          $1,552,382       14,740          45,622             $58.65                   2.36
1995      28,154,414    $16,460,516          $2,173,003       19,844          60,689             $52.45                   2.27
1996      38,195,466    $21,525,861          $2,737,177       24,802          73,365             $48.84                   2.24
1997      48,705,553    $25,575,275          $2,858,432       38,650          97,039             $43.86                   2.25
1998      60,831,431    $29,637,742          $3,166,656       57,674         113,111             $39.88                   2.34
1999      76,284,753    $37,214,819          $3,837,994       74,157         141,929             $40.24                   2.40
2000      97,035,925    $45,295,550          $4,134,626       95,733         159,645             $45.15                   2.48
2001     118,397,734    $58,726,376          $3,698,683      114,059         186,317             $45.56                   2.62
2002     134,561,370    $71,117,599          $4,055,654      131,350         186,956             $47.42                   2.60
2003     148,065,824    $81,185,272          $3,874,488      147,719         187,169             $49.46                   2.63
2004     169,467,393    $95,515,593          $3,956,823      174,368         212,186             $49.49                   3.06
2005     194,479,364    $108,534,727         $4,136,492      178,025         225,162             $49.52                   3.04
2006     219,652,457    $118,299,682         $3,558,052      197,576         238,236             $49.30                   2.94
2007     243,428,202    $132,893,824         $3,611,049      210,360         257,401             $49.94                   3.13
2008     262,720,165    $143,710,400         $3,690,099      220,472         267,855             $48.54                   2.43
2009     276,610,580    $151,203,725         $3,546,748      245,912         261,453             $49.57                   2.03

                Materials May not be reproduced or photocopied in any form without written permission from CTIA
                                           © 2009 CTIA-The Wireless Association®
CTIA’S SEMI-ANNUAL WIRELESS INDUSTRY SURVEY RESULTS
                                                   JANUARY 1985 – JUNE 2009


                                          Roamer Service                Direct Service                           Avg. Local
           Estimated Total Six-Month        Revenues                      Provider           Average Local       Call Length Avg. Roam
 Date     Subscribers Revenues ($000)         ($000)         Cell Sites  Employees            Monthly Bill         (Min)     Call Length
 Jan-85      91,600      $178,085               N/A             346         1,404                N/A                 N/A         N/A
Jun-85      203,600      $176,231              N/A              599         1,697                N/A                 N/A         N/A
Dec-85      340,213      $306,197              N/A              913         2,727                N/A                 N/A         N/A
Jun-86      500,000      $360,585              N/A             1,194        3,556                N/A                 N/A         N/A
Dec-86      681,825      $462,467              N/A             1,531        4,334                N/A                 N/A         N/A
Jun-87      883,778      $479,514              N/A             1,732        5,656                N/A                 N/A         N/A
Dec-87     1,230,855     $672,005              N/A             2,305        7,147               $96.83               N/A         N/A
Jun-88     1,608,697     $886,075              N/A             2,789        9,154               $95.00               N/A         N/A
Dec-88     2,069,441    $1,073,473           $89,331           3,209       11,400               $98.02               N/A         N/A
Jun-89     2,691,793    $1,406,463           $121,368          3,577       13,719               $85.52               N/A         N/A
Dec-89     3,508,944    $1,934,132           $173,199          4,169       15,927               $89.30               N/A         N/A
Jun-90     4,368,686    $2,126,362           $192,350          4,768       18,973               $83.94               N/A         N/A
Dec-90     5,283,055    $2,422,458           $263,660          5,616       21,382               $80.90               N/A         N/A
Jun-91     6,380,053    $2,653,505           $302,329          6,685       25,545               $74.56               N/A         N/A
Dec-91     7,557,148    $3,055,017           $401,325          7,847       26,327               $72.74               N/A         N/A
Jun-92     8,892,535    $3,633,285           $436,725          8,901       30,595               $68.51               N/A         N/A
Dec-92    11,032,753    $4,189,441           $537,146         10,307       34,348               $68.68               N/A         N/A
Jun-93    13,067,318    $4,819,259           $587,347         11,551       36,501               $67.31               2.38        3.38
Dec-93    16,009,461    $6,075,916           $774,266         12,824       39,810               $61.49               2.41        3.26
Jun-94    19,283,306    $6,519,031           $778,116         14,740       45,622               $58.65               2.36        2.89
Dec-94    24,134,421    $7,710,891          $1,052,666        17,920       53,902               $56.21               2.24        2.85
Jun-95    28,154,414    $8,749,625          $1,120,337        19,844       60,689               $52.45               2.27        2.74
Dec-95    33,758,661    $10,330,614         $1,422,233        22,663       68,165               $51.00               2.15        2.79
Jun-96    38,195,466    $11,194,247         $1,314,943        24,802       73,365               $48.84               2.24        2.80


                      Materials May not be reproduced or photocopied in any form without written permission from CTIA
                                                 © 2009 CTIA-The Wireless Association®
CTIA’S SEMI-ANNUAL WIRELESS INDUSTRY SURVEY RESULTS

                          Total Six-        Roamer
                           Month            Service                   Direct Service                           Avg. Local
           Estimated      Revenues         Revenues                     Provider     Average Local             Call Length   Avg. Roam
  Date    Subscribers      ($000)            ($000)        Cell Sites  Employees      Monthly Bill               (Min)       Call Length
Dec-96    44,042,992     $12,440,724       $1,465,992        30,045       84,161        $47.70                     2.32          3.14
 Jun-97   48,705,553     $13,134,551       $1,392,440        38,650       97,039        $43.86                     2.25          2.95
Dec-97    55,312,293     $14,351,082       $1,581,765        51,600      109,387        $42.78                     2.31          2.94
 Jun-98   60,831,431     $15,286,660       $1,584,891        57,674      113,111        $39.88                     2.34          2.65
Dec-98    69,209,321     $17,846,515       $1,915,578        65,887      134,754        $39.43                     2.39          3.11
 Jun-99   76,284,753     $19,368,304       $1,922,416        74,157      141,929        $40.24                     2.40          2.96
Dec-99    86,047,003     $20,650,185       $2,163,001        81,698      155,817        $41.24                     2.38          3.11
 Jun-00   97,035,925     $24,645,365       $1,971,625        95,733      159,645        $45.15                     2.48          3.19
Dec-00    109,478,031    $27,820,655       $1,911,356       104,288      184,449        $45.27                     2.56          3.23
 Jun-01   118,397,734    $30,905,721       $1,727,058       114,059      186,317        $45.56                     2.62          3.01
Dec-01    128,374,512    $34,410,513       $2,205,768       127,540      203,580        $47.37                     2.74          2.94
 Jun-02   134,561,370    $36,707,086       $1,846,267       131,350      186,956        $47.42                     2.60          3.07
Dec-02    140,766,842    $39,801,101       $2,049,245       139,338      192,410        $48.40                     2.73          3.11
 Jun-03   148,065,824    $41,384,171       $1,825,243      147,719       187,169        $49.46                     2.63          3.15
Dec-03    158,721,981    $46,239,922       $1,941,024       162,986      205,629        $49.91                     3.07          3.45
 Jun-04   169,467,393    $49,275,671       $2,015,799       174,368      212,186        $49.49                     3.06          3.45
Dec-04    182,140,362    $52,845,539       $2,194,532       175,725      226,016        $50.64                     3.05          2.80
 Jun-05   194,479,364    $55,689,208       $1,941,960       178,025      225,162        $49.52                     3.04          2.66
Dec-05    207,896,198    $57,849,013       $1,844,371       183,689      233,067        $49.98                     3.00          3.36
 Jun-06   219,652,457    $60,450,669       $1,713,680       197,576      238,236        $49.30                     2.94          3.40
Dec-06    233,040,781    $65,006,156       $1,780,614       195,613      253,793        $50.56                     3.03          3.47
June-07   243,428,202    $67,887,668       $1,830,435       210,360      257,401        $49.94                     3.13          3.35
Dec-07    255,395,599    $70,981,636       $1,911,579       213,299      266,782        $49.79                     N/A           3.40
 Jun-08   262,720,165    $72,728,764       $1,778,519       220,472      267,855        $48.54                     2.43          3.16
Dec-08    270,333,881    $75,355,406       $1,960,755       242,130      268,528        $50.07                     2.27          3.27
 Jun-09   276,610,580    $75,848,319       $1,585,993       245,912      261,453        $49.57                     2.03          3.39
                        Materials May not be reproduced or photocopied in any form without written permission from CTIA
                                                   © 2009 CTIA-The Wireless Association®
276,610,580                                                                                                                                              Jun-09
                        262,720,165                                                                                                                                     Jun-08
                                        243,428,202                                                                                                                     Jun-07
                                             219,652,457                                                                                                                Jun-06
                                                               194,479,364                                                                                              Jun-05
                                                                    169,467,393                                                                                         Jun-04
                                                                               148,065,824                                                                              Jun-03
                                                                                                                                                                                                                                               Materials May not be reproduced or photocopied in any form without written permission from CTIA
                                                                                      134,561,370                                                                       Jun-02
                                                                                         118,397,734                                                                    Jun-01
                                                                                                                                                                                 Mid-Year 2009 Estimated Wireless Subscribers
                                                                                                           97,035,925                                                   Jun-00
                                                                                                               76,284,753                                               Jun-99

                                                                                                                                                                                        Up 13.9 Million from June 2008
                                                                                                                   60,831,431                                           Jun-98


                                                                                                                                                                                                                                                                          © 2009 CTIA-The Wireless Association®
Estimated Subscribers


                                                                                                                                  48,705,553                            Jun-97
                                                                                                                                    38,195,466                          Jun-96
                                                                                                                                      28,154,414                        Jun-95
                                                                                                                                        19,283,306                      Jun-94
                                                                                                                                          13,067,318                    Jun-93
                                                                                                                                               8,892,535                Jun-92
                                                                                                                                                   6,380,053            Jun-91
                                                                                                                                                        4,368,686       Jun-90
                                                                                                                                                        2,691,793       Jun-89
                                                                                                                                                        1,608,697       Jun-88
                                                                                                                                                          883,778       Jun-87
                                                                                                                                                          500,000       Jun-86
                                                                                                                                                          203,600       Jun-85
                          300,000,000


                                                 250,000,000


                                                                        200,000,000


                                                                                             150,000,000


                                                                                                                    100,000,000


                                                                                                                                                                    0
                                                                                                                                           50,000,000


                                                                                                                                                                                                                                Source: CTIA
Total Six-Month Service Revenues (000s)

              $90,000,000


                                                                                                                                                                                                                                                                                                                                                            $75,848,319
                                                                                                                                                                                                                                                                                                                                              $72,728,764
                                                                                                                                                                                                                                                                                                                                $67,887,668
              $80,000,000


                                                                                                                                                                                                                                                                                                                  $60,450,669
              $70,000,000


                                                                                                                                                                                                                                                                                                    $55,689,208
                                                                                                                                                                                                                                                                                      $49,275,671
              $60,000,000


                                                                                                                                                                                                                                                                        $41,384,171
  Thousands


              $50,000,000


                                                                                                                                                                                                                                                          $36,707,086
                                                                                                                                                                                                                                            $30,905,721
              $40,000,000


                                                                                                                                                                                                                              $24,645,365
                                                                                                                                                                                                                $19,368,304
              $30,000,000


                                                                                                                                                                                                  $15,286,660
                                                                                                                                                                                    $13,134,551
                                                                                                                                                                      $11,194,247
              $20,000,000
                                                                                                                                                         $8,749,625
                                                                                                                                            $6,519,031
                                                                                                                               $4,819,259
                                                                                                                  $3,633,285
                                                                                                     $2,653,505
                                                                                        $2,126,362
                                                                          $1,406,463
                                                               $886,075


              $10,000,000
                                                    $479,514
                                        $360,585
                            $176,231


                      $0
                            1985

                                        1986

                                                    1987

                                                               1988

                                                                          1989

                                                                                        1990

                                                                                                     1991

                                                                                                                  1992

                                                                                                                               1993

                                                                                                                                            1994

                                                                                                                                                         1995

                                                                                                                                                                      1996

                                                                                                                                                                                    1997

                                                                                                                                                                                                  1998

                                                                                                                                                                                                                1999

                                                                                                                                                                                                                              2000

                                                                                                                                                                                                                                            2001

                                                                                                                                                                                                                                                          2002

                                                                                                                                                                                                                                                                        2003

                                                                                                                                                                                                                                                                                      2004

                                                                                                                                                                                                                                                                                                    2005

                                                                                                                                                                                                                                                                                                                  2006

                                                                                                                                                                                                                                                                                                                                2007

                                                                                                                                                                                                                                                                                                                                              2008

                                                                                                                                                                                                                                                                                                                                                            2009
                                       Total Wireless Service Revenues Exceed $75.8 billion for First Six Months of 2009
                                       - Total Twelve-Month Revenues Ending June 2009 Reach More Than $151 Billion

Source: CTIA
                                                   Materials May not be reproduced or photocopied in any form without written permission from CTIA
                                                                              © 2009 CTIA-The Wireless Association®
Reported Wireless Minutes of Use Exceed 1.1 Trillion in First Half of 2009

             1,200


             1,000


              800
  Billions


              600


              400


              200


                0
                     Jun-91


                              Jun-92


                                       Jun-93


                                                Jun-94


                                                         Jun-95


                                                                  Jun-96


                                                                           Jun-97


                                                                                    Jun-98


                                                                                             Jun-99


                                                                                                      Jun-00


                                                                                                               Jun-01


                                                                                                                        Jun-02


                                                                                                                                 Jun-03


                                                                                                                                          Jun-04


                                                                                                                                                   Jun-05


                                                                                                                                                            Jun-06


                                                                                                                                                                     Jun-07


                                                                                                                                                                              Jun-08


                                                                                                                                                                                       Jun-09
                                                     Reported Wireless MOUs Grow 3% Year-to-Year
Source: CTIA
                                       Materials May not be reproduced or photocopied in any form without written permission from CTIA
                                                                  © 2009 CTIA-The Wireless Association®
57
                                                                                                         9.                                                     Jun-09
                                                                                                    $4
                                                                                                            54
                                                                                                          8.                                                    Jun-08
                                                                                                     $4
                                                                                                          94
                                                                                                        9.                                                      Jun-07
                                                                                                   $4
                                                                                                           30
                                                                                                         9.                                                     Jun-06
                                                                                                    $4
                                                                                                           52
                                                                                                         9.                                                     Jun-05
                                                                                                    $4
                                                                                                                                                                                                                                   Materials May not be reproduced or photocopied in any form without written permission from CTIA
                                                                                                           49
                                                                                                         9.                                                     Jun-04
                                                                                                                                                                         Average Local Monthly Bill Up 2% Year-to-Year

                                                                                                    $4
                                                                                                          46
                                                                                                        9.                                                      Jun-03
                                                                                                   $4
                                                                                                                42
                                                                                                              7.                                                Jun-02
                                                                                                         $4
                                                                                                                     56
                                                                                                                   5.                                           Jun-01
Average Local Monthly Bill


                                                                                                              $4


                                                                                                                                                                                                                                                              © 2009 CTIA-The Wireless Association®
                                                                                                                     15
                                                                                                                   5.                                           Jun-00
                                                                                                              $4
                                                                                                                              24
                                                                                                                            0.                                  Jun-99
                                                                                                                      $4
                                                                                                                                 88
                                                                                                                               9.                               Jun-98
                                                                                                                          $3
                                                                                                                       86
                                                                                                                     3.                                         Jun-97
                                                                                                                $4
                                                                                                            84
                                                                                                          8.                                                    Jun-96
                                                                                                    $4
                                                                                                     45
                                                                                                   2.                                                           Jun-95
                                                                                              $5
                                                                                         65
                                                                                       8.                                                                       Jun-94
                                                                                  $5
                                                                             31
                                                                           7.                                                                                   Jun-93
                                                                      $6
                                                                            51
                                                                          8.                                                                                    Jun-92
                                                                     $6
                                                                56
                                                              4.                                                                                                Jun-91
                                                         $7
                                                    94
                                                  3.                                                                                                            Jun-90
                                            $8
                                                  52
                                                5.                                                                                                              Jun-89
                                           $8
                                      00
                                    5.                                                                                                                          Jun-88
                              $9


                                                                                                                                                                                                                         Source: CTIA
                             $100


                                            $90


                                                         $80


                                                                            $70


                                                                                         $60


                                                                                                               $50


                                                                                                                                   $40


                                                                                                                                         $30


                                                                                                                                               $20


                                                                                                                                                     $10


                                                                                                                                                           $0
245,912                                                                                                                           Jun-09
                         220,472                                                                                                                Jun-08
                                 210,360                                                                                                        Jun-07
                                    197,576                                                                                                     Jun-06
                                              178,025                                                                                           Jun-05
                                                174,368                                                                                         Jun-04
                                                                                                                                                                                                                                   Materials May not be reproduced or photocopied in any form without written permission from CTIA
                                                          147,719                                                                               Jun-03
                                                                                                                                                         Reported Cell Sites in Service are Up 11.5% Year-to-Year


                                                                    131,350                                                                     Jun-02
                                                                                114,059                                                         Jun-01
                                                                                         95,733                                                 Jun-00
                                                                                                74,157                                          Jun-99


                                                                                                                                                                                                                                                              © 2009 CTIA-The Wireless Association®
                                                                                                        57,674                                  Jun-98
                                                                                                                  38,650                        Jun-97
Cell Sites


                                                                                                                     24,802                     Jun-96
                                                                                                                         19,844                 Jun-95
                                                                                                                             14,740             Jun-94
                                                                                                                             11,551             Jun-93
                                                                                                                               8,901            Jun-92
                                                                                                                                6,685           Jun-91
                                                                                                                                 4,768          Jun-90
                                                                                                                                  3,577         Jun-89
                                                                                                                                  2,789         Jun-88
                                                                                                                                   1,732        Jun-87
                                                                                                                                    1,194       Jun-86
                                                                                                                                         599    Jun-85
             275,000


                       250,000


                                    225,000


                                                200,000


                                                          175,000


                                                                      150,000


                                                                                    125,000


                                                                                              100,000


                                                                                                         75,000


                                                                                                                    50,000


                                                                                                                                25,000


                                                                                                                                            0


                                                                                                                                                                                                                    Source: CTIA
Direct Carrier Employees


      300,000


                                                                                                                                                                                                                                                          267,855

                                                                                                                                                                                                                                                                    261,453
                                                                                                                                                                                                                                                257,401
      270,000


                                                                                                                                                                                                                                      238,236
                                                                                                                                                                                                                            225,162
      240,000


                                                                                                                                                                                                                  212,186
                                                                                                                                                                                                        187,169
                                                                                                                                                                                            186,956
                                                                                                                                                                         186,317
      210,000


                                                                                                                                                               159,645
      180,000


                                                                                                                                                     141,929
      150,000


                                                                                                                                           113,111
      120,000


                                                                                                                                  97,039
                                                                                                                         73,365
       90,000


                                                                                                                60,689
                                                                                                       45,622

       60,000
                                                                                              36,501
                                                                                     30,595
                                                                            25,545
                                                                   18,973
                                                          13,719


       30,000
                                                 9,154
                                     5,656
                            3,556
                   1,697


               0
                   Jun-85

                            Jun-86

                                     Jun-87

                                                 Jun-88

                                                          Jun-89

                                                                   Jun-90

                                                                            Jun-91

                                                                                     Jun-92

                                                                                              Jun-93

                                                                                                       Jun-94

                                                                                                                Jun-95

                                                                                                                         Jun-96

                                                                                                                                  Jun-97

                                                                                                                                           Jun-98

                                                                                                                                                     Jun-99

                                                                                                                                                               Jun-00

                                                                                                                                                                                   Jun-01

                                                                                                                                                                                            Jun-02

                                                                                                                                                                                                      Jun-03

                                                                                                                                                                                                                  Jun-04

                                                                                                                                                                                                                            Jun-05

                                                                                                                                                                                                                                      Jun-06

                                                                                                                                                                                                                                                Jun-07

                                                                                                                                                                                                                                                          Jun-08

                                                                                                                                                                                                                                                                    Jun-09
                                               Reported Direct Wireless Carrier Employment Falls 2.4% Year-to-Year
                                                     Direct Employment More Than 261,000 at Mid-Year 2009
Source: CTIA

                                              Materials May not be reproduced or photocopied in any form without written permission from CTIA
                                                                         © 2009 CTIA-The Wireless Association®

More Related Content

What's hot

walt disney Quarter2007 4th
walt disney  Quarter2007 4thwalt disney  Quarter2007 4th
walt disney Quarter2007 4thfinance7
 
winn-dixie stores 1999_Annual_Report
winn-dixie stores  1999_Annual_Reportwinn-dixie stores  1999_Annual_Report
winn-dixie stores 1999_Annual_Reportfinance32
 
walt disney Quarter 2007 3rd
walt disney  Quarter 2007 3rdwalt disney  Quarter 2007 3rd
walt disney Quarter 2007 3rdfinance7
 
3q07_Supplement
3q07_Supplement3q07_Supplement
3q07_Supplementfinance27
 
clearchannel 28
clearchannel 28clearchannel 28
clearchannel 28finance31
 
clearchannel 30
clearchannel 30clearchannel 30
clearchannel 30finance31
 
alltel 4Q 04_Highlights
alltel  4Q 04_Highlightsalltel  4Q 04_Highlights
alltel 4Q 04_Highlightsfinance27
 
Magnolia TX Home Sales Report - February 2013
Magnolia TX Home Sales Report - February 2013Magnolia TX Home Sales Report - February 2013
Magnolia TX Home Sales Report - February 2013Ken Brand
 

What's hot (8)

walt disney Quarter2007 4th
walt disney  Quarter2007 4thwalt disney  Quarter2007 4th
walt disney Quarter2007 4th
 
winn-dixie stores 1999_Annual_Report
winn-dixie stores  1999_Annual_Reportwinn-dixie stores  1999_Annual_Report
winn-dixie stores 1999_Annual_Report
 
walt disney Quarter 2007 3rd
walt disney  Quarter 2007 3rdwalt disney  Quarter 2007 3rd
walt disney Quarter 2007 3rd
 
3q07_Supplement
3q07_Supplement3q07_Supplement
3q07_Supplement
 
clearchannel 28
clearchannel 28clearchannel 28
clearchannel 28
 
clearchannel 30
clearchannel 30clearchannel 30
clearchannel 30
 
alltel 4Q 04_Highlights
alltel  4Q 04_Highlightsalltel  4Q 04_Highlights
alltel 4Q 04_Highlights
 
Magnolia TX Home Sales Report - February 2013
Magnolia TX Home Sales Report - February 2013Magnolia TX Home Sales Report - February 2013
Magnolia TX Home Sales Report - February 2013
 

Viewers also liked

Cocreationbeyondthehypeglobalsurveyresults 110123110530-phpapp01
Cocreationbeyondthehypeglobalsurveyresults 110123110530-phpapp01Cocreationbeyondthehypeglobalsurveyresults 110123110530-phpapp01
Cocreationbeyondthehypeglobalsurveyresults 110123110530-phpapp01Marketingfacts
 
Socialmediamonitor Socialembassy
Socialmediamonitor SocialembassySocialmediamonitor Socialembassy
Socialmediamonitor SocialembassyMarketingfacts
 
Programma%20 te dx%20amsterdam%20live%20sk
Programma%20 te dx%20amsterdam%20live%20skProgramma%20 te dx%20amsterdam%20live%20sk
Programma%20 te dx%20amsterdam%20live%20skMarketingfacts
 
#online tuesday The Floor is Yours: Steven van belleghem
#online tuesday The Floor is Yours: Steven van belleghem#online tuesday The Floor is Yours: Steven van belleghem
#online tuesday The Floor is Yours: Steven van belleghemMarketingfacts
 
Presentatie Mg Van Den Broek Hv A 13 03 2008 Weblogs Als Comunicatietool
Presentatie Mg Van Den Broek Hv A 13 03 2008 Weblogs Als ComunicatietoolPresentatie Mg Van Den Broek Hv A 13 03 2008 Weblogs Als Comunicatietool
Presentatie Mg Van Den Broek Hv A 13 03 2008 Weblogs Als ComunicatietoolMarketingfacts
 
Facebook advertising-performance
Facebook advertising-performanceFacebook advertising-performance
Facebook advertising-performanceMarketingfacts
 
Abn amro VOS 2011 media
Abn amro VOS 2011 mediaAbn amro VOS 2011 media
Abn amro VOS 2011 mediaMarketingfacts
 
Webmarketing Checklist
Webmarketing ChecklistWebmarketing Checklist
Webmarketing ChecklistMarketingfacts
 
Stick to the facts the impact of online reviews on consumer choice
Stick to the facts the impact of online reviews on consumer choiceStick to the facts the impact of online reviews on consumer choice
Stick to the facts the impact of online reviews on consumer choiceMarketingfacts
 
Social break up report 8 exact target cotweet
Social break up report 8 exact target cotweetSocial break up report 8 exact target cotweet
Social break up report 8 exact target cotweetMarketingfacts
 
Bango Blackberry Whitepaper
Bango Blackberry WhitepaperBango Blackberry Whitepaper
Bango Blackberry WhitepaperMarketingfacts
 
Krem Whitepaper Socialtrends 2010
Krem Whitepaper Socialtrends 2010Krem Whitepaper Socialtrends 2010
Krem Whitepaper Socialtrends 2010Marketingfacts
 

Viewers also liked (14)

Cocreationbeyondthehypeglobalsurveyresults 110123110530-phpapp01
Cocreationbeyondthehypeglobalsurveyresults 110123110530-phpapp01Cocreationbeyondthehypeglobalsurveyresults 110123110530-phpapp01
Cocreationbeyondthehypeglobalsurveyresults 110123110530-phpapp01
 
Socialmediamonitor Socialembassy
Socialmediamonitor SocialembassySocialmediamonitor Socialembassy
Socialmediamonitor Socialembassy
 
Programma%20 te dx%20amsterdam%20live%20sk
Programma%20 te dx%20amsterdam%20live%20skProgramma%20 te dx%20amsterdam%20live%20sk
Programma%20 te dx%20amsterdam%20live%20sk
 
Dm plein
Dm pleinDm plein
Dm plein
 
#online tuesday The Floor is Yours: Steven van belleghem
#online tuesday The Floor is Yours: Steven van belleghem#online tuesday The Floor is Yours: Steven van belleghem
#online tuesday The Floor is Yours: Steven van belleghem
 
Presentatie Mg Van Den Broek Hv A 13 03 2008 Weblogs Als Comunicatietool
Presentatie Mg Van Den Broek Hv A 13 03 2008 Weblogs Als ComunicatietoolPresentatie Mg Van Den Broek Hv A 13 03 2008 Weblogs Als Comunicatietool
Presentatie Mg Van Den Broek Hv A 13 03 2008 Weblogs Als Comunicatietool
 
Facebook advertising-performance
Facebook advertising-performanceFacebook advertising-performance
Facebook advertising-performance
 
Abn amro VOS 2011 media
Abn amro VOS 2011 mediaAbn amro VOS 2011 media
Abn amro VOS 2011 media
 
Webmarketing Checklist
Webmarketing ChecklistWebmarketing Checklist
Webmarketing Checklist
 
Stick to the facts the impact of online reviews on consumer choice
Stick to the facts the impact of online reviews on consumer choiceStick to the facts the impact of online reviews on consumer choice
Stick to the facts the impact of online reviews on consumer choice
 
Social break up report 8 exact target cotweet
Social break up report 8 exact target cotweetSocial break up report 8 exact target cotweet
Social break up report 8 exact target cotweet
 
Bango Blackberry Whitepaper
Bango Blackberry WhitepaperBango Blackberry Whitepaper
Bango Blackberry Whitepaper
 
Oft1231
Oft1231Oft1231
Oft1231
 
Krem Whitepaper Socialtrends 2010
Krem Whitepaper Socialtrends 2010Krem Whitepaper Socialtrends 2010
Krem Whitepaper Socialtrends 2010
 

Similar to Ctia Survey Midyear 2009 Graphics

September 2020 - Market Report - Toronto & GTA Housing Sales
September 2020 - Market Report - Toronto & GTA Housing SalesSeptember 2020 - Market Report - Toronto & GTA Housing Sales
September 2020 - Market Report - Toronto & GTA Housing SalesMichelle Makos
 
November 2021 Market Watch
November 2021 Market WatchNovember 2021 Market Watch
November 2021 Market WatchMichelle Makos
 
Toronto real estate market watch october 2010
Toronto real estate market watch   october 2010Toronto real estate market watch   october 2010
Toronto real estate market watch october 2010Vahab Jalali
 
Toronto Real Estate Statistics October 2010
Toronto Real Estate Statistics October 2010Toronto Real Estate Statistics October 2010
Toronto Real Estate Statistics October 2010John Helfrich
 
PFP RMA_RMC Presentation Kevin
PFP RMA_RMC Presentation KevinPFP RMA_RMC Presentation Kevin
PFP RMA_RMC Presentation KevinKevin McCutcheon
 
Market Report for October 2017 - Residential Resale
Market Report for October 2017 - Residential ResaleMarket Report for October 2017 - Residential Resale
Market Report for October 2017 - Residential ResaleMichelle Makos
 
walt disney Quarter 2006 4th
walt disney  Quarter 2006 4thwalt disney  Quarter 2006 4th
walt disney Quarter 2006 4thfinance7
 
TREB MARKET WATCH NOVEMBER 2018 REPORT
TREB MARKET WATCH NOVEMBER 2018 REPORTTREB MARKET WATCH NOVEMBER 2018 REPORT
TREB MARKET WATCH NOVEMBER 2018 REPORTShawn Venasse
 
July 2021 - Market Report
July 2021 - Market Report July 2021 - Market Report
July 2021 - Market Report Michelle Makos
 
Financial Forecasting
Financial ForecastingFinancial Forecasting
Financial ForecastingJamariHodges1
 
Market watch jul 2019 frank yu oakville
Market watch jul 2019 frank yu oakvilleMarket watch jul 2019 frank yu oakville
Market watch jul 2019 frank yu oakvilleFrank Yu
 
Market watch jul 2019 frank yu oakville
Market watch jul 2019 frank yu oakvilleMarket watch jul 2019 frank yu oakville
Market watch jul 2019 frank yu oakvilleFrank Yu
 
TORONTO REAL ESTATE BOARD'S -- MARKET WATCH - JULY 2019
TORONTO REAL ESTATE BOARD'S -- MARKET WATCH - JULY 2019TORONTO REAL ESTATE BOARD'S -- MARKET WATCH - JULY 2019
TORONTO REAL ESTATE BOARD'S -- MARKET WATCH - JULY 2019Shawn Venasse
 
Market Report for August 2017 - Residential Resale
Market Report for August 2017 - Residential ResaleMarket Report for August 2017 - Residential Resale
Market Report for August 2017 - Residential ResaleMichelle Makos
 
Market Watch APRIL 2015
Market Watch APRIL 2015Market Watch APRIL 2015
Market Watch APRIL 2015Chaba Tamasi
 
June Market Report 2014
June Market Report 2014June Market Report 2014
June Market Report 2014Michelle Makos
 
Acme Company Financial Model
Acme Company Financial ModelAcme Company Financial Model
Acme Company Financial ModelBruceSlides555
 
Digital everywhere 2% growth with debt
Digital everywhere 2% growth with debtDigital everywhere 2% growth with debt
Digital everywhere 2% growth with debtBea Morales
 

Similar to Ctia Survey Midyear 2009 Graphics (20)

May Market Watch 2021
May Market Watch 2021May Market Watch 2021
May Market Watch 2021
 
September 2020 - Market Report - Toronto & GTA Housing Sales
September 2020 - Market Report - Toronto & GTA Housing SalesSeptember 2020 - Market Report - Toronto & GTA Housing Sales
September 2020 - Market Report - Toronto & GTA Housing Sales
 
November 2021 Market Watch
November 2021 Market WatchNovember 2021 Market Watch
November 2021 Market Watch
 
Toronto real estate market watch october 2010
Toronto real estate market watch   october 2010Toronto real estate market watch   october 2010
Toronto real estate market watch october 2010
 
Toronto Real Estate Statistics October 2010
Toronto Real Estate Statistics October 2010Toronto Real Estate Statistics October 2010
Toronto Real Estate Statistics October 2010
 
PFP RMA_RMC Presentation Kevin
PFP RMA_RMC Presentation KevinPFP RMA_RMC Presentation Kevin
PFP RMA_RMC Presentation Kevin
 
Market Report for October 2017 - Residential Resale
Market Report for October 2017 - Residential ResaleMarket Report for October 2017 - Residential Resale
Market Report for October 2017 - Residential Resale
 
walt disney Quarter 2006 4th
walt disney  Quarter 2006 4thwalt disney  Quarter 2006 4th
walt disney Quarter 2006 4th
 
TREB MARKET WATCH NOVEMBER 2018 REPORT
TREB MARKET WATCH NOVEMBER 2018 REPORTTREB MARKET WATCH NOVEMBER 2018 REPORT
TREB MARKET WATCH NOVEMBER 2018 REPORT
 
July 2021 - Market Report
July 2021 - Market Report July 2021 - Market Report
July 2021 - Market Report
 
Financial Forecasting
Financial ForecastingFinancial Forecasting
Financial Forecasting
 
Market watch jul 2019 frank yu oakville
Market watch jul 2019 frank yu oakvilleMarket watch jul 2019 frank yu oakville
Market watch jul 2019 frank yu oakville
 
Market watch jul 2019 frank yu oakville
Market watch jul 2019 frank yu oakvilleMarket watch jul 2019 frank yu oakville
Market watch jul 2019 frank yu oakville
 
TORONTO REAL ESTATE BOARD'S -- MARKET WATCH - JULY 2019
TORONTO REAL ESTATE BOARD'S -- MARKET WATCH - JULY 2019TORONTO REAL ESTATE BOARD'S -- MARKET WATCH - JULY 2019
TORONTO REAL ESTATE BOARD'S -- MARKET WATCH - JULY 2019
 
Teacher Concessions
Teacher ConcessionsTeacher Concessions
Teacher Concessions
 
Market Report for August 2017 - Residential Resale
Market Report for August 2017 - Residential ResaleMarket Report for August 2017 - Residential Resale
Market Report for August 2017 - Residential Resale
 
Market Watch APRIL 2015
Market Watch APRIL 2015Market Watch APRIL 2015
Market Watch APRIL 2015
 
June Market Report 2014
June Market Report 2014June Market Report 2014
June Market Report 2014
 
Acme Company Financial Model
Acme Company Financial ModelAcme Company Financial Model
Acme Company Financial Model
 
Digital everywhere 2% growth with debt
Digital everywhere 2% growth with debtDigital everywhere 2% growth with debt
Digital everywhere 2% growth with debt
 

More from Marketingfacts

Brandz 100 Milward Brown 2011
Brandz 100 Milward Brown 2011Brandz 100 Milward Brown 2011
Brandz 100 Milward Brown 2011Marketingfacts
 
Practical Guide: An overview of behaviour change models and their uses
Practical Guide: An overview of behaviour change models and their usesPractical Guide: An overview of behaviour change models and their uses
Practical Guide: An overview of behaviour change models and their usesMarketingfacts
 
Behaviour change reference_report_tcm6-9697
Behaviour change reference_report_tcm6-9697Behaviour change reference_report_tcm6-9697
Behaviour change reference_report_tcm6-9697Marketingfacts
 
Oracle atg-mobile-wp-345770 mobile trends
Oracle atg-mobile-wp-345770 mobile trendsOracle atg-mobile-wp-345770 mobile trends
Oracle atg-mobile-wp-345770 mobile trendsMarketingfacts
 
Social Media Examiner: Social mediamarketingreport2011
Social Media Examiner: Social mediamarketingreport2011Social Media Examiner: Social mediamarketingreport2011
Social Media Examiner: Social mediamarketingreport2011Marketingfacts
 
Juryrapporten spin awards 2010 2011
Juryrapporten spin awards 2010 2011Juryrapporten spin awards 2010 2011
Juryrapporten spin awards 2010 2011Marketingfacts
 
20110322 hwh-context-is-king
20110322 hwh-context-is-king20110322 hwh-context-is-king
20110322 hwh-context-is-kingMarketingfacts
 
Twa2011 persbericht awards
Twa2011 persbericht awardsTwa2011 persbericht awards
Twa2011 persbericht awardsMarketingfacts
 
Worldcom media survey dec10 final
Worldcom media survey dec10 finalWorldcom media survey dec10 final
Worldcom media survey dec10 finalMarketingfacts
 
Tn snipo spot_onvision_b2b-barometer
Tn snipo spot_onvision_b2b-barometerTn snipo spot_onvision_b2b-barometer
Tn snipo spot_onvision_b2b-barometerMarketingfacts
 
Us mobile search e frontier
Us mobile search e frontierUs mobile search e frontier
Us mobile search e frontierMarketingfacts
 
Indenty zoekmachine marketing trends 2011
Indenty zoekmachine marketing trends 2011Indenty zoekmachine marketing trends 2011
Indenty zoekmachine marketing trends 2011Marketingfacts
 
Presentatie netsociety daisycon_def 08 maart 2011
Presentatie netsociety daisycon_def 08 maart 2011Presentatie netsociety daisycon_def 08 maart 2011
Presentatie netsociety daisycon_def 08 maart 2011Marketingfacts
 
Presentatie netsociety daisycon
Presentatie netsociety daisyconPresentatie netsociety daisycon
Presentatie netsociety daisyconMarketingfacts
 
Presentatie yonego daisycon
Presentatie yonego daisyconPresentatie yonego daisycon
Presentatie yonego daisyconMarketingfacts
 
Presentatie webcare alex van leeuwen buzz capture 8 maart
Presentatie webcare alex van leeuwen buzz capture 8 maartPresentatie webcare alex van leeuwen buzz capture 8 maart
Presentatie webcare alex van leeuwen buzz capture 8 maartMarketingfacts
 
Introductie en stellingen webcare 8 maart 2011
Introductie en stellingen webcare 8 maart 2011Introductie en stellingen webcare 8 maart 2011
Introductie en stellingen webcare 8 maart 2011Marketingfacts
 
Presentatie webcare robert lommers 8 maart
Presentatie webcare robert lommers 8 maartPresentatie webcare robert lommers 8 maart
Presentatie webcare robert lommers 8 maartMarketingfacts
 
Presentatie webcare tjalling smit klm 8 maart definitief
Presentatie webcare tjalling smit klm 8 maart definitiefPresentatie webcare tjalling smit klm 8 maart definitief
Presentatie webcare tjalling smit klm 8 maart definitiefMarketingfacts
 

More from Marketingfacts (20)

Brandz 100 Milward Brown 2011
Brandz 100 Milward Brown 2011Brandz 100 Milward Brown 2011
Brandz 100 Milward Brown 2011
 
Practical Guide: An overview of behaviour change models and their uses
Practical Guide: An overview of behaviour change models and their usesPractical Guide: An overview of behaviour change models and their uses
Practical Guide: An overview of behaviour change models and their uses
 
Behaviour change reference_report_tcm6-9697
Behaviour change reference_report_tcm6-9697Behaviour change reference_report_tcm6-9697
Behaviour change reference_report_tcm6-9697
 
Oracle atg-mobile-wp-345770 mobile trends
Oracle atg-mobile-wp-345770 mobile trendsOracle atg-mobile-wp-345770 mobile trends
Oracle atg-mobile-wp-345770 mobile trends
 
Social Media Examiner: Social mediamarketingreport2011
Social Media Examiner: Social mediamarketingreport2011Social Media Examiner: Social mediamarketingreport2011
Social Media Examiner: Social mediamarketingreport2011
 
Juryrapporten spin awards 2010 2011
Juryrapporten spin awards 2010 2011Juryrapporten spin awards 2010 2011
Juryrapporten spin awards 2010 2011
 
Gomez webspeedsurvey
Gomez webspeedsurveyGomez webspeedsurvey
Gomez webspeedsurvey
 
20110322 hwh-context-is-king
20110322 hwh-context-is-king20110322 hwh-context-is-king
20110322 hwh-context-is-king
 
Twa2011 persbericht awards
Twa2011 persbericht awardsTwa2011 persbericht awards
Twa2011 persbericht awards
 
Worldcom media survey dec10 final
Worldcom media survey dec10 finalWorldcom media survey dec10 final
Worldcom media survey dec10 final
 
Tn snipo spot_onvision_b2b-barometer
Tn snipo spot_onvision_b2b-barometerTn snipo spot_onvision_b2b-barometer
Tn snipo spot_onvision_b2b-barometer
 
Us mobile search e frontier
Us mobile search e frontierUs mobile search e frontier
Us mobile search e frontier
 
Indenty zoekmachine marketing trends 2011
Indenty zoekmachine marketing trends 2011Indenty zoekmachine marketing trends 2011
Indenty zoekmachine marketing trends 2011
 
Presentatie netsociety daisycon_def 08 maart 2011
Presentatie netsociety daisycon_def 08 maart 2011Presentatie netsociety daisycon_def 08 maart 2011
Presentatie netsociety daisycon_def 08 maart 2011
 
Presentatie netsociety daisycon
Presentatie netsociety daisyconPresentatie netsociety daisycon
Presentatie netsociety daisycon
 
Presentatie yonego daisycon
Presentatie yonego daisyconPresentatie yonego daisycon
Presentatie yonego daisycon
 
Presentatie webcare alex van leeuwen buzz capture 8 maart
Presentatie webcare alex van leeuwen buzz capture 8 maartPresentatie webcare alex van leeuwen buzz capture 8 maart
Presentatie webcare alex van leeuwen buzz capture 8 maart
 
Introductie en stellingen webcare 8 maart 2011
Introductie en stellingen webcare 8 maart 2011Introductie en stellingen webcare 8 maart 2011
Introductie en stellingen webcare 8 maart 2011
 
Presentatie webcare robert lommers 8 maart
Presentatie webcare robert lommers 8 maartPresentatie webcare robert lommers 8 maart
Presentatie webcare robert lommers 8 maart
 
Presentatie webcare tjalling smit klm 8 maart definitief
Presentatie webcare tjalling smit klm 8 maart definitiefPresentatie webcare tjalling smit klm 8 maart definitief
Presentatie webcare tjalling smit klm 8 maart definitief
 

Recently uploaded

Call Girls In Sikandarpur Gurgaon ❤️8860477959_Russian 100% Genuine Escorts I...
Call Girls In Sikandarpur Gurgaon ❤️8860477959_Russian 100% Genuine Escorts I...Call Girls In Sikandarpur Gurgaon ❤️8860477959_Russian 100% Genuine Escorts I...
Call Girls In Sikandarpur Gurgaon ❤️8860477959_Russian 100% Genuine Escorts I...lizamodels9
 
Call Girls in DELHI Cantt, ( Call Me )-8377877756-Female Escort- In Delhi / Ncr
Call Girls in DELHI Cantt, ( Call Me )-8377877756-Female Escort- In Delhi / NcrCall Girls in DELHI Cantt, ( Call Me )-8377877756-Female Escort- In Delhi / Ncr
Call Girls in DELHI Cantt, ( Call Me )-8377877756-Female Escort- In Delhi / Ncrdollysharma2066
 
RE Capital's Visionary Leadership under Newman Leech
RE Capital's Visionary Leadership under Newman LeechRE Capital's Visionary Leadership under Newman Leech
RE Capital's Visionary Leadership under Newman LeechNewman George Leech
 
Lowrate Call Girls In Sector 18 Noida ❤️8860477959 Escorts 100% Genuine Servi...
Lowrate Call Girls In Sector 18 Noida ❤️8860477959 Escorts 100% Genuine Servi...Lowrate Call Girls In Sector 18 Noida ❤️8860477959 Escorts 100% Genuine Servi...
Lowrate Call Girls In Sector 18 Noida ❤️8860477959 Escorts 100% Genuine Servi...lizamodels9
 
Call Girls In ⇛⇛Chhatarpur⇚⇚. Brings Offer Delhi Contact Us 8377877756
Call Girls In ⇛⇛Chhatarpur⇚⇚. Brings Offer Delhi Contact Us 8377877756Call Girls In ⇛⇛Chhatarpur⇚⇚. Brings Offer Delhi Contact Us 8377877756
Call Girls In ⇛⇛Chhatarpur⇚⇚. Brings Offer Delhi Contact Us 8377877756dollysharma2066
 
Progress Report - Oracle Database Analyst Summit
Progress  Report - Oracle Database Analyst SummitProgress  Report - Oracle Database Analyst Summit
Progress Report - Oracle Database Analyst SummitHolger Mueller
 
Islamabad Escorts | Call 03274100048 | Escort Service in Islamabad
Islamabad Escorts | Call 03274100048 | Escort Service in IslamabadIslamabad Escorts | Call 03274100048 | Escort Service in Islamabad
Islamabad Escorts | Call 03274100048 | Escort Service in IslamabadAyesha Khan
 
Catalogue ONG NUOC PPR DE NHAT .pdf
Catalogue ONG NUOC PPR DE NHAT      .pdfCatalogue ONG NUOC PPR DE NHAT      .pdf
Catalogue ONG NUOC PPR DE NHAT .pdfOrient Homes
 
The CMO Survey - Highlights and Insights Report - Spring 2024
The CMO Survey - Highlights and Insights Report - Spring 2024The CMO Survey - Highlights and Insights Report - Spring 2024
The CMO Survey - Highlights and Insights Report - Spring 2024christinemoorman
 
Call Girls In Connaught Place Delhi ❤️88604**77959_Russian 100% Genuine Escor...
Call Girls In Connaught Place Delhi ❤️88604**77959_Russian 100% Genuine Escor...Call Girls In Connaught Place Delhi ❤️88604**77959_Russian 100% Genuine Escor...
Call Girls In Connaught Place Delhi ❤️88604**77959_Russian 100% Genuine Escor...lizamodels9
 
Keppel Ltd. 1Q 2024 Business Update Presentation Slides
Keppel Ltd. 1Q 2024 Business Update  Presentation SlidesKeppel Ltd. 1Q 2024 Business Update  Presentation Slides
Keppel Ltd. 1Q 2024 Business Update Presentation SlidesKeppelCorporation
 
Investment analysis and portfolio management
Investment analysis and portfolio managementInvestment analysis and portfolio management
Investment analysis and portfolio managementJunaidKhan750825
 
Intro to BCG's Carbon Emissions Benchmark_vF.pdf
Intro to BCG's Carbon Emissions Benchmark_vF.pdfIntro to BCG's Carbon Emissions Benchmark_vF.pdf
Intro to BCG's Carbon Emissions Benchmark_vF.pdfpollardmorgan
 
Tech Startup Growth Hacking 101 - Basics on Growth Marketing
Tech Startup Growth Hacking 101  - Basics on Growth MarketingTech Startup Growth Hacking 101  - Basics on Growth Marketing
Tech Startup Growth Hacking 101 - Basics on Growth MarketingShawn Pang
 
Marketing Management Business Plan_My Sweet Creations
Marketing Management Business Plan_My Sweet CreationsMarketing Management Business Plan_My Sweet Creations
Marketing Management Business Plan_My Sweet Creationsnakalysalcedo61
 
Call Girls In Kishangarh Delhi ❤️8860477959 Good Looking Escorts In 24/7 Delh...
Call Girls In Kishangarh Delhi ❤️8860477959 Good Looking Escorts In 24/7 Delh...Call Girls In Kishangarh Delhi ❤️8860477959 Good Looking Escorts In 24/7 Delh...
Call Girls In Kishangarh Delhi ❤️8860477959 Good Looking Escorts In 24/7 Delh...lizamodels9
 
Pitch Deck Teardown: NOQX's $200k Pre-seed deck
Pitch Deck Teardown: NOQX's $200k Pre-seed deckPitch Deck Teardown: NOQX's $200k Pre-seed deck
Pitch Deck Teardown: NOQX's $200k Pre-seed deckHajeJanKamps
 
VIP Call Girl Jamshedpur Aashi 8250192130 Independent Escort Service Jamshedpur
VIP Call Girl Jamshedpur Aashi 8250192130 Independent Escort Service JamshedpurVIP Call Girl Jamshedpur Aashi 8250192130 Independent Escort Service Jamshedpur
VIP Call Girl Jamshedpur Aashi 8250192130 Independent Escort Service JamshedpurSuhani Kapoor
 
(8264348440) 🔝 Call Girls In Mahipalpur 🔝 Delhi NCR
(8264348440) 🔝 Call Girls In Mahipalpur 🔝 Delhi NCR(8264348440) 🔝 Call Girls In Mahipalpur 🔝 Delhi NCR
(8264348440) 🔝 Call Girls In Mahipalpur 🔝 Delhi NCRsoniya singh
 

Recently uploaded (20)

Call Girls In Sikandarpur Gurgaon ❤️8860477959_Russian 100% Genuine Escorts I...
Call Girls In Sikandarpur Gurgaon ❤️8860477959_Russian 100% Genuine Escorts I...Call Girls In Sikandarpur Gurgaon ❤️8860477959_Russian 100% Genuine Escorts I...
Call Girls In Sikandarpur Gurgaon ❤️8860477959_Russian 100% Genuine Escorts I...
 
Call Girls in DELHI Cantt, ( Call Me )-8377877756-Female Escort- In Delhi / Ncr
Call Girls in DELHI Cantt, ( Call Me )-8377877756-Female Escort- In Delhi / NcrCall Girls in DELHI Cantt, ( Call Me )-8377877756-Female Escort- In Delhi / Ncr
Call Girls in DELHI Cantt, ( Call Me )-8377877756-Female Escort- In Delhi / Ncr
 
RE Capital's Visionary Leadership under Newman Leech
RE Capital's Visionary Leadership under Newman LeechRE Capital's Visionary Leadership under Newman Leech
RE Capital's Visionary Leadership under Newman Leech
 
Lowrate Call Girls In Sector 18 Noida ❤️8860477959 Escorts 100% Genuine Servi...
Lowrate Call Girls In Sector 18 Noida ❤️8860477959 Escorts 100% Genuine Servi...Lowrate Call Girls In Sector 18 Noida ❤️8860477959 Escorts 100% Genuine Servi...
Lowrate Call Girls In Sector 18 Noida ❤️8860477959 Escorts 100% Genuine Servi...
 
KestrelPro Flyer Japan IT Week 2024 (English)
KestrelPro Flyer Japan IT Week 2024 (English)KestrelPro Flyer Japan IT Week 2024 (English)
KestrelPro Flyer Japan IT Week 2024 (English)
 
Call Girls In ⇛⇛Chhatarpur⇚⇚. Brings Offer Delhi Contact Us 8377877756
Call Girls In ⇛⇛Chhatarpur⇚⇚. Brings Offer Delhi Contact Us 8377877756Call Girls In ⇛⇛Chhatarpur⇚⇚. Brings Offer Delhi Contact Us 8377877756
Call Girls In ⇛⇛Chhatarpur⇚⇚. Brings Offer Delhi Contact Us 8377877756
 
Progress Report - Oracle Database Analyst Summit
Progress  Report - Oracle Database Analyst SummitProgress  Report - Oracle Database Analyst Summit
Progress Report - Oracle Database Analyst Summit
 
Islamabad Escorts | Call 03274100048 | Escort Service in Islamabad
Islamabad Escorts | Call 03274100048 | Escort Service in IslamabadIslamabad Escorts | Call 03274100048 | Escort Service in Islamabad
Islamabad Escorts | Call 03274100048 | Escort Service in Islamabad
 
Catalogue ONG NUOC PPR DE NHAT .pdf
Catalogue ONG NUOC PPR DE NHAT      .pdfCatalogue ONG NUOC PPR DE NHAT      .pdf
Catalogue ONG NUOC PPR DE NHAT .pdf
 
The CMO Survey - Highlights and Insights Report - Spring 2024
The CMO Survey - Highlights and Insights Report - Spring 2024The CMO Survey - Highlights and Insights Report - Spring 2024
The CMO Survey - Highlights and Insights Report - Spring 2024
 
Call Girls In Connaught Place Delhi ❤️88604**77959_Russian 100% Genuine Escor...
Call Girls In Connaught Place Delhi ❤️88604**77959_Russian 100% Genuine Escor...Call Girls In Connaught Place Delhi ❤️88604**77959_Russian 100% Genuine Escor...
Call Girls In Connaught Place Delhi ❤️88604**77959_Russian 100% Genuine Escor...
 
Keppel Ltd. 1Q 2024 Business Update Presentation Slides
Keppel Ltd. 1Q 2024 Business Update  Presentation SlidesKeppel Ltd. 1Q 2024 Business Update  Presentation Slides
Keppel Ltd. 1Q 2024 Business Update Presentation Slides
 
Investment analysis and portfolio management
Investment analysis and portfolio managementInvestment analysis and portfolio management
Investment analysis and portfolio management
 
Intro to BCG's Carbon Emissions Benchmark_vF.pdf
Intro to BCG's Carbon Emissions Benchmark_vF.pdfIntro to BCG's Carbon Emissions Benchmark_vF.pdf
Intro to BCG's Carbon Emissions Benchmark_vF.pdf
 
Tech Startup Growth Hacking 101 - Basics on Growth Marketing
Tech Startup Growth Hacking 101  - Basics on Growth MarketingTech Startup Growth Hacking 101  - Basics on Growth Marketing
Tech Startup Growth Hacking 101 - Basics on Growth Marketing
 
Marketing Management Business Plan_My Sweet Creations
Marketing Management Business Plan_My Sweet CreationsMarketing Management Business Plan_My Sweet Creations
Marketing Management Business Plan_My Sweet Creations
 
Call Girls In Kishangarh Delhi ❤️8860477959 Good Looking Escorts In 24/7 Delh...
Call Girls In Kishangarh Delhi ❤️8860477959 Good Looking Escorts In 24/7 Delh...Call Girls In Kishangarh Delhi ❤️8860477959 Good Looking Escorts In 24/7 Delh...
Call Girls In Kishangarh Delhi ❤️8860477959 Good Looking Escorts In 24/7 Delh...
 
Pitch Deck Teardown: NOQX's $200k Pre-seed deck
Pitch Deck Teardown: NOQX's $200k Pre-seed deckPitch Deck Teardown: NOQX's $200k Pre-seed deck
Pitch Deck Teardown: NOQX's $200k Pre-seed deck
 
VIP Call Girl Jamshedpur Aashi 8250192130 Independent Escort Service Jamshedpur
VIP Call Girl Jamshedpur Aashi 8250192130 Independent Escort Service JamshedpurVIP Call Girl Jamshedpur Aashi 8250192130 Independent Escort Service Jamshedpur
VIP Call Girl Jamshedpur Aashi 8250192130 Independent Escort Service Jamshedpur
 
(8264348440) 🔝 Call Girls In Mahipalpur 🔝 Delhi NCR
(8264348440) 🔝 Call Girls In Mahipalpur 🔝 Delhi NCR(8264348440) 🔝 Call Girls In Mahipalpur 🔝 Delhi NCR
(8264348440) 🔝 Call Girls In Mahipalpur 🔝 Delhi NCR
 

Ctia Survey Midyear 2009 Graphics

  • 1. Background on CTIA’s Semi-Annual Wireless Industry Survey CTIA-The Wireless Association®’s Semi-annual wireless industry survey develops industry-wide information drawn from operational member and non-member wireless service providers. It has been conducted since January 1985, originally as a cellular- only survey instrument, and now including PCS, ESMR and AWS licensees. No break-out of results specific to spectrum bands or licenses is performed. The information solicited from the service providers includes: direct employment, number of cell sites, total service revenues, roaming revenues as a subset of total service revenues, the average local monthly bill, and the average length of call. The average local monthly bill is developed on a weighted basis, to avoid skewing the figures. It is not an average of averages. No adjustments are made to these figures. The CTIA survey also develops information on the number of reported wireless service subscribers for the responding systems, and an estimated total subscriber figure (taking into account non-responding systems). Because the CTIA survey is a voluntary survey, it cannot compel responses from wireless carriers. However, the survey has an excellent response rate. For the June 30, 2009, installment of the semi-annual survey, CTIA received responses from companies serving 95.9 percent of wireless subscribers. Because not all systems do respond, CTIA develops an estimate of total subscribership. The estimated subscriber figure is developed by determining the identity and character of non-responding markets (i.e., RSA/MSA or equivalent-market designation, age of system, market population), and using a surrogate penetration rate applicable to similar, known systems to derive probable subscribership. These numbers are then summed with the reported subscriber numbers to reach the total estimated subscriber figures. No carrier-specific or market-specific information is maintained as a result of the survey. All such information is aggregated by an independent accounting firm to a nationwide level. The underlying source material for the survey is then destroyed per confidentiality agreements. The following tables and charts reflect selected top-of-the-line data. Complete results of CTIA’s semi-annual survey are available for purchase in the comprehensive report, CTIA’s Wireless Industry Indices: 1985 – 2008, including data on revenues, subscriber usage, investment, digital subscribership, and other operational indicators and ratios. The report is available for a member price of $850 and a non-member price of $1,075. Subsequent copies are available to members at $475 each and to non-members at $535 each. Annual subscriptions are available at a member price of $1,445 and non-member price of $1,825. The report may be ordered by contacting research@ctia.org or by ordering directly from CTIA’s Research e-Store at http://www.ctia.org/store/producttyperesults.cfm?group_id=1. Order forms are also available on CTIA’s web site, at http://files.ctia.org/pdf/Indices_Order_Form1.pdf. Materials May not be reproduced or photocopied in any form without written permission from CTIA © 2009 CTIA-The Wireless Association®
  • 2. CTIA-THE WIRELESS ASSOCIATION® ANNUALIZED U.S. WIRELESS INDUSTRY SURVEY RESULTS - JUNE 1985 TO JUNE 2009 Twelve-Month 12-Month Average Local Total Service Roamer Direct Service Monthly Bill Average Local Call Estimated Total Revenues Revenues Provider (June Survey Length (June Survey Date Subscribers (in $000s) (in $000s) Cell Sites Employees Periods) Periods) 1985 203,600 $354,316 N/a 599 1,697 N/a N/a 1986 500,000 $666,782 N/a 1,194 3,556 N/a N/a 1987 883,778 $941,981 N/a 1,732 5,656 N/a N/a 1988 1,608,697 $1,558,080 N/a 2,789 9,154 $95.00 2.25 1989 2,691,793 $2,479,936 $210,699 3,577 13,719 $85.52 2.35 1990 4,368,686 $4,060,494 $365,549 4,768 18,973 $83.94 2.32 1991 6,380,053 $5,075,963 $565,989 6,685 25,545 $74.56 2.20 1992 8,892,535 $6,688,302 $838,077 8,901 30,595 $68.51 2.38 1993 13,067,318 $9,008,700 $1,124,493 11,551 36,501 $67.31 2.38 1994 19,283,306 $12,591,947 $1,552,382 14,740 45,622 $58.65 2.36 1995 28,154,414 $16,460,516 $2,173,003 19,844 60,689 $52.45 2.27 1996 38,195,466 $21,525,861 $2,737,177 24,802 73,365 $48.84 2.24 1997 48,705,553 $25,575,275 $2,858,432 38,650 97,039 $43.86 2.25 1998 60,831,431 $29,637,742 $3,166,656 57,674 113,111 $39.88 2.34 1999 76,284,753 $37,214,819 $3,837,994 74,157 141,929 $40.24 2.40 2000 97,035,925 $45,295,550 $4,134,626 95,733 159,645 $45.15 2.48 2001 118,397,734 $58,726,376 $3,698,683 114,059 186,317 $45.56 2.62 2002 134,561,370 $71,117,599 $4,055,654 131,350 186,956 $47.42 2.60 2003 148,065,824 $81,185,272 $3,874,488 147,719 187,169 $49.46 2.63 2004 169,467,393 $95,515,593 $3,956,823 174,368 212,186 $49.49 3.06 2005 194,479,364 $108,534,727 $4,136,492 178,025 225,162 $49.52 3.04 2006 219,652,457 $118,299,682 $3,558,052 197,576 238,236 $49.30 2.94 2007 243,428,202 $132,893,824 $3,611,049 210,360 257,401 $49.94 3.13 2008 262,720,165 $143,710,400 $3,690,099 220,472 267,855 $48.54 2.43 2009 276,610,580 $151,203,725 $3,546,748 245,912 261,453 $49.57 2.03 Materials May not be reproduced or photocopied in any form without written permission from CTIA © 2009 CTIA-The Wireless Association®
  • 3. CTIA’S SEMI-ANNUAL WIRELESS INDUSTRY SURVEY RESULTS JANUARY 1985 – JUNE 2009 Roamer Service Direct Service Avg. Local Estimated Total Six-Month Revenues Provider Average Local Call Length Avg. Roam Date Subscribers Revenues ($000) ($000) Cell Sites Employees Monthly Bill (Min) Call Length Jan-85 91,600 $178,085 N/A 346 1,404 N/A N/A N/A Jun-85 203,600 $176,231 N/A 599 1,697 N/A N/A N/A Dec-85 340,213 $306,197 N/A 913 2,727 N/A N/A N/A Jun-86 500,000 $360,585 N/A 1,194 3,556 N/A N/A N/A Dec-86 681,825 $462,467 N/A 1,531 4,334 N/A N/A N/A Jun-87 883,778 $479,514 N/A 1,732 5,656 N/A N/A N/A Dec-87 1,230,855 $672,005 N/A 2,305 7,147 $96.83 N/A N/A Jun-88 1,608,697 $886,075 N/A 2,789 9,154 $95.00 N/A N/A Dec-88 2,069,441 $1,073,473 $89,331 3,209 11,400 $98.02 N/A N/A Jun-89 2,691,793 $1,406,463 $121,368 3,577 13,719 $85.52 N/A N/A Dec-89 3,508,944 $1,934,132 $173,199 4,169 15,927 $89.30 N/A N/A Jun-90 4,368,686 $2,126,362 $192,350 4,768 18,973 $83.94 N/A N/A Dec-90 5,283,055 $2,422,458 $263,660 5,616 21,382 $80.90 N/A N/A Jun-91 6,380,053 $2,653,505 $302,329 6,685 25,545 $74.56 N/A N/A Dec-91 7,557,148 $3,055,017 $401,325 7,847 26,327 $72.74 N/A N/A Jun-92 8,892,535 $3,633,285 $436,725 8,901 30,595 $68.51 N/A N/A Dec-92 11,032,753 $4,189,441 $537,146 10,307 34,348 $68.68 N/A N/A Jun-93 13,067,318 $4,819,259 $587,347 11,551 36,501 $67.31 2.38 3.38 Dec-93 16,009,461 $6,075,916 $774,266 12,824 39,810 $61.49 2.41 3.26 Jun-94 19,283,306 $6,519,031 $778,116 14,740 45,622 $58.65 2.36 2.89 Dec-94 24,134,421 $7,710,891 $1,052,666 17,920 53,902 $56.21 2.24 2.85 Jun-95 28,154,414 $8,749,625 $1,120,337 19,844 60,689 $52.45 2.27 2.74 Dec-95 33,758,661 $10,330,614 $1,422,233 22,663 68,165 $51.00 2.15 2.79 Jun-96 38,195,466 $11,194,247 $1,314,943 24,802 73,365 $48.84 2.24 2.80 Materials May not be reproduced or photocopied in any form without written permission from CTIA © 2009 CTIA-The Wireless Association®
  • 4. CTIA’S SEMI-ANNUAL WIRELESS INDUSTRY SURVEY RESULTS Total Six- Roamer Month Service Direct Service Avg. Local Estimated Revenues Revenues Provider Average Local Call Length Avg. Roam Date Subscribers ($000) ($000) Cell Sites Employees Monthly Bill (Min) Call Length Dec-96 44,042,992 $12,440,724 $1,465,992 30,045 84,161 $47.70 2.32 3.14 Jun-97 48,705,553 $13,134,551 $1,392,440 38,650 97,039 $43.86 2.25 2.95 Dec-97 55,312,293 $14,351,082 $1,581,765 51,600 109,387 $42.78 2.31 2.94 Jun-98 60,831,431 $15,286,660 $1,584,891 57,674 113,111 $39.88 2.34 2.65 Dec-98 69,209,321 $17,846,515 $1,915,578 65,887 134,754 $39.43 2.39 3.11 Jun-99 76,284,753 $19,368,304 $1,922,416 74,157 141,929 $40.24 2.40 2.96 Dec-99 86,047,003 $20,650,185 $2,163,001 81,698 155,817 $41.24 2.38 3.11 Jun-00 97,035,925 $24,645,365 $1,971,625 95,733 159,645 $45.15 2.48 3.19 Dec-00 109,478,031 $27,820,655 $1,911,356 104,288 184,449 $45.27 2.56 3.23 Jun-01 118,397,734 $30,905,721 $1,727,058 114,059 186,317 $45.56 2.62 3.01 Dec-01 128,374,512 $34,410,513 $2,205,768 127,540 203,580 $47.37 2.74 2.94 Jun-02 134,561,370 $36,707,086 $1,846,267 131,350 186,956 $47.42 2.60 3.07 Dec-02 140,766,842 $39,801,101 $2,049,245 139,338 192,410 $48.40 2.73 3.11 Jun-03 148,065,824 $41,384,171 $1,825,243 147,719 187,169 $49.46 2.63 3.15 Dec-03 158,721,981 $46,239,922 $1,941,024 162,986 205,629 $49.91 3.07 3.45 Jun-04 169,467,393 $49,275,671 $2,015,799 174,368 212,186 $49.49 3.06 3.45 Dec-04 182,140,362 $52,845,539 $2,194,532 175,725 226,016 $50.64 3.05 2.80 Jun-05 194,479,364 $55,689,208 $1,941,960 178,025 225,162 $49.52 3.04 2.66 Dec-05 207,896,198 $57,849,013 $1,844,371 183,689 233,067 $49.98 3.00 3.36 Jun-06 219,652,457 $60,450,669 $1,713,680 197,576 238,236 $49.30 2.94 3.40 Dec-06 233,040,781 $65,006,156 $1,780,614 195,613 253,793 $50.56 3.03 3.47 June-07 243,428,202 $67,887,668 $1,830,435 210,360 257,401 $49.94 3.13 3.35 Dec-07 255,395,599 $70,981,636 $1,911,579 213,299 266,782 $49.79 N/A 3.40 Jun-08 262,720,165 $72,728,764 $1,778,519 220,472 267,855 $48.54 2.43 3.16 Dec-08 270,333,881 $75,355,406 $1,960,755 242,130 268,528 $50.07 2.27 3.27 Jun-09 276,610,580 $75,848,319 $1,585,993 245,912 261,453 $49.57 2.03 3.39 Materials May not be reproduced or photocopied in any form without written permission from CTIA © 2009 CTIA-The Wireless Association®
  • 5. 276,610,580 Jun-09 262,720,165 Jun-08 243,428,202 Jun-07 219,652,457 Jun-06 194,479,364 Jun-05 169,467,393 Jun-04 148,065,824 Jun-03 Materials May not be reproduced or photocopied in any form without written permission from CTIA 134,561,370 Jun-02 118,397,734 Jun-01 Mid-Year 2009 Estimated Wireless Subscribers 97,035,925 Jun-00 76,284,753 Jun-99 Up 13.9 Million from June 2008 60,831,431 Jun-98 © 2009 CTIA-The Wireless Association® Estimated Subscribers 48,705,553 Jun-97 38,195,466 Jun-96 28,154,414 Jun-95 19,283,306 Jun-94 13,067,318 Jun-93 8,892,535 Jun-92 6,380,053 Jun-91 4,368,686 Jun-90 2,691,793 Jun-89 1,608,697 Jun-88 883,778 Jun-87 500,000 Jun-86 203,600 Jun-85 300,000,000 250,000,000 200,000,000 150,000,000 100,000,000 0 50,000,000 Source: CTIA
  • 6. Total Six-Month Service Revenues (000s) $90,000,000 $75,848,319 $72,728,764 $67,887,668 $80,000,000 $60,450,669 $70,000,000 $55,689,208 $49,275,671 $60,000,000 $41,384,171 Thousands $50,000,000 $36,707,086 $30,905,721 $40,000,000 $24,645,365 $19,368,304 $30,000,000 $15,286,660 $13,134,551 $11,194,247 $20,000,000 $8,749,625 $6,519,031 $4,819,259 $3,633,285 $2,653,505 $2,126,362 $1,406,463 $886,075 $10,000,000 $479,514 $360,585 $176,231 $0 1985 1986 1987 1988 1989 1990 1991 1992 1993 1994 1995 1996 1997 1998 1999 2000 2001 2002 2003 2004 2005 2006 2007 2008 2009 Total Wireless Service Revenues Exceed $75.8 billion for First Six Months of 2009 - Total Twelve-Month Revenues Ending June 2009 Reach More Than $151 Billion Source: CTIA Materials May not be reproduced or photocopied in any form without written permission from CTIA © 2009 CTIA-The Wireless Association®
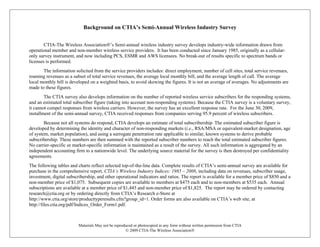
  • 7. Reported Wireless Minutes of Use Exceed 1.1 Trillion in First Half of 2009 1,200 1,000 800 Billions 600 400 200 0 Jun-91 Jun-92 Jun-93 Jun-94 Jun-95 Jun-96 Jun-97 Jun-98 Jun-99 Jun-00 Jun-01 Jun-02 Jun-03 Jun-04 Jun-05 Jun-06 Jun-07 Jun-08 Jun-09 Reported Wireless MOUs Grow 3% Year-to-Year Source: CTIA Materials May not be reproduced or photocopied in any form without written permission from CTIA © 2009 CTIA-The Wireless Association®
  • 8. 57 9. Jun-09 $4 54 8. Jun-08 $4 94 9. Jun-07 $4 30 9. Jun-06 $4 52 9. Jun-05 $4 Materials May not be reproduced or photocopied in any form without written permission from CTIA 49 9. Jun-04 Average Local Monthly Bill Up 2% Year-to-Year $4 46 9. Jun-03 $4 42 7. Jun-02 $4 56 5. Jun-01 Average Local Monthly Bill $4 © 2009 CTIA-The Wireless Association® 15 5. Jun-00 $4 24 0. Jun-99 $4 88 9. Jun-98 $3 86 3. Jun-97 $4 84 8. Jun-96 $4 45 2. Jun-95 $5 65 8. Jun-94 $5 31 7. Jun-93 $6 51 8. Jun-92 $6 56 4. Jun-91 $7 94 3. Jun-90 $8 52 5. Jun-89 $8 00 5. Jun-88 $9 Source: CTIA $100 $90 $80 $70 $60 $50 $40 $30 $20 $10 $0
  • 9. 245,912 Jun-09 220,472 Jun-08 210,360 Jun-07 197,576 Jun-06 178,025 Jun-05 174,368 Jun-04 Materials May not be reproduced or photocopied in any form without written permission from CTIA 147,719 Jun-03 Reported Cell Sites in Service are Up 11.5% Year-to-Year 131,350 Jun-02 114,059 Jun-01 95,733 Jun-00 74,157 Jun-99 © 2009 CTIA-The Wireless Association® 57,674 Jun-98 38,650 Jun-97 Cell Sites 24,802 Jun-96 19,844 Jun-95 14,740 Jun-94 11,551 Jun-93 8,901 Jun-92 6,685 Jun-91 4,768 Jun-90 3,577 Jun-89 2,789 Jun-88 1,732 Jun-87 1,194 Jun-86 599 Jun-85 275,000 250,000 225,000 200,000 175,000 150,000 125,000 100,000 75,000 50,000 25,000 0 Source: CTIA
  • 10. Direct Carrier Employees 300,000 267,855 261,453 257,401 270,000 238,236 225,162 240,000 212,186 187,169 186,956 186,317 210,000 159,645 180,000 141,929 150,000 113,111 120,000 97,039 73,365 90,000 60,689 45,622 60,000 36,501 30,595 25,545 18,973 13,719 30,000 9,154 5,656 3,556 1,697 0 Jun-85 Jun-86 Jun-87 Jun-88 Jun-89 Jun-90 Jun-91 Jun-92 Jun-93 Jun-94 Jun-95 Jun-96 Jun-97 Jun-98 Jun-99 Jun-00 Jun-01 Jun-02 Jun-03 Jun-04 Jun-05 Jun-06 Jun-07 Jun-08 Jun-09 Reported Direct Wireless Carrier Employment Falls 2.4% Year-to-Year Direct Employment More Than 261,000 at Mid-Year 2009 Source: CTIA Materials May not be reproduced or photocopied in any form without written permission from CTIA © 2009 CTIA-The Wireless Association®