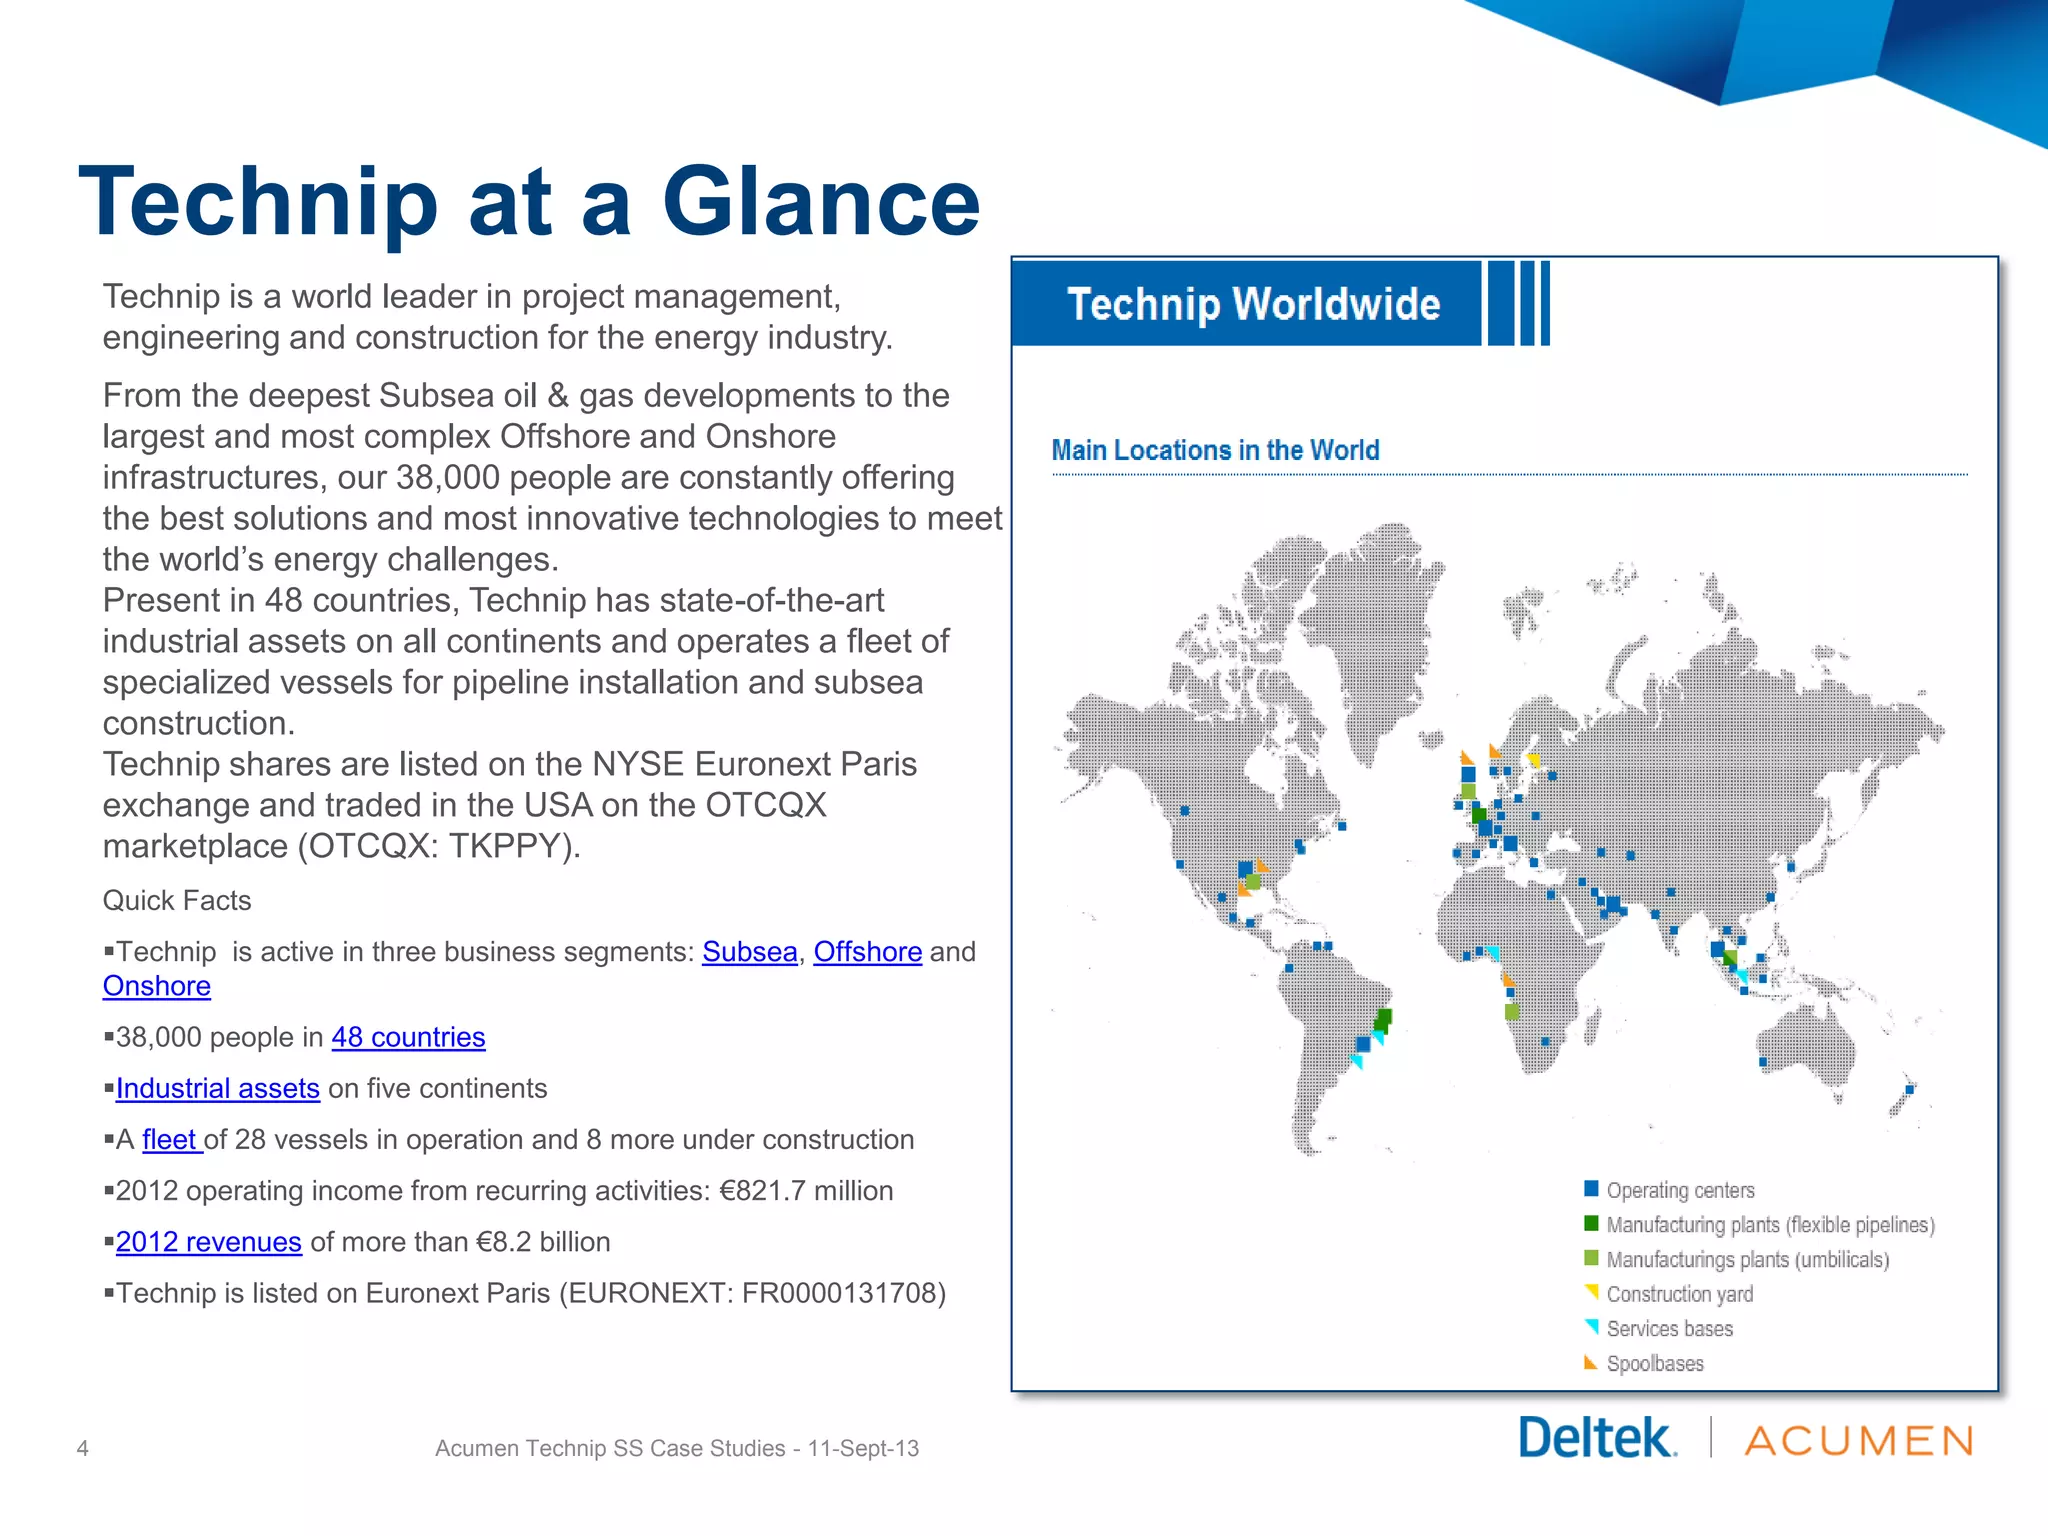
The document summarizes a case study where Technip used Acumen software to analyze schedule delays on a subsea EPCI project. Float analysis and earned value work in Acumen identified anomalies indicating client-caused delays, which impacted engineering deliverables and equipment delivery. Exporting data to Excel allowed detailed tracing of critical activities back to client review cycles exceeding agreements. The analysis supported a change order submission by determining cost impacts from the delays.

![Technip & Acumen History
Technip started using Acumen Fuse in 2009.
Acumen was officially incorporated into Technip
North America’s Schedule Review Procedure in
2010.
Technip Schedule Review Procedure consists of
the following:
o Compliance with Technip standards of EPC schedule
development
o Compliance with PMBOK & AACE.
o Technip follows Acumen Metrics [250] which include; PMI,
AACE, DCMA, & others
Technip has acquired the full Acumen Suite
which has Acumen Risk.
After a Technip/Acumen presentation in a
conference in Brazil 2013, Technip Corporation
has acquired over 25+ Acumen Licenses
Globally.
Acumen Technip SS Case Studies - 11-Sept-135](https://image.slidesharecdn.com/technipcasestudy-170830072933/75/Technip-case-study-5-2048.jpg)
![Analyzing with Acumen
Once the need was recognized, a small peer group to explore the
limitations of Acumen. Gathering all files, the business unit had to
compare all project files to see how we could prove this.
Acumen Phase Analyzer does not produce overlapping graphs over a timeline. This was
confirmed by Acumen.
Acumen recommendation was to export to Excel for further graph modifications
The planner had saved all monthly updates as baselines. So as it was suggested that we
take every baseline and compare as snapshots.
With this we were able to emulate the graph functions out of Acumen as a timeline.
See example below Float Ribbon Analyzer [count per time]
Acumen Technip SS Case Studies - 11-Sept-138](https://image.slidesharecdn.com/technipcasestudy-170830072933/75/Technip-case-study-8-2048.jpg)
![Implementing the Concept of Analysis
A concept of loading each updated schedule as a snapshot seemed to be a
feasible solution. The difference from a normal snapshot comparison is
we knew the snapshots represented an updated cycle. By renaming the
file name as a time stamp, the graph looked like time analyzed graph.
In order to emulate this function we had to do the following:
Imported 14 XER files to Acumen
To our benefit, Pat Smith [assigned planner] had backed up every month XER.
This allowed us to “act” as if each XER is a time stamp
We renamed each XER to reflect the month
Then produced a comparison of multi files named as months.
Acumen naturally compares projects but in this instance each project
represented a month, allowing a graph that looks like a time scale.
For future notice; if other projects follow similar scrutiny and do not backup or
copy files periodically (monthly? Wkly?), this emulation of a timeline can not be
reproduced within Acumen. Of course using Excel will allow modifications.
Acumen Technip SS Case Studies - 11-Sept-139](https://image.slidesharecdn.com/technipcasestudy-170830072933/75/Technip-case-study-9-2048.jpg)

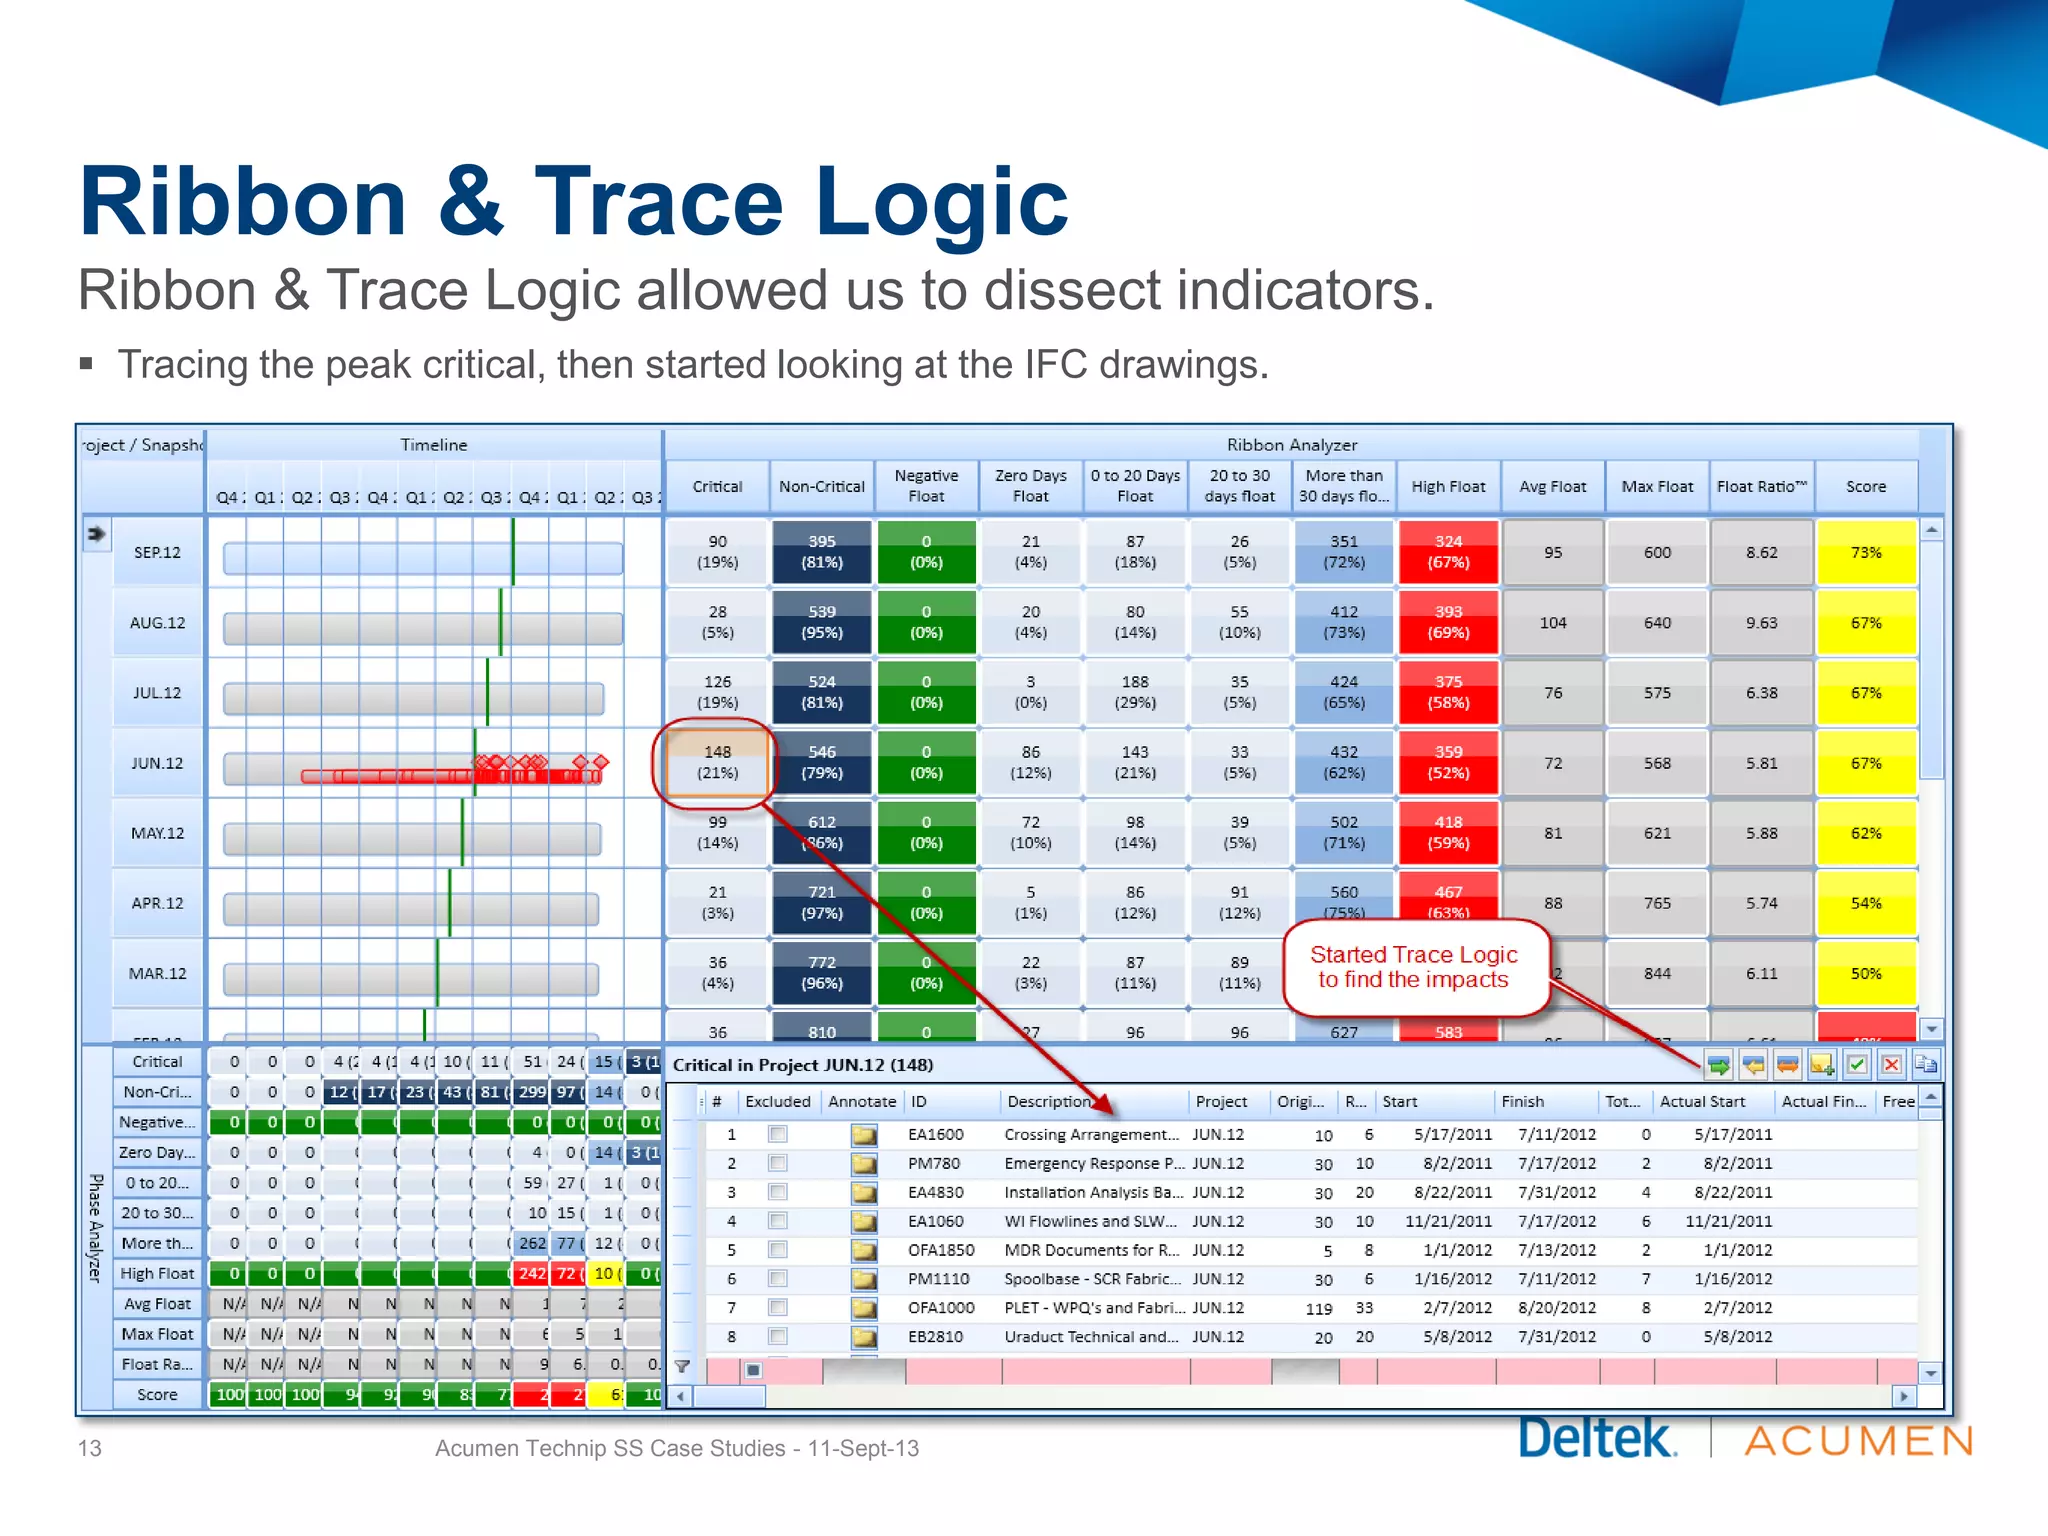
![Critical Float [count of activities]
Our immediate place to compare was the Float depletion & behavior.
As you can see in the example, there was a substantial jump in critical float count.
This allowed us to further investigate.
Acumen Technip SS Case Studies - 11-Sept-1311](https://image.slidesharecdn.com/technipcasestudy-170830072933/75/Technip-case-study-11-2048.jpg)
![0 to 20 Days Float
[count of activities]
Acumen Technip SS Case Studies - 11-Sept-1312
Our next place to compare was further Float depletion & behavior.
We looked at Non-Critical and didn’t find alarming behaviors so we moved on to 0 to 20 Days Float [count
of activities]. This also pulled up anomalies.](https://image.slidesharecdn.com/technipcasestudy-170830072933/75/Technip-case-study-12-2048.jpg)


![Earned Value Work
Schedule Variance [EV-PV]
17 Acumen Technip SS Case Studies - 11-Sept-13
Schedule Variance provides a comparison of “where we planned to be” vs “where we really are”.
Schedule Variance is using P6 values and is calculated as Earned minus Planned.
This variance shows a disparity of slipping on planned dates and is used to calculate a recovery index.](https://image.slidesharecdn.com/technipcasestudy-170830072933/75/Technip-case-study-17-2048.jpg)
![Earned Value Work
Estimate at Complete [EAC]
18 Acumen Technip SS Case Studies - 11-Sept-13
Estimate at Completion provides necessary forecasting.
Estimate at Completion has 5 different calculations. However the most common is using the “Remaining
to Earn + Actual Costs”. Acumen brings in the P6 calculation of EAC.
Since the project is still in progression and has almost halfway remaining to complete, it is important to use
current performance to provide a valid means of forecasting.
This EAC can be used to forecast cost impacts where engineering delays, manufacturer delays due to held
up specs & data sheets as well as the impact of delaying the Pipe Lay Vessel and what that equates to
dollars.](https://image.slidesharecdn.com/technipcasestudy-170830072933/75/Technip-case-study-18-2048.jpg)