Downloaded 34 times


![Thank You! Jason Little @jasonlittle http://www.agilecoach.ca [email_address] Exa mples and Other Mat erial : http://www.agilec oach.ca/visibility](https://image.slidesharecdn.com/lean11-nowhere-to-run-jasonlittle-110612191113-phpapp02/85/Making-Your-Agile-Transition-and-Org-Progress-Visible-24-320.jpg)

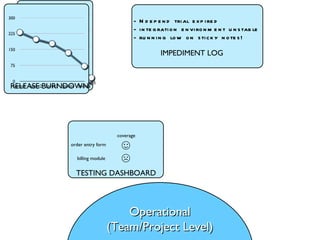
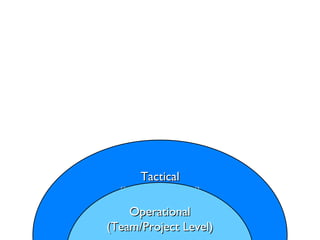
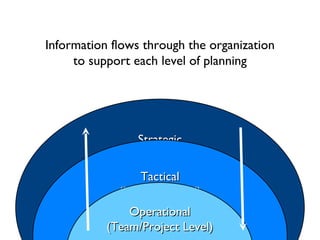
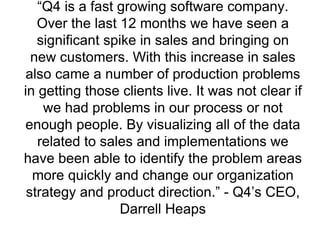
The document discusses making an organization's agile transition and progress more visible. It provides examples of visualization tools used at different levels, from team/project level like sprint burndowns and impediment logs, to portfolio level like release burndowns. The case study of a company called Q4 that saw a spike in sales and customers but production problems is discussed. By visualizing data on sales and implementations, they identified key problem areas and changed their organization strategy and product direction.


