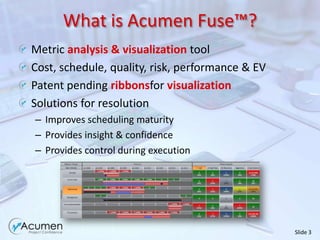
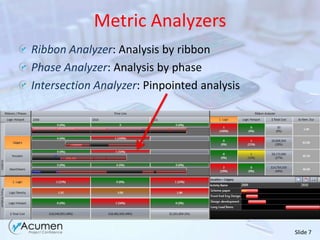
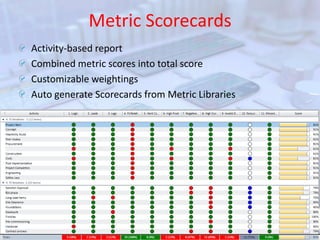
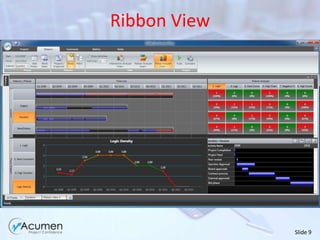
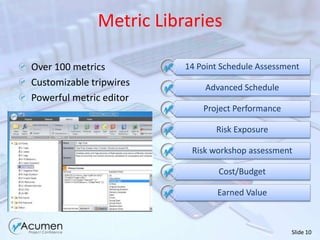
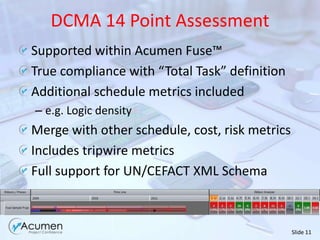
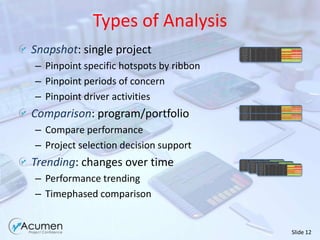
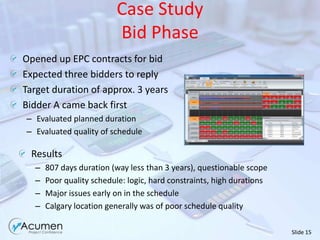
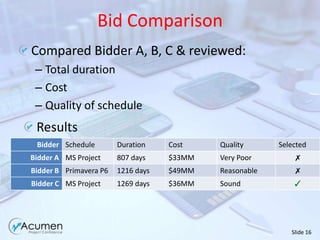
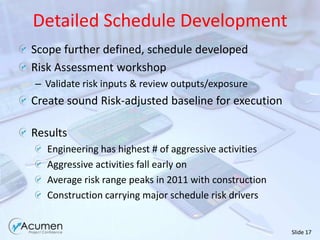
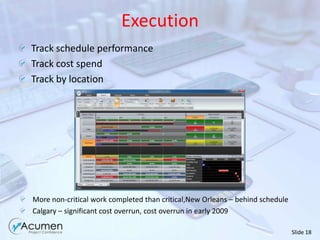
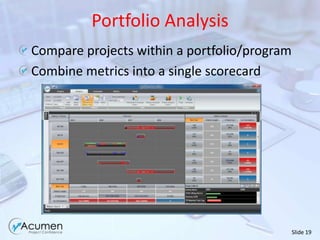
1An Introduction toAcumen Fuse™ Dr Dan Patterson PMP, CEO AcumenFebruary 2010
Project analytics thought leaderHeadquartered in Austin, TXNorth America presence, global reseller networkPrivately held, strong legacy within PPM spaceSpecialists in project analyticsRisk workshops: world leaderProject assessments, schedule analysisOracle OPN, MS PartnerOracle accredited trainerProject analytics tool: Acumen Fuse™Acumen Introduction
What is Acumen Fuse™?Metric analysis & visualization toolCost, schedule, quality, risk, performance & EVPatent pending ribbonsfor visualizationSolutions for resolutionImproves scheduling maturityProvides insight & confidenceProvides control during execution
The Need for Acumen Fuse™Project failure is not being overcome“Brain drain” in schedulingMore scrutiny in project investmentsGovernment compliance increasing (e.g. DCMA)Ensuring Project Success with Fuse™Provides “planning intelligence”Self-critique for planners/schedulersPerformance review & audit mechanismIntegrates disparate cost, schedule, risk, EV etcGives project alignment with strategic objectives
Analysis RibbonsMeans of flatteningdata, retaining sequenceGrouping activities into higher level entitiesEnables metric analysisbeyond project levelGreat visual aid forsimplifying dataProject RibbonActivity Ribbon(e.g. Critical/    non critical)Path Ribbon
Path RibbonsDetermines all paths between any two activitiesGives insight into upcoming complexity, cost, effortPowerful simplification technique Great for figuring out which paths to accelerate
Metric AnalyzersRibbon Analyzer: Analysis by ribbon Phase Analyzer: Analysis by phaseIntersection Analyzer: Pinpointed analysisRibbon AnalysisPhase Analysis
Metric ScorecardsActivity-based reportCombined metric scores into total scoreCustomizable weightingsAuto generate Scorecards from Metric Libraries
Ribbon View
Metric LibrariesOver 100 metricsCustomizable tripwiresPowerful metric editor
DCMA 14 Point AssessmentSupported within Acumen Fuse™True compliance with “Total Task” definitionAdditional schedule metrics includede.g. Logic densityMerge with other schedule, cost, risk metricsIncludes tripwire metricsFull support for UN/CEFACT XML Schema
Types of AnalysisSnapshot: single projectPinpoint specific hotspots by ribbon
Pinpoint periods of concern
Pinpoint driver activitiesComparison: program/portfolioCompare performance
Project selection decision supportTrending: changes over timePerformance trending
Timephased comparisonProduct Demos14 Point Schedule AssessmentNetwork Path AnalysisRisk AnalysisPerformance AnalysisPortfolio AnalysisEarned Value Analysis
Case StudyEPC projectThree project locationsHouston – engineering, project managementCalgary - engineeringNew Orleans - fabricationThree competing Engineering biddersObjectivesSelect winning bidDevelop achievable detailed scheduleExecute successfully
Case StudyBid PhaseOpened up EPC contracts for bidExpected three bidders to replyTarget duration of approx. 3 yearsBidder A came back firstEvaluated planned durationEvaluated quality of scheduleResults807 days duration (way less than 3 years), questionable scope
Poor quality schedule: logic, hard constraints, high durations
Major issues early on in the schedule
Calgary location generally was of poor schedule qualityBid ComparisonCompared Bidder A, B, C & reviewed:Total durationCostQuality of scheduleResults
Detailed Schedule DevelopmentScope further defined, schedule developedRisk Assessment workshopValidate risk inputs & review outputs/exposureCreate sound Risk-adjusted baseline for executionResultsEngineering has highest # of aggressive activitiesAggressive activities fall early onAverage risk range peaks in 2011 with constructionConstruction carrying major schedule risk drivers
ExecutionTrack schedule performanceTrack cost spendTrack by locationMore non-critical work completed than critical,New Orleans – behind scheduleCalgary – significant cost overrun, cost overrun in early 2009

Acumen Fuse Feb2010

  • 1.
    1An Introduction toAcumenFuse™ Dr Dan Patterson PMP, CEO AcumenFebruary 2010
  • 2.
    Project analytics thoughtleaderHeadquartered in Austin, TXNorth America presence, global reseller networkPrivately held, strong legacy within PPM spaceSpecialists in project analyticsRisk workshops: world leaderProject assessments, schedule analysisOracle OPN, MS PartnerOracle accredited trainerProject analytics tool: Acumen Fuse™Acumen Introduction
  • 3.
    What is AcumenFuse™?Metric analysis & visualization toolCost, schedule, quality, risk, performance & EVPatent pending ribbonsfor visualizationSolutions for resolutionImproves scheduling maturityProvides insight & confidenceProvides control during execution
  • 4.
    The Need forAcumen Fuse™Project failure is not being overcome“Brain drain” in schedulingMore scrutiny in project investmentsGovernment compliance increasing (e.g. DCMA)Ensuring Project Success with Fuse™Provides “planning intelligence”Self-critique for planners/schedulersPerformance review & audit mechanismIntegrates disparate cost, schedule, risk, EV etcGives project alignment with strategic objectives
  • 5.
    Analysis RibbonsMeans offlatteningdata, retaining sequenceGrouping activities into higher level entitiesEnables metric analysisbeyond project levelGreat visual aid forsimplifying dataProject RibbonActivity Ribbon(e.g. Critical/ non critical)Path Ribbon
  • 6.
    Path RibbonsDetermines allpaths between any two activitiesGives insight into upcoming complexity, cost, effortPowerful simplification technique Great for figuring out which paths to accelerate
  • 7.
    Metric AnalyzersRibbon Analyzer:Analysis by ribbon Phase Analyzer: Analysis by phaseIntersection Analyzer: Pinpointed analysisRibbon AnalysisPhase Analysis
  • 8.
    Metric ScorecardsActivity-based reportCombinedmetric scores into total scoreCustomizable weightingsAuto generate Scorecards from Metric Libraries
  • 9.
  • 10.
    Metric LibrariesOver 100metricsCustomizable tripwiresPowerful metric editor
  • 11.
    DCMA 14 PointAssessmentSupported within Acumen Fuse™True compliance with “Total Task” definitionAdditional schedule metrics includede.g. Logic densityMerge with other schedule, cost, risk metricsIncludes tripwire metricsFull support for UN/CEFACT XML Schema
  • 12.
    Types of AnalysisSnapshot:single projectPinpoint specific hotspots by ribbon
  • 13.
  • 14.
    Pinpoint driver activitiesComparison:program/portfolioCompare performance
  • 15.
    Project selection decisionsupportTrending: changes over timePerformance trending
  • 16.
    Timephased comparisonProduct Demos14Point Schedule AssessmentNetwork Path AnalysisRisk AnalysisPerformance AnalysisPortfolio AnalysisEarned Value Analysis
  • 17.
    Case StudyEPC projectThreeproject locationsHouston – engineering, project managementCalgary - engineeringNew Orleans - fabricationThree competing Engineering biddersObjectivesSelect winning bidDevelop achievable detailed scheduleExecute successfully
  • 18.
    Case StudyBid PhaseOpenedup EPC contracts for bidExpected three bidders to replyTarget duration of approx. 3 yearsBidder A came back firstEvaluated planned durationEvaluated quality of scheduleResults807 days duration (way less than 3 years), questionable scope
  • 19.
    Poor quality schedule:logic, hard constraints, high durations
  • 20.
    Major issues earlyon in the schedule
  • 21.
    Calgary location generallywas of poor schedule qualityBid ComparisonCompared Bidder A, B, C & reviewed:Total durationCostQuality of scheduleResults
  • 22.
    Detailed Schedule DevelopmentScopefurther defined, schedule developedRisk Assessment workshopValidate risk inputs & review outputs/exposureCreate sound Risk-adjusted baseline for executionResultsEngineering has highest # of aggressive activitiesAggressive activities fall early onAverage risk range peaks in 2011 with constructionConstruction carrying major schedule risk drivers
  • 23.
    ExecutionTrack schedule performanceTrackcost spendTrack by locationMore non-critical work completed than critical,New Orleans – behind scheduleCalgary – significant cost overrun, cost overrun in early 2009