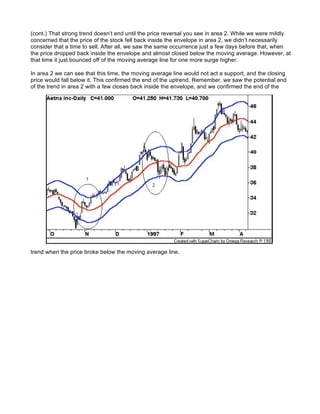
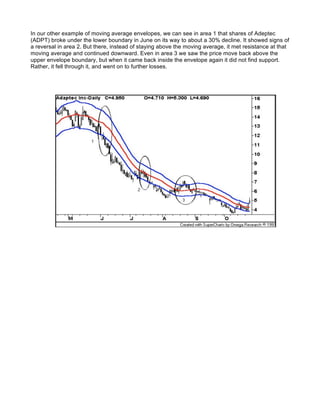
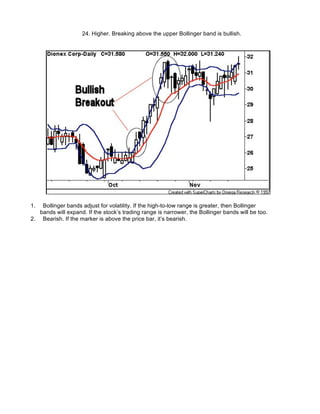
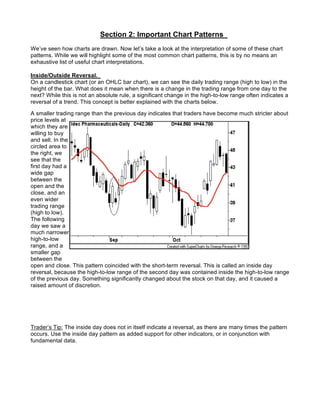
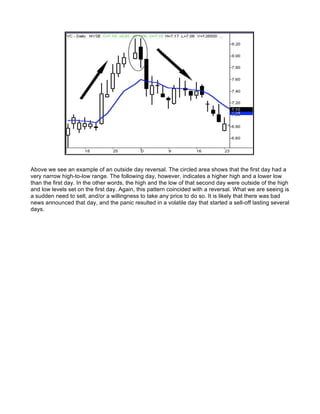
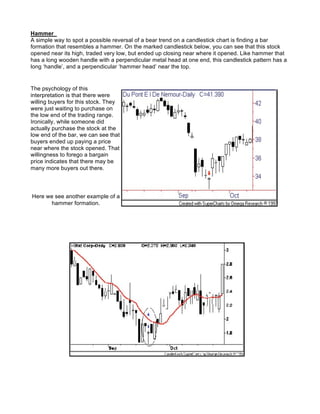
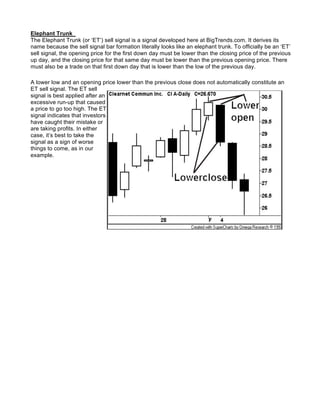
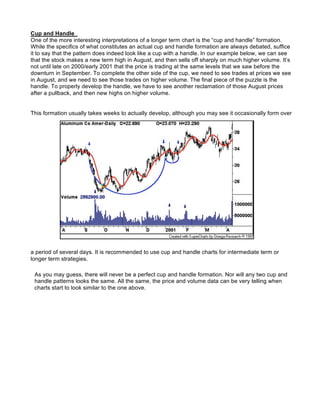
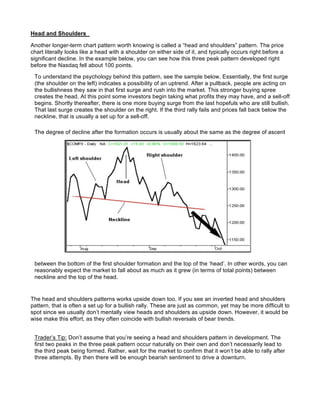
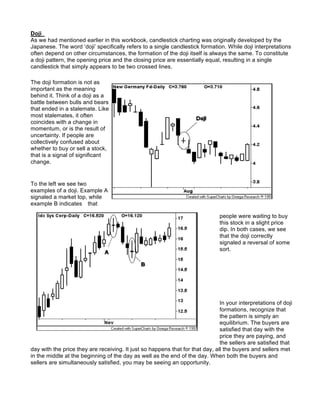
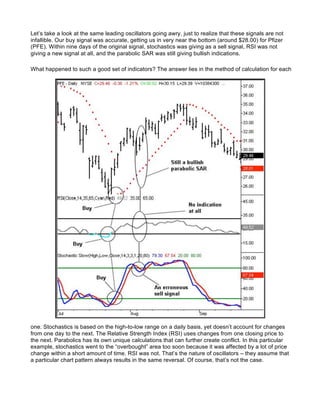
Downloaded 3,335 times

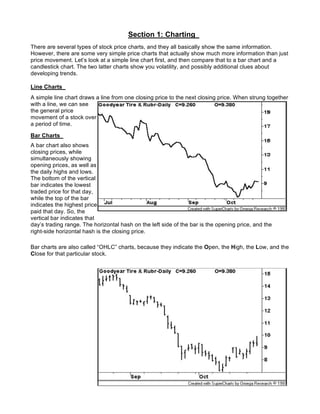
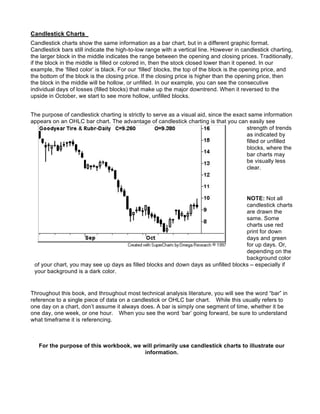
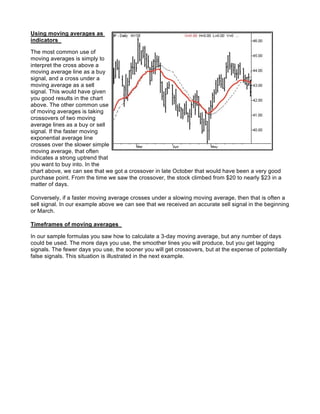
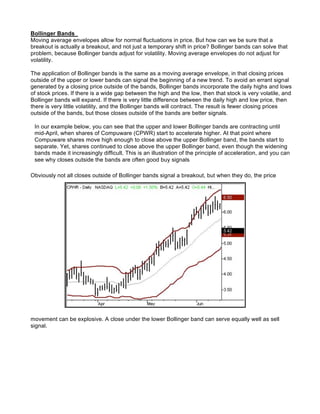


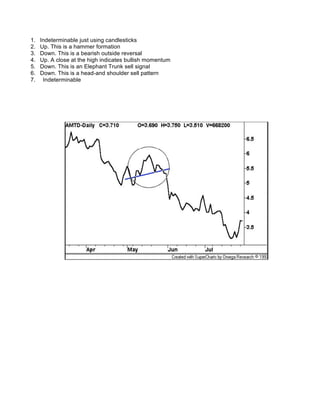
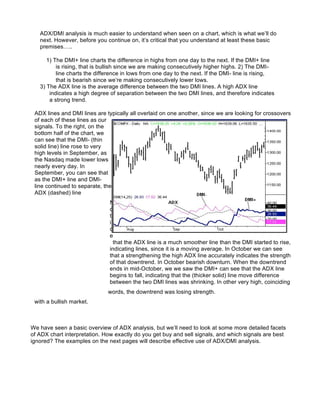


This document provides an introduction to technical analysis tools and techniques. It begins by explaining different types of stock price charts, including line charts, bar charts, and candlestick charts. It then discusses moving averages and how they can be used to identify trends. Support and resistance levels are explained as important trend lines. The document also covers envelopes, Bollinger Bands, and Parabolic SAR as additional technical indicators. It emphasizes that these tools should be used together to analyze trends and identify entry and exit points for trades.