SlideShare a Scribd company logo
1 of 23
Download to read offline
Discover the Smart Money with the
Order Block Indicator
Why You Should Trade with Order Block
Indicator?
The Most Successful Traders Use This
Identify HIGH Probability Order Block Zones
Subjective Analysis Based on Higher Timeframe
Pinpoint entries, High-risk reward & Low drawdown trade setups!
Timely Alert System for potential Trade Opportunity
We know how important it is for retail traders to get their hands on accurate market
information, and we’ve been working hard to make sure you can do just that.
But there’s a problem: how do you find the footprints of market makers? How are you
supposed to get an exact pin-point entry price?
We’ve got the answer: our new order block indicator, which gives you the exact location
of market makers on chart so that you don’t have to search blindly in the dark. With this
new indicator, finding footprints has never been easier!
Let’s first talk about the other conventional and fancy indicators like a web of moving
average lines. These indicators look very interesting at first look. But a simple buy and
sell arrow will not make you a profitable trader. Trading the Trillion dollar market is not so
simple.
Here's why conventional indicators fail to
accurately reflect the real market
Repainting indicators can make you think you are profitable, but these indicators lag
behind the real-time price action and generate false signals
The market can be unpredictable. If you’re a busy person, your trading psychology
and emotions will overcome your trading abilities without you realizing it. You need a
semi-manual trading system to overcome the psychological issues
Mathematical indicators only plot the historical data without considering market
conditions and can’t forecast the market accurately
Technical indicators won’t reveal the footprints of market makers. Leaving you at the
mercy of institutions, you need an accurate price action indicator
Most traders believe that fancy indicators are the best way to make profits trading. But in
fact, these indicators actually do more harm than good by creating false signals and
encouraging new traders to buy or sell
The shady secret behind the simple buy
and sell indicators on the internet
Let me reveal the secret of these false indicators
Look at this moving average crossover indicator. A crossover happens after a complete
price trend reversal, then after the reversal price shows a bullish crossover between two
moving averages. Now, most indicator seller’s on the internet shift the signal from left to
right by 4 to 5 candlesticks by programming. So, when a new trader looks at the chart,
the buy or sell signal will be exact on the point. But in the real market, this signal will form
after the complete trend reversal leaving you hanging in the losing trades.
t means these are repaint indicators that cannot be used for profitable trading. These
indicators look promising, but they have no worth in real markets.
Actually, all the mathematical indicators are lagging. It means they lag behind the price.
They show the past behavior of price only. And fail to give any information that can be
used to forecast the market accurately.
A trader needs a true price action indicator that can reveal the Footprints of big
institutions and banks. And We have solved this problem by making the most advanced
Order Block indicator. Our team has worked tirelessly to make this price action-based
indicator and profitable strategy. and still working to improve it with time.
Core Concepts of Order Block in Technical
Analysis
Order block means accumulation/distribution of market orders at a specific price range.
Banks and big Institutions deal with Godzilla-sized amounts of money and they cannot
execute their orders at once due to liquidity issues. Also, this decreases their profit
potential. That’s why they always distribute a big single order into chunks of small orders
at different price levels in a range to increase the profits. This also makes sure that their
order will get executed without disturbing the market
These chunks of orders of big banks and institutional traders within a ranging market
structure are called order blocks.
While trading we have to keep this fact in mind that 86% volume of the market is
controlled by banks and institutions. So having an idea about their trading footprint will
give us a huge competitive edge over other retail traders.
Two types of Order Blocks
There are two types of order blocks in technical analysis.
• Bullish Order Block
• Bearish Order Block
This is how order blocks help retail traders find the best prices to buy or sell with big
institutions. In short, this is the way to become a consistently profitable trader.
Bullish Order Block
If a bullish order block forms on the price chart, then we’ll place buy orders. A Bullish trend will form due
to large buy orders of banks and institutional traders, then we’ll follow them and will ride the trend.
Bearish Order Block
If a bearish order block forms on the price chart, then we’ll place sell orders at that price range. A bearish
trend will start from this order block due to large sell orders of institutions. This will let us ride the bearish
trend.
This is how order blocks help retail traders find the best prices to buy or sell with big
institutions. In short, this is the way to become a consistently profitable trader.
Purpose
Our main focus in trading is to identify those order block zone on the price charts using
technical analysis. If we find these order blocks then we can predict the next move of
market makers This will help us take more educated and high probable trades for
generating consistent profits.
It is a famous fact that Trend is your friend and you can only make a profit in the market
by following the market makers. And most of retail traders fail to do this because of
lagging indicators available in the market.
Working
In technical analysis, our focus as price action traders is always to find the repetitive
market patterns. These repetitive patterns help us find the sweet trading spots on the
price chart. Order block indicator works in a similar manner.
Let me explain a bit in detail…
As we know, the order block zone shows the price range/area where there are chunks of
market orders of central banks and big institutions. So, when these orders get filled then
price always repeats a specific pattern on the price chart before and after filling the
orders. This indicates to us that because of the huge influx of orders a new
bullish/bearish trend has started.
The order block zone forms when after a sideways price movement, a big trend
reversal happens, and the price gives big impulsive moves like in the image below.
There are two important parameters that shows the signs of order block formation.
• Price movement in a small sideways range
• Big impulsive price moves after breaking the small range
Order Blocks Price Pattern is a Natural
Phenomenon
Order block pattern is originated from the natural phenomenon like calm/silence before
storm.
A professional trader can see the activity of traders trading behind the chart by looking at
the candlestick chart.
Let me explain to you a little in detail.
You see the candlestick chart in the above image. The silence in the market represents
fear and small trading activity. Due to fear, low trading activity, and indecision in the
market, there is a small range of candlesticks on the chart. It shows the silence/calm in
the market.
Then after complete silence/calm, a big storm comes into the market. Storm means
market makers have decided their direction and are selling to decrease the price of a
specific trading asset. During a storm or impulsive wave, the price will increase/drop in
less time.
This is how nature and trading markets are relevant. And professional traders take
benefit from this natural behavior of the market.
8X Your Trading Account Using a Semi-
Manual Trading Strategy
Get high-Risk Reward Trade Setups
It does not mean you will wholly rely on the order block indicator to make trades, but we
have built a semi-manual trading system. In this system, you will get a price action
trading strategy along with the indicator.
It means indicator will find the high probability order block zones and then you will
apply our provided price action rules to decide and trade.
The winning ratio of a trading setup is always increased by confluence of other technical
tools. For example, if a support zone and order block zone both form at the same price
range then it means probability of bullish trend reversal will increase because the
prediction of both technical tools has been aligned up. That’s why we made a semi
manual system to increase the winning ratio of each order block zone.
Semi-Manual is always the most profitable system because it will eliminate many
psychological issues by doing the rough work for you and you will do the work only that
bring profits.
Live Trade Examples
Here are some examples of trades using the semi manual trading strategy and order
block indicator.
When a bearish order block zone form then it means market makers are selling the
currency from this order block zone. While when a bullish order block form then it means
market makers are buying the currency from that zone.
The Settings of the S&D Indicator are fully
Customizable.
Let us show you:
Number of candlesticks:
You can specify the number of same color candlesticks required to identify the order
blocks on the price chart. We have added the optimized number 5. However, you can
add other numbers for backtesting purposes.
Custom Colors:
You can change the colours of zones table cells anytime in the settings at your own will.
Show/Hide Button:
In the indicator settings, there are options if you want to show or hide some specific
zones on the chart. You can also show or hide the table at your own will.
Mobile & Desktop Friendly
Our supply and demand indicator is responsive and looks great on any device.
Real-time Alerts
The indicator has a feature where you can set up alerts for any charts, and whenever the
indicator detects an order block zone, it will send you a real-time alert. This feature will
help you stay on top of your trading.
All you need is to trade the zones and learn from the trade
Yes, show me the indicator now!
Similar Indicator, Supply And Demand Indicator

More Related Content

Similar to Discover the Smart Money with the Order Block Indicator & S&D indicator.pdf

Smc Structure and concepts of forex-smc.pdf
Smc Structure and concepts of forex-smc.pdfSmc Structure and concepts of forex-smc.pdf
Smc Structure and concepts of forex-smc.pdfAllahoudine Rahim
 
Better understand technical analysis and some indicators
Better understand technical analysis and some indicatorsBetter understand technical analysis and some indicators
Better understand technical analysis and some indicatorsAbdirahmanYusuf14
 
Best Technical Indicators for Day Trading
Best Technical Indicators for Day TradingBest Technical Indicators for Day Trading
Best Technical Indicators for Day TradingMatthiasKuerpick
 
SUPPLY AND DEMAND TRADING FOREX BOOK.pdf
SUPPLY AND DEMAND TRADING FOREX BOOK.pdfSUPPLY AND DEMAND TRADING FOREX BOOK.pdf
SUPPLY AND DEMAND TRADING FOREX BOOK.pdfQuentinoKoffi
 
Confluences For Higher Probability Trading
Confluences For Higher Probability TradingConfluences For Higher Probability Trading
Confluences For Higher Probability TradingNetpicksTrading
 
Binary Options-STEALTH-Trading-Strategy
Binary Options-STEALTH-Trading-StrategyBinary Options-STEALTH-Trading-Strategy
Binary Options-STEALTH-Trading-StrategyMichael Selim
 
Read market structure properly - redacted.pdf
Read market structure properly - redacted.pdfRead market structure properly - redacted.pdf
Read market structure properly - redacted.pdfssuserc1861b1
 
Supply and demand english
Supply and demand englishSupply and demand english
Supply and demand englishnormyusuf
 
What are Key Chart Levels and How to Trade Them
What are Key Chart Levels and How to Trade ThemWhat are Key Chart Levels and How to Trade Them
What are Key Chart Levels and How to Trade Them My Trading Skills
 
CHAPTER 7: TECHNICAL ANALYSIS BINARY OPTION
CHAPTER 7: TECHNICAL ANALYSIS BINARY OPTIONCHAPTER 7: TECHNICAL ANALYSIS BINARY OPTION
CHAPTER 7: TECHNICAL ANALYSIS BINARY OPTIONanyoption
 
what is divergence in trading
what is divergence in tradingwhat is divergence in trading
what is divergence in tradingRahulSingh4181
 
Next generation technical indicator
Next generation technical indicatorNext generation technical indicator
Next generation technical indicatorLeadingTrader21
 
Question Your Trading Rules
Question Your Trading RulesQuestion Your Trading Rules
Question Your Trading RulesNetpicksTrading
 
Presentation 01
Presentation 01Presentation 01
Presentation 01John Car
 
Can price structure and action lead the way
Can price structure and action lead the wayCan price structure and action lead the way
Can price structure and action lead the wayNetpicksTrading
 
5 Vital Tools To Improve Your Trading
5 Vital Tools To Improve Your Trading5 Vital Tools To Improve Your Trading
5 Vital Tools To Improve Your TradingNetpicksTrading
 
Introduction to excessive momentum trading
Introduction to excessive momentum tradingIntroduction to excessive momentum trading
Introduction to excessive momentum tradingLeadingTrader21
 

Similar to Discover the Smart Money with the Order Block Indicator & S&D indicator.pdf (20)

Smc Structure and concepts of forex-smc.pdf
Smc Structure and concepts of forex-smc.pdfSmc Structure and concepts of forex-smc.pdf
Smc Structure and concepts of forex-smc.pdf
 
Better understand technical analysis and some indicators
Better understand technical analysis and some indicatorsBetter understand technical analysis and some indicators
Better understand technical analysis and some indicators
 
Best Technical Indicators for Day Trading
Best Technical Indicators for Day TradingBest Technical Indicators for Day Trading
Best Technical Indicators for Day Trading
 
SUPPLY AND DEMAND TRADING FOREX BOOK.pdf
SUPPLY AND DEMAND TRADING FOREX BOOK.pdfSUPPLY AND DEMAND TRADING FOREX BOOK.pdf
SUPPLY AND DEMAND TRADING FOREX BOOK.pdf
 
Confluences For Higher Probability Trading
Confluences For Higher Probability TradingConfluences For Higher Probability Trading
Confluences For Higher Probability Trading
 
Binary Options-STEALTH-Trading-Strategy
Binary Options-STEALTH-Trading-StrategyBinary Options-STEALTH-Trading-Strategy
Binary Options-STEALTH-Trading-Strategy
 
Read market structure properly - redacted.pdf
Read market structure properly - redacted.pdfRead market structure properly - redacted.pdf
Read market structure properly - redacted.pdf
 
Orderflow
OrderflowOrderflow
Orderflow
 
Supply and demand english
Supply and demand englishSupply and demand english
Supply and demand english
 
What are Key Chart Levels and How to Trade Them
What are Key Chart Levels and How to Trade ThemWhat are Key Chart Levels and How to Trade Them
What are Key Chart Levels and How to Trade Them
 
CHAPTER 7: TECHNICAL ANALYSIS BINARY OPTION
CHAPTER 7: TECHNICAL ANALYSIS BINARY OPTIONCHAPTER 7: TECHNICAL ANALYSIS BINARY OPTION
CHAPTER 7: TECHNICAL ANALYSIS BINARY OPTION
 
what is divergence in trading
what is divergence in tradingwhat is divergence in trading
what is divergence in trading
 
Technical-Analysis.pdf
Technical-Analysis.pdfTechnical-Analysis.pdf
Technical-Analysis.pdf
 
Next generation technical indicator
Next generation technical indicatorNext generation technical indicator
Next generation technical indicator
 
Question Your Trading Rules
Question Your Trading RulesQuestion Your Trading Rules
Question Your Trading Rules
 
Powerband
PowerbandPowerband
Powerband
 
Presentation 01
Presentation 01Presentation 01
Presentation 01
 
Can price structure and action lead the way
Can price structure and action lead the wayCan price structure and action lead the way
Can price structure and action lead the way
 
5 Vital Tools To Improve Your Trading
5 Vital Tools To Improve Your Trading5 Vital Tools To Improve Your Trading
5 Vital Tools To Improve Your Trading
 
Introduction to excessive momentum trading
Introduction to excessive momentum tradingIntroduction to excessive momentum trading
Introduction to excessive momentum trading
 

Recently uploaded

ODSC - Batch to Stream workshop - integration of Apache Spark, Cassandra, Pos...
ODSC - Batch to Stream workshop - integration of Apache Spark, Cassandra, Pos...ODSC - Batch to Stream workshop - integration of Apache Spark, Cassandra, Pos...
ODSC - Batch to Stream workshop - integration of Apache Spark, Cassandra, Pos...Christina Lin
 
What are the features of Vehicle Tracking System?
What are the features of Vehicle Tracking System?What are the features of Vehicle Tracking System?
What are the features of Vehicle Tracking System?Watsoo Telematics
 
Salesforce Certified Field Service Consultant
Salesforce Certified Field Service ConsultantSalesforce Certified Field Service Consultant
Salesforce Certified Field Service ConsultantAxelRicardoTrocheRiq
 
Call Girls in Naraina Delhi 💯Call Us 🔝8264348440🔝
Call Girls in Naraina Delhi 💯Call Us 🔝8264348440🔝Call Girls in Naraina Delhi 💯Call Us 🔝8264348440🔝
Call Girls in Naraina Delhi 💯Call Us 🔝8264348440🔝soniya singh
 
What is Fashion PLM and Why Do You Need It
What is Fashion PLM and Why Do You Need ItWhat is Fashion PLM and Why Do You Need It
What is Fashion PLM and Why Do You Need ItWave PLM
 
Building Real-Time Data Pipelines: Stream & Batch Processing workshop Slide
Building Real-Time Data Pipelines: Stream & Batch Processing workshop SlideBuilding Real-Time Data Pipelines: Stream & Batch Processing workshop Slide
Building Real-Time Data Pipelines: Stream & Batch Processing workshop SlideChristina Lin
 
BATTLEFIELD ORM: TIPS, TACTICS AND STRATEGIES FOR CONQUERING YOUR DATABASE
BATTLEFIELD ORM: TIPS, TACTICS AND STRATEGIES FOR CONQUERING YOUR DATABASEBATTLEFIELD ORM: TIPS, TACTICS AND STRATEGIES FOR CONQUERING YOUR DATABASE
BATTLEFIELD ORM: TIPS, TACTICS AND STRATEGIES FOR CONQUERING YOUR DATABASEOrtus Solutions, Corp
 
why an Opensea Clone Script might be your perfect match.pdf
why an Opensea Clone Script might be your perfect match.pdfwhy an Opensea Clone Script might be your perfect match.pdf
why an Opensea Clone Script might be your perfect match.pdfjoe51371421
 
Implementing Zero Trust strategy with Azure
Implementing Zero Trust strategy with AzureImplementing Zero Trust strategy with Azure
Implementing Zero Trust strategy with AzureDinusha Kumarasiri
 
The Essentials of Digital Experience Monitoring_ A Comprehensive Guide.pdf
The Essentials of Digital Experience Monitoring_ A Comprehensive Guide.pdfThe Essentials of Digital Experience Monitoring_ A Comprehensive Guide.pdf
The Essentials of Digital Experience Monitoring_ A Comprehensive Guide.pdfkalichargn70th171
 
Advancing Engineering with AI through the Next Generation of Strategic Projec...
Advancing Engineering with AI through the Next Generation of Strategic Projec...Advancing Engineering with AI through the Next Generation of Strategic Projec...
Advancing Engineering with AI through the Next Generation of Strategic Projec...OnePlan Solutions
 
Engage Usergroup 2024 - The Good The Bad_The Ugly
Engage Usergroup 2024 - The Good The Bad_The UglyEngage Usergroup 2024 - The Good The Bad_The Ugly
Engage Usergroup 2024 - The Good The Bad_The UglyFrank van der Linden
 
办理学位证(UQ文凭证书)昆士兰大学毕业证成绩单原版一模一样
办理学位证(UQ文凭证书)昆士兰大学毕业证成绩单原版一模一样办理学位证(UQ文凭证书)昆士兰大学毕业证成绩单原版一模一样
办理学位证(UQ文凭证书)昆士兰大学毕业证成绩单原版一模一样umasea
 
Steps To Getting Up And Running Quickly With MyTimeClock Employee Scheduling ...
Steps To Getting Up And Running Quickly With MyTimeClock Employee Scheduling ...Steps To Getting Up And Running Quickly With MyTimeClock Employee Scheduling ...
Steps To Getting Up And Running Quickly With MyTimeClock Employee Scheduling ...MyIntelliSource, Inc.
 
Asset Management Software - Infographic
Asset Management Software - InfographicAsset Management Software - Infographic
Asset Management Software - InfographicHr365.us smith
 
Try MyIntelliAccount Cloud Accounting Software As A Service Solution Risk Fre...
Try MyIntelliAccount Cloud Accounting Software As A Service Solution Risk Fre...Try MyIntelliAccount Cloud Accounting Software As A Service Solution Risk Fre...
Try MyIntelliAccount Cloud Accounting Software As A Service Solution Risk Fre...MyIntelliSource, Inc.
 
The Evolution of Karaoke From Analog to App.pdf
The Evolution of Karaoke From Analog to App.pdfThe Evolution of Karaoke From Analog to App.pdf
The Evolution of Karaoke From Analog to App.pdfPower Karaoke
 
buds n tech IT solutions
buds n  tech IT                solutionsbuds n  tech IT                solutions
buds n tech IT solutionsmonugehlot87
 
XpertSolvers: Your Partner in Building Innovative Software Solutions
XpertSolvers: Your Partner in Building Innovative Software SolutionsXpertSolvers: Your Partner in Building Innovative Software Solutions
XpertSolvers: Your Partner in Building Innovative Software SolutionsMehedi Hasan Shohan
 
Building a General PDE Solving Framework with Symbolic-Numeric Scientific Mac...
Building a General PDE Solving Framework with Symbolic-Numeric Scientific Mac...Building a General PDE Solving Framework with Symbolic-Numeric Scientific Mac...
Building a General PDE Solving Framework with Symbolic-Numeric Scientific Mac...stazi3110
 

Recently uploaded (20)

ODSC - Batch to Stream workshop - integration of Apache Spark, Cassandra, Pos...
ODSC - Batch to Stream workshop - integration of Apache Spark, Cassandra, Pos...ODSC - Batch to Stream workshop - integration of Apache Spark, Cassandra, Pos...
ODSC - Batch to Stream workshop - integration of Apache Spark, Cassandra, Pos...
 
What are the features of Vehicle Tracking System?
What are the features of Vehicle Tracking System?What are the features of Vehicle Tracking System?
What are the features of Vehicle Tracking System?
 
Salesforce Certified Field Service Consultant
Salesforce Certified Field Service ConsultantSalesforce Certified Field Service Consultant
Salesforce Certified Field Service Consultant
 
Call Girls in Naraina Delhi 💯Call Us 🔝8264348440🔝
Call Girls in Naraina Delhi 💯Call Us 🔝8264348440🔝Call Girls in Naraina Delhi 💯Call Us 🔝8264348440🔝
Call Girls in Naraina Delhi 💯Call Us 🔝8264348440🔝
 
What is Fashion PLM and Why Do You Need It
What is Fashion PLM and Why Do You Need ItWhat is Fashion PLM and Why Do You Need It
What is Fashion PLM and Why Do You Need It
 
Building Real-Time Data Pipelines: Stream & Batch Processing workshop Slide
Building Real-Time Data Pipelines: Stream & Batch Processing workshop SlideBuilding Real-Time Data Pipelines: Stream & Batch Processing workshop Slide
Building Real-Time Data Pipelines: Stream & Batch Processing workshop Slide
 
BATTLEFIELD ORM: TIPS, TACTICS AND STRATEGIES FOR CONQUERING YOUR DATABASE
BATTLEFIELD ORM: TIPS, TACTICS AND STRATEGIES FOR CONQUERING YOUR DATABASEBATTLEFIELD ORM: TIPS, TACTICS AND STRATEGIES FOR CONQUERING YOUR DATABASE
BATTLEFIELD ORM: TIPS, TACTICS AND STRATEGIES FOR CONQUERING YOUR DATABASE
 
why an Opensea Clone Script might be your perfect match.pdf
why an Opensea Clone Script might be your perfect match.pdfwhy an Opensea Clone Script might be your perfect match.pdf
why an Opensea Clone Script might be your perfect match.pdf
 
Implementing Zero Trust strategy with Azure
Implementing Zero Trust strategy with AzureImplementing Zero Trust strategy with Azure
Implementing Zero Trust strategy with Azure
 
The Essentials of Digital Experience Monitoring_ A Comprehensive Guide.pdf
The Essentials of Digital Experience Monitoring_ A Comprehensive Guide.pdfThe Essentials of Digital Experience Monitoring_ A Comprehensive Guide.pdf
The Essentials of Digital Experience Monitoring_ A Comprehensive Guide.pdf
 
Advancing Engineering with AI through the Next Generation of Strategic Projec...
Advancing Engineering with AI through the Next Generation of Strategic Projec...Advancing Engineering with AI through the Next Generation of Strategic Projec...
Advancing Engineering with AI through the Next Generation of Strategic Projec...
 
Engage Usergroup 2024 - The Good The Bad_The Ugly
Engage Usergroup 2024 - The Good The Bad_The UglyEngage Usergroup 2024 - The Good The Bad_The Ugly
Engage Usergroup 2024 - The Good The Bad_The Ugly
 
办理学位证(UQ文凭证书)昆士兰大学毕业证成绩单原版一模一样
办理学位证(UQ文凭证书)昆士兰大学毕业证成绩单原版一模一样办理学位证(UQ文凭证书)昆士兰大学毕业证成绩单原版一模一样
办理学位证(UQ文凭证书)昆士兰大学毕业证成绩单原版一模一样
 
Steps To Getting Up And Running Quickly With MyTimeClock Employee Scheduling ...
Steps To Getting Up And Running Quickly With MyTimeClock Employee Scheduling ...Steps To Getting Up And Running Quickly With MyTimeClock Employee Scheduling ...
Steps To Getting Up And Running Quickly With MyTimeClock Employee Scheduling ...
 
Asset Management Software - Infographic
Asset Management Software - InfographicAsset Management Software - Infographic
Asset Management Software - Infographic
 
Try MyIntelliAccount Cloud Accounting Software As A Service Solution Risk Fre...
Try MyIntelliAccount Cloud Accounting Software As A Service Solution Risk Fre...Try MyIntelliAccount Cloud Accounting Software As A Service Solution Risk Fre...
Try MyIntelliAccount Cloud Accounting Software As A Service Solution Risk Fre...
 
The Evolution of Karaoke From Analog to App.pdf
The Evolution of Karaoke From Analog to App.pdfThe Evolution of Karaoke From Analog to App.pdf
The Evolution of Karaoke From Analog to App.pdf
 
buds n tech IT solutions
buds n  tech IT                solutionsbuds n  tech IT                solutions
buds n tech IT solutions
 
XpertSolvers: Your Partner in Building Innovative Software Solutions
XpertSolvers: Your Partner in Building Innovative Software SolutionsXpertSolvers: Your Partner in Building Innovative Software Solutions
XpertSolvers: Your Partner in Building Innovative Software Solutions
 
Building a General PDE Solving Framework with Symbolic-Numeric Scientific Mac...
Building a General PDE Solving Framework with Symbolic-Numeric Scientific Mac...Building a General PDE Solving Framework with Symbolic-Numeric Scientific Mac...
Building a General PDE Solving Framework with Symbolic-Numeric Scientific Mac...
 

Discover the Smart Money with the Order Block Indicator & S&D indicator.pdf

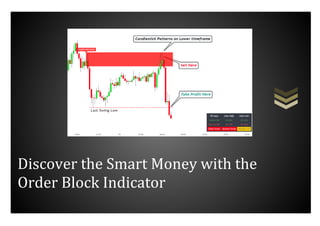
  • 1. Discover the Smart Money with the Order Block Indicator
  • 2. Why You Should Trade with Order Block Indicator? The Most Successful Traders Use This Identify HIGH Probability Order Block Zones Subjective Analysis Based on Higher Timeframe Pinpoint entries, High-risk reward & Low drawdown trade setups! Timely Alert System for potential Trade Opportunity We know how important it is for retail traders to get their hands on accurate market information, and we’ve been working hard to make sure you can do just that. But there’s a problem: how do you find the footprints of market makers? How are you supposed to get an exact pin-point entry price? We’ve got the answer: our new order block indicator, which gives you the exact location of market makers on chart so that you don’t have to search blindly in the dark. With this new indicator, finding footprints has never been easier!
  • 3. Let’s first talk about the other conventional and fancy indicators like a web of moving average lines. These indicators look very interesting at first look. But a simple buy and sell arrow will not make you a profitable trader. Trading the Trillion dollar market is not so simple. Here's why conventional indicators fail to accurately reflect the real market Repainting indicators can make you think you are profitable, but these indicators lag behind the real-time price action and generate false signals The market can be unpredictable. If you’re a busy person, your trading psychology and emotions will overcome your trading abilities without you realizing it. You need a semi-manual trading system to overcome the psychological issues Mathematical indicators only plot the historical data without considering market conditions and can’t forecast the market accurately Technical indicators won’t reveal the footprints of market makers. Leaving you at the mercy of institutions, you need an accurate price action indicator
  • 4. Most traders believe that fancy indicators are the best way to make profits trading. But in fact, these indicators actually do more harm than good by creating false signals and encouraging new traders to buy or sell The shady secret behind the simple buy and sell indicators on the internet
  • 5. Let me reveal the secret of these false indicators Look at this moving average crossover indicator. A crossover happens after a complete price trend reversal, then after the reversal price shows a bullish crossover between two moving averages. Now, most indicator seller’s on the internet shift the signal from left to right by 4 to 5 candlesticks by programming. So, when a new trader looks at the chart, the buy or sell signal will be exact on the point. But in the real market, this signal will form after the complete trend reversal leaving you hanging in the losing trades. Most traders believe that fancy indicators are the best way to make profits trading. But in fact, these indicators actually do more harm than good by creating false signals and encouraging new traders to buy or sell The shady secret behind the simple buy and sell indicators on the internet Let me reveal the secret of these false indicators Look at this moving average crossover indicator. A crossover happens after a complete price trend reversal, then after the reversal price shows a bullish crossover between two moving averages. Now, most indicator seller’s on the internet shift the signal from left to right by 4 to 5 candlesticks by programming. So, when a new trader looks at the chart,
  • 6. the buy or sell signal will be exact on the point. But in the real market, this signal will form after the complete trend reversal leaving you hanging in the losing trades.
  • 7. t means these are repaint indicators that cannot be used for profitable trading. These indicators look promising, but they have no worth in real markets. Actually, all the mathematical indicators are lagging. It means they lag behind the price. They show the past behavior of price only. And fail to give any information that can be used to forecast the market accurately. A trader needs a true price action indicator that can reveal the Footprints of big institutions and banks. And We have solved this problem by making the most advanced Order Block indicator. Our team has worked tirelessly to make this price action-based indicator and profitable strategy. and still working to improve it with time.
  • 8. Core Concepts of Order Block in Technical Analysis Order block means accumulation/distribution of market orders at a specific price range. Banks and big Institutions deal with Godzilla-sized amounts of money and they cannot execute their orders at once due to liquidity issues. Also, this decreases their profit potential. That’s why they always distribute a big single order into chunks of small orders at different price levels in a range to increase the profits. This also makes sure that their order will get executed without disturbing the market
  • 9. These chunks of orders of big banks and institutional traders within a ranging market structure are called order blocks. While trading we have to keep this fact in mind that 86% volume of the market is controlled by banks and institutions. So having an idea about their trading footprint will give us a huge competitive edge over other retail traders. Two types of Order Blocks There are two types of order blocks in technical analysis. • Bullish Order Block • Bearish Order Block This is how order blocks help retail traders find the best prices to buy or sell with big institutions. In short, this is the way to become a consistently profitable trader. Bullish Order Block If a bullish order block forms on the price chart, then we’ll place buy orders. A Bullish trend will form due to large buy orders of banks and institutional traders, then we’ll follow them and will ride the trend.
  • 10. Bearish Order Block If a bearish order block forms on the price chart, then we’ll place sell orders at that price range. A bearish trend will start from this order block due to large sell orders of institutions. This will let us ride the bearish trend.
  • 11. This is how order blocks help retail traders find the best prices to buy or sell with big institutions. In short, this is the way to become a consistently profitable trader.
  • 12. Purpose Our main focus in trading is to identify those order block zone on the price charts using technical analysis. If we find these order blocks then we can predict the next move of market makers This will help us take more educated and high probable trades for generating consistent profits. It is a famous fact that Trend is your friend and you can only make a profit in the market by following the market makers. And most of retail traders fail to do this because of lagging indicators available in the market.
  • 13. Working In technical analysis, our focus as price action traders is always to find the repetitive market patterns. These repetitive patterns help us find the sweet trading spots on the price chart. Order block indicator works in a similar manner.
  • 14. Let me explain a bit in detail… As we know, the order block zone shows the price range/area where there are chunks of market orders of central banks and big institutions. So, when these orders get filled then price always repeats a specific pattern on the price chart before and after filling the orders. This indicates to us that because of the huge influx of orders a new bullish/bearish trend has started. The order block zone forms when after a sideways price movement, a big trend reversal happens, and the price gives big impulsive moves like in the image below.
  • 15. There are two important parameters that shows the signs of order block formation. • Price movement in a small sideways range • Big impulsive price moves after breaking the small range Order Blocks Price Pattern is a Natural Phenomenon Order block pattern is originated from the natural phenomenon like calm/silence before storm. A professional trader can see the activity of traders trading behind the chart by looking at the candlestick chart.
  • 16. Let me explain to you a little in detail. You see the candlestick chart in the above image. The silence in the market represents fear and small trading activity. Due to fear, low trading activity, and indecision in the market, there is a small range of candlesticks on the chart. It shows the silence/calm in the market.
  • 17. Then after complete silence/calm, a big storm comes into the market. Storm means market makers have decided their direction and are selling to decrease the price of a specific trading asset. During a storm or impulsive wave, the price will increase/drop in less time. This is how nature and trading markets are relevant. And professional traders take benefit from this natural behavior of the market. 8X Your Trading Account Using a Semi- Manual Trading Strategy Get high-Risk Reward Trade Setups It does not mean you will wholly rely on the order block indicator to make trades, but we have built a semi-manual trading system. In this system, you will get a price action trading strategy along with the indicator. It means indicator will find the high probability order block zones and then you will apply our provided price action rules to decide and trade.
  • 18. The winning ratio of a trading setup is always increased by confluence of other technical tools. For example, if a support zone and order block zone both form at the same price range then it means probability of bullish trend reversal will increase because the prediction of both technical tools has been aligned up. That’s why we made a semi manual system to increase the winning ratio of each order block zone.
  • 19. Semi-Manual is always the most profitable system because it will eliminate many psychological issues by doing the rough work for you and you will do the work only that bring profits. Live Trade Examples Here are some examples of trades using the semi manual trading strategy and order block indicator. When a bearish order block zone form then it means market makers are selling the currency from this order block zone. While when a bullish order block form then it means market makers are buying the currency from that zone. The Settings of the S&D Indicator are fully Customizable. Let us show you:
  • 20. Number of candlesticks: You can specify the number of same color candlesticks required to identify the order blocks on the price chart. We have added the optimized number 5. However, you can add other numbers for backtesting purposes. Custom Colors: You can change the colours of zones table cells anytime in the settings at your own will. Show/Hide Button: In the indicator settings, there are options if you want to show or hide some specific zones on the chart. You can also show or hide the table at your own will.
  • 21. Mobile & Desktop Friendly Our supply and demand indicator is responsive and looks great on any device.
  • 22. Real-time Alerts The indicator has a feature where you can set up alerts for any charts, and whenever the indicator detects an order block zone, it will send you a real-time alert. This feature will help you stay on top of your trading.
  • 23. All you need is to trade the zones and learn from the trade Yes, show me the indicator now! Similar Indicator, Supply And Demand Indicator