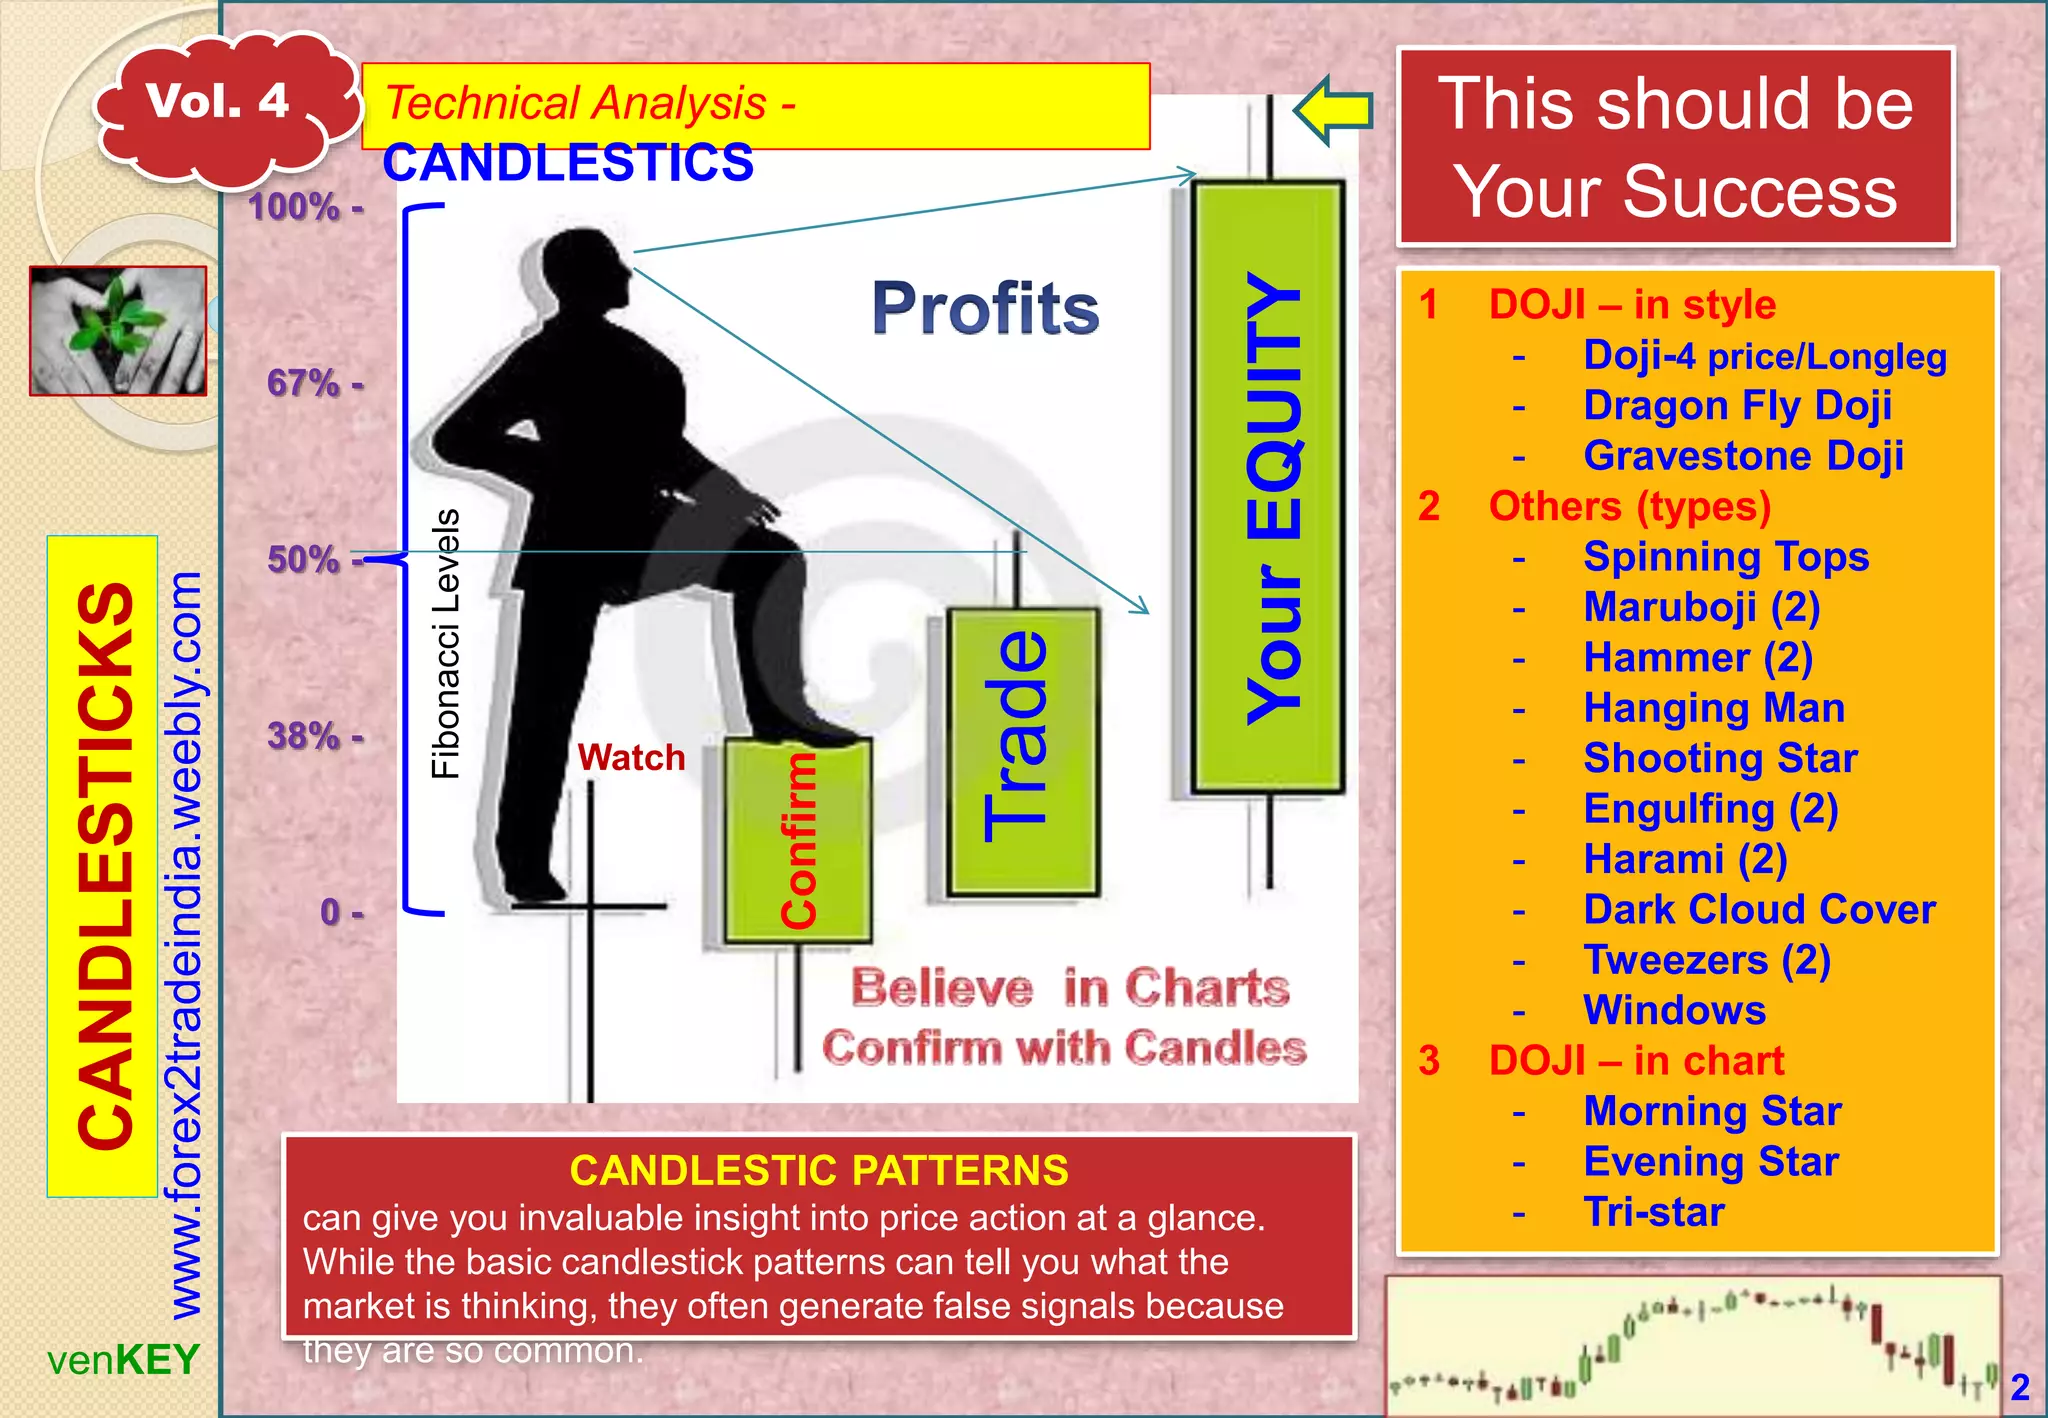
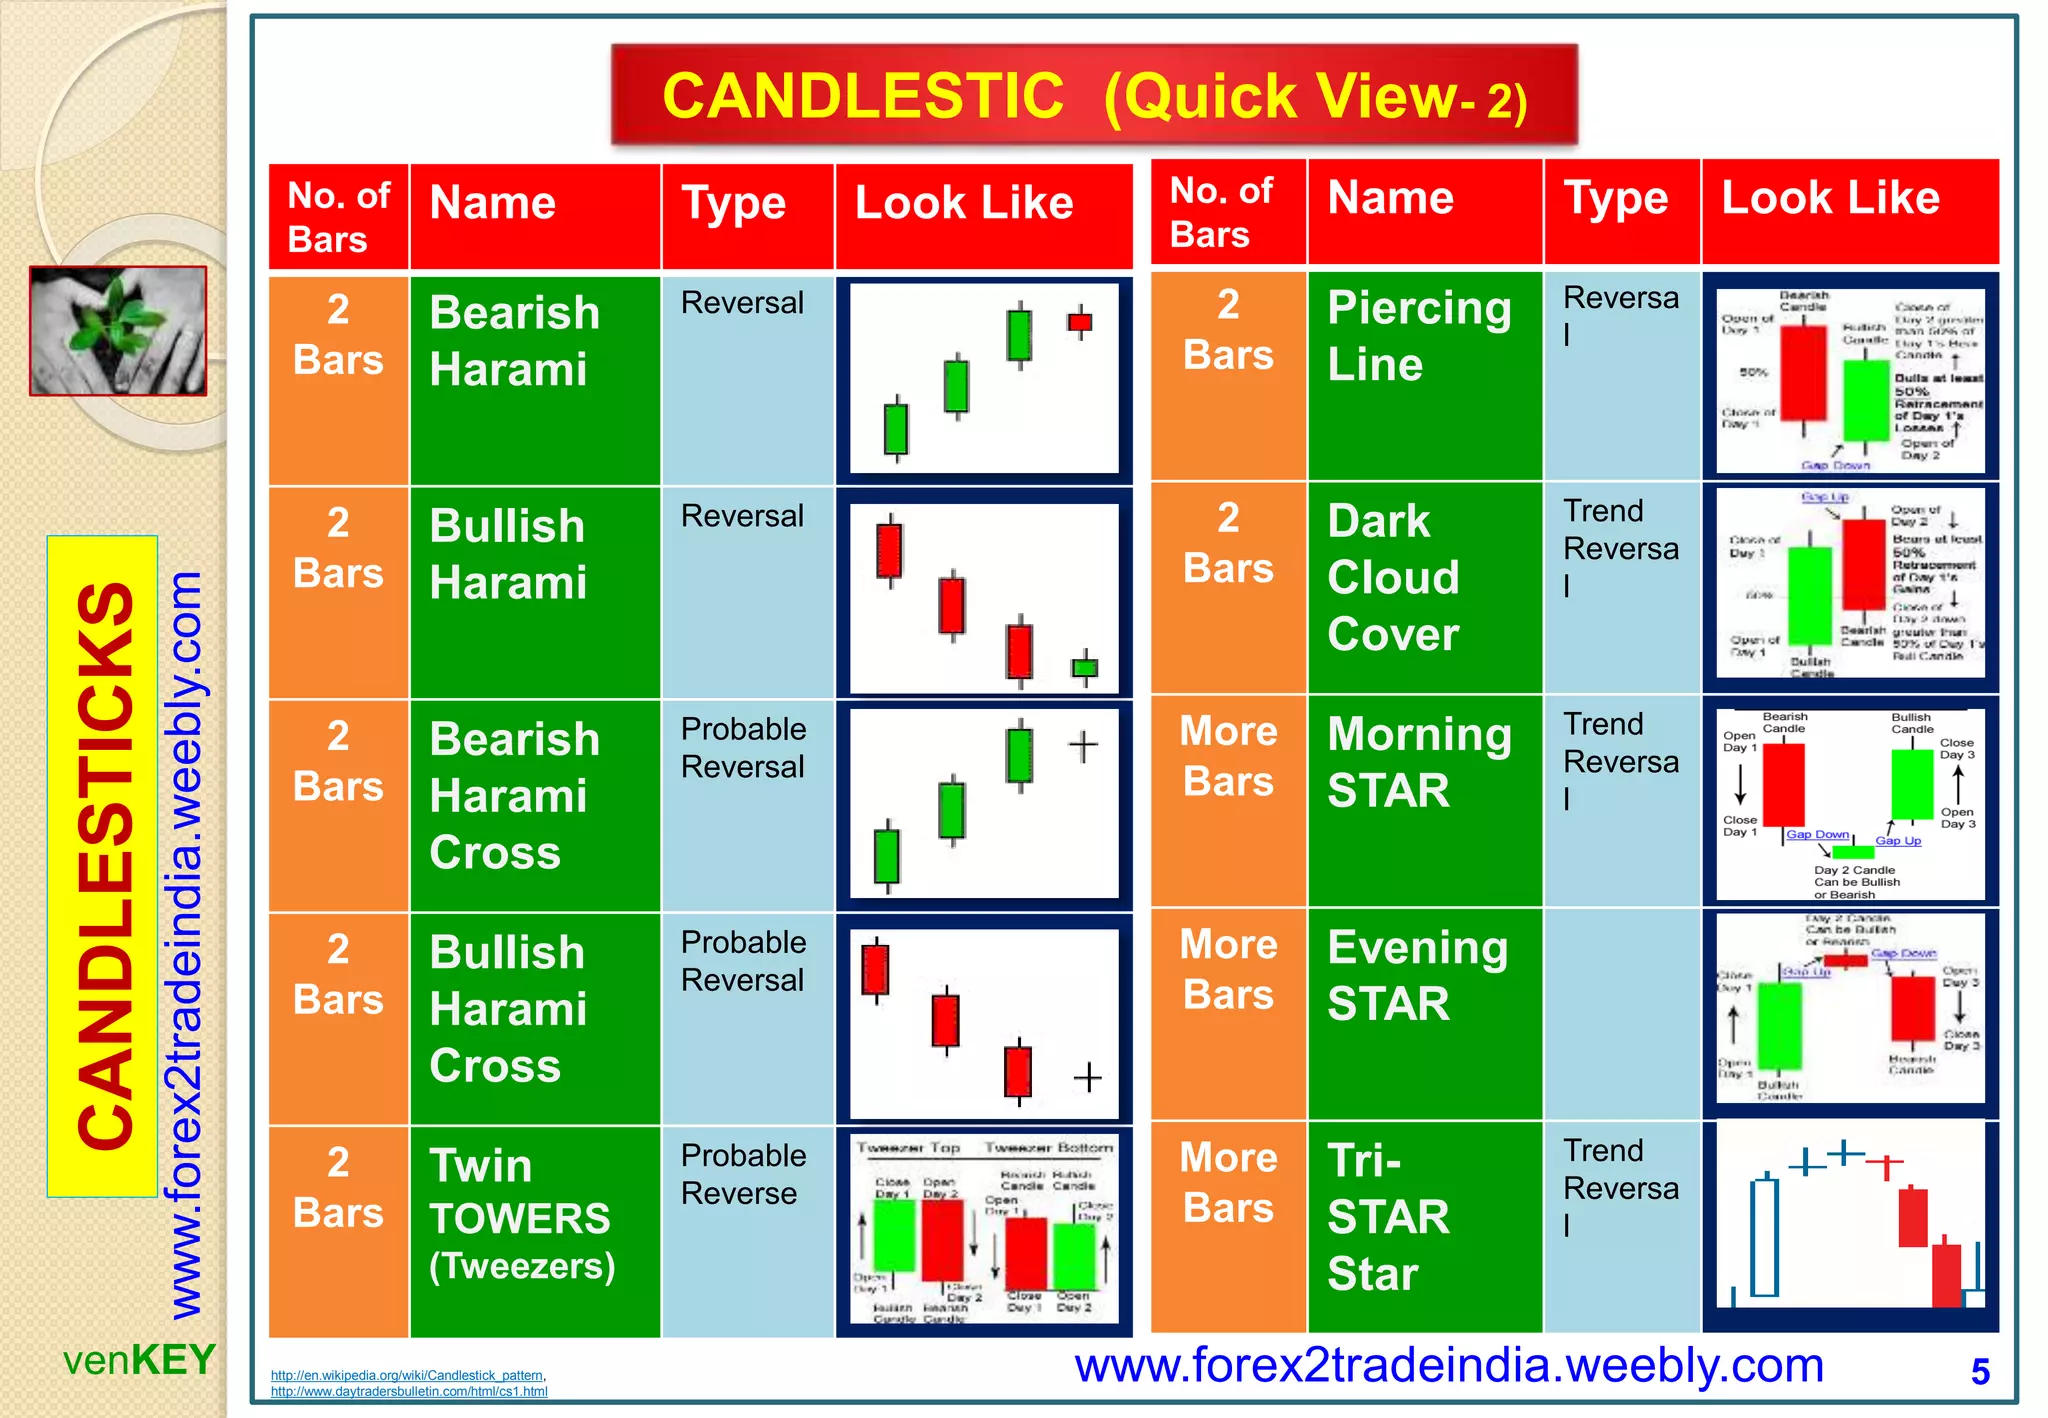
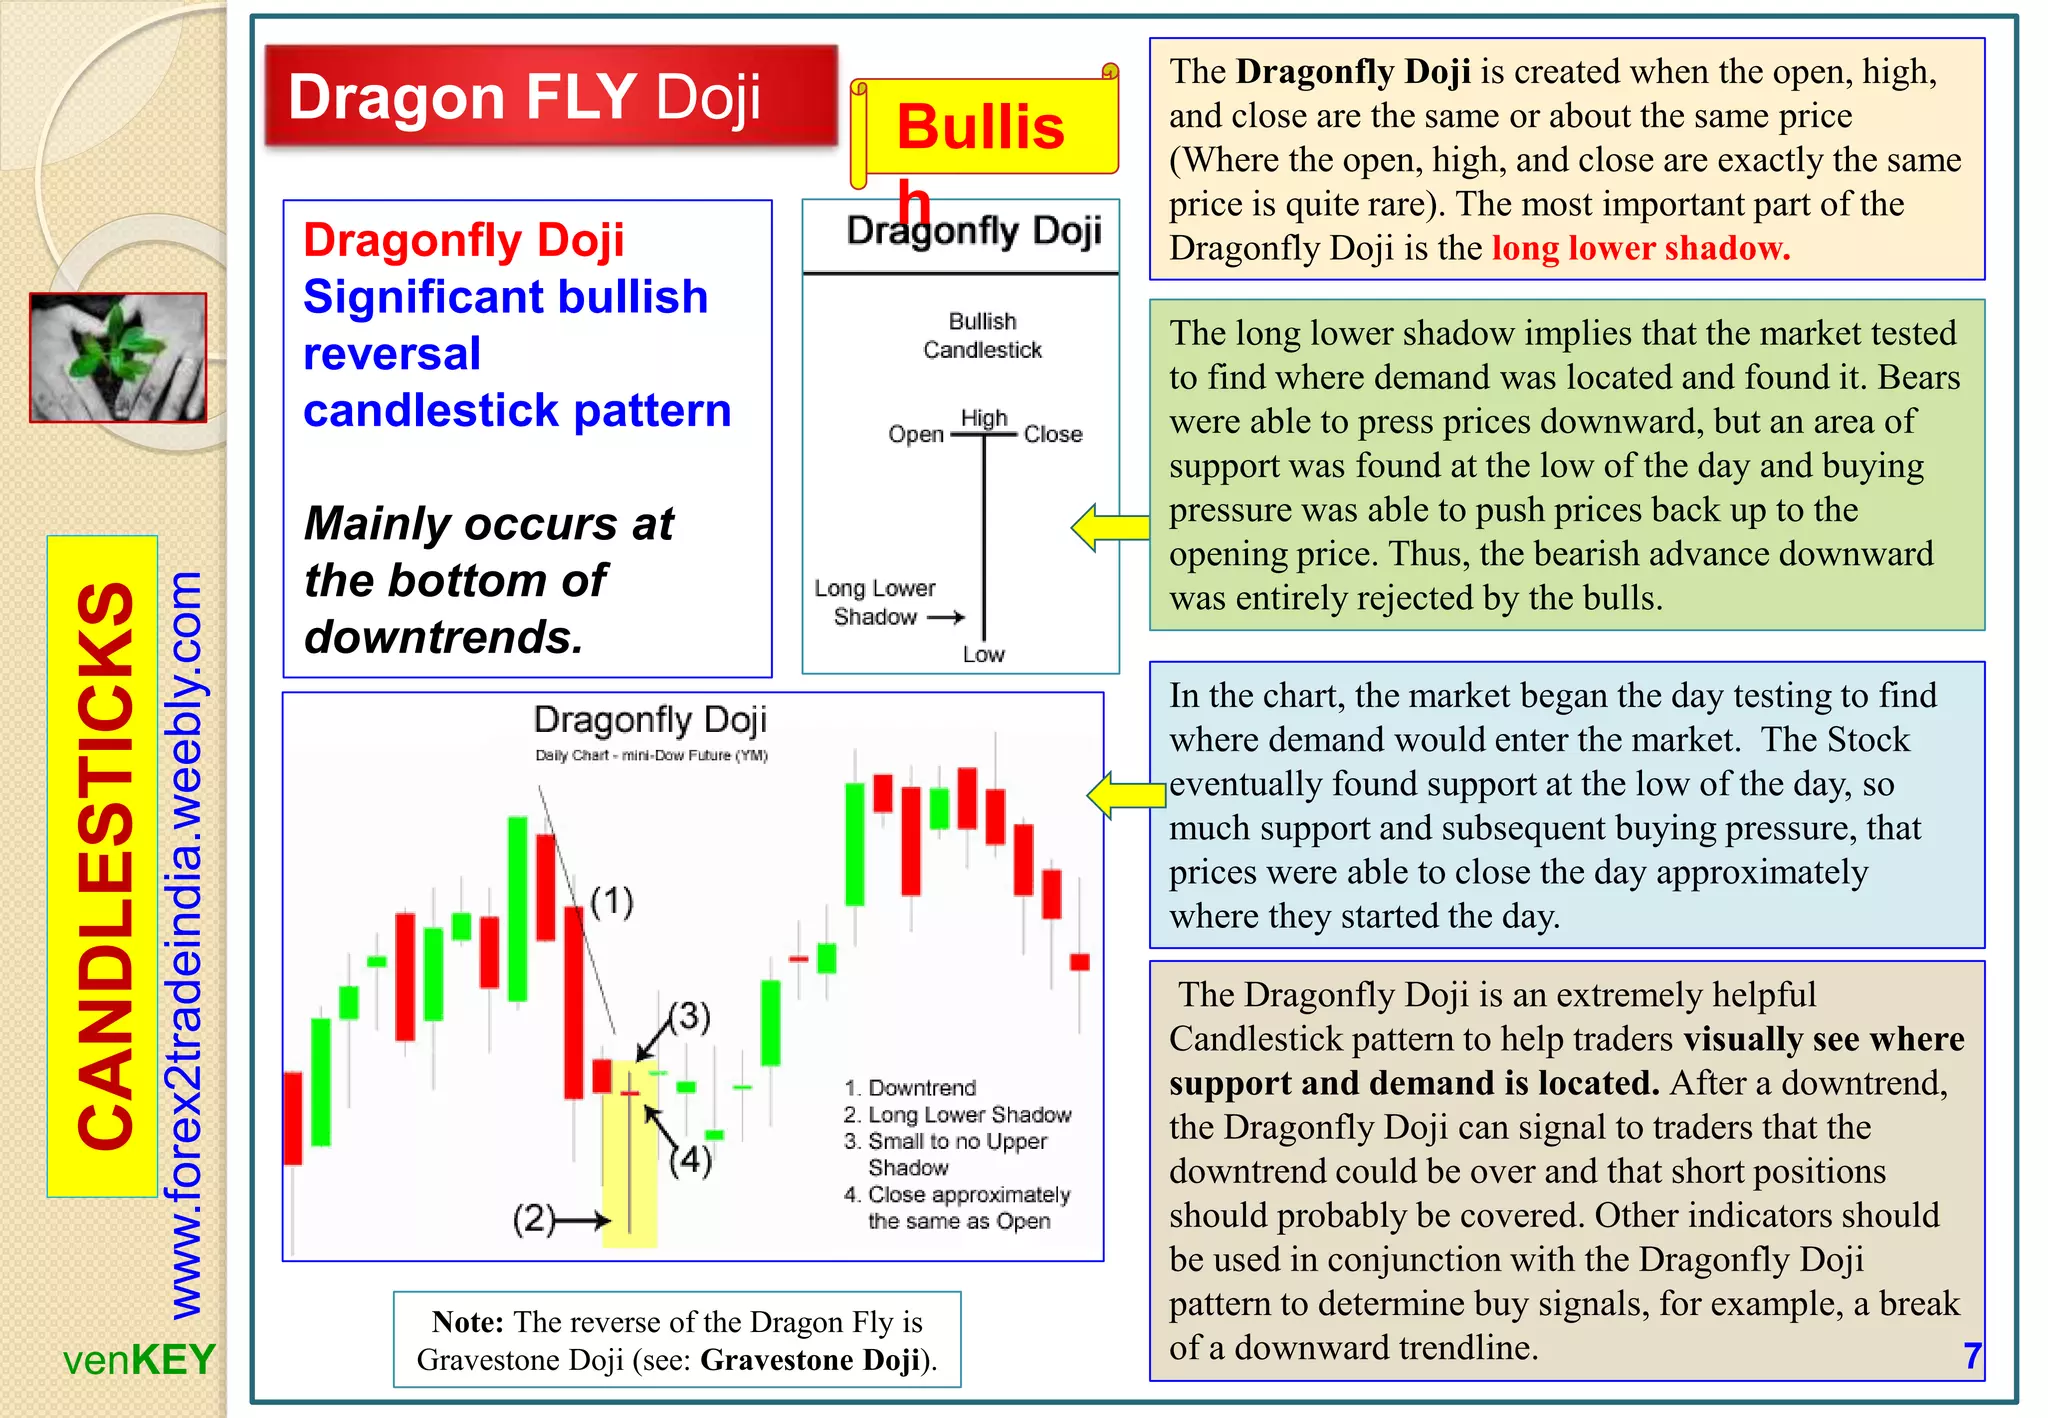
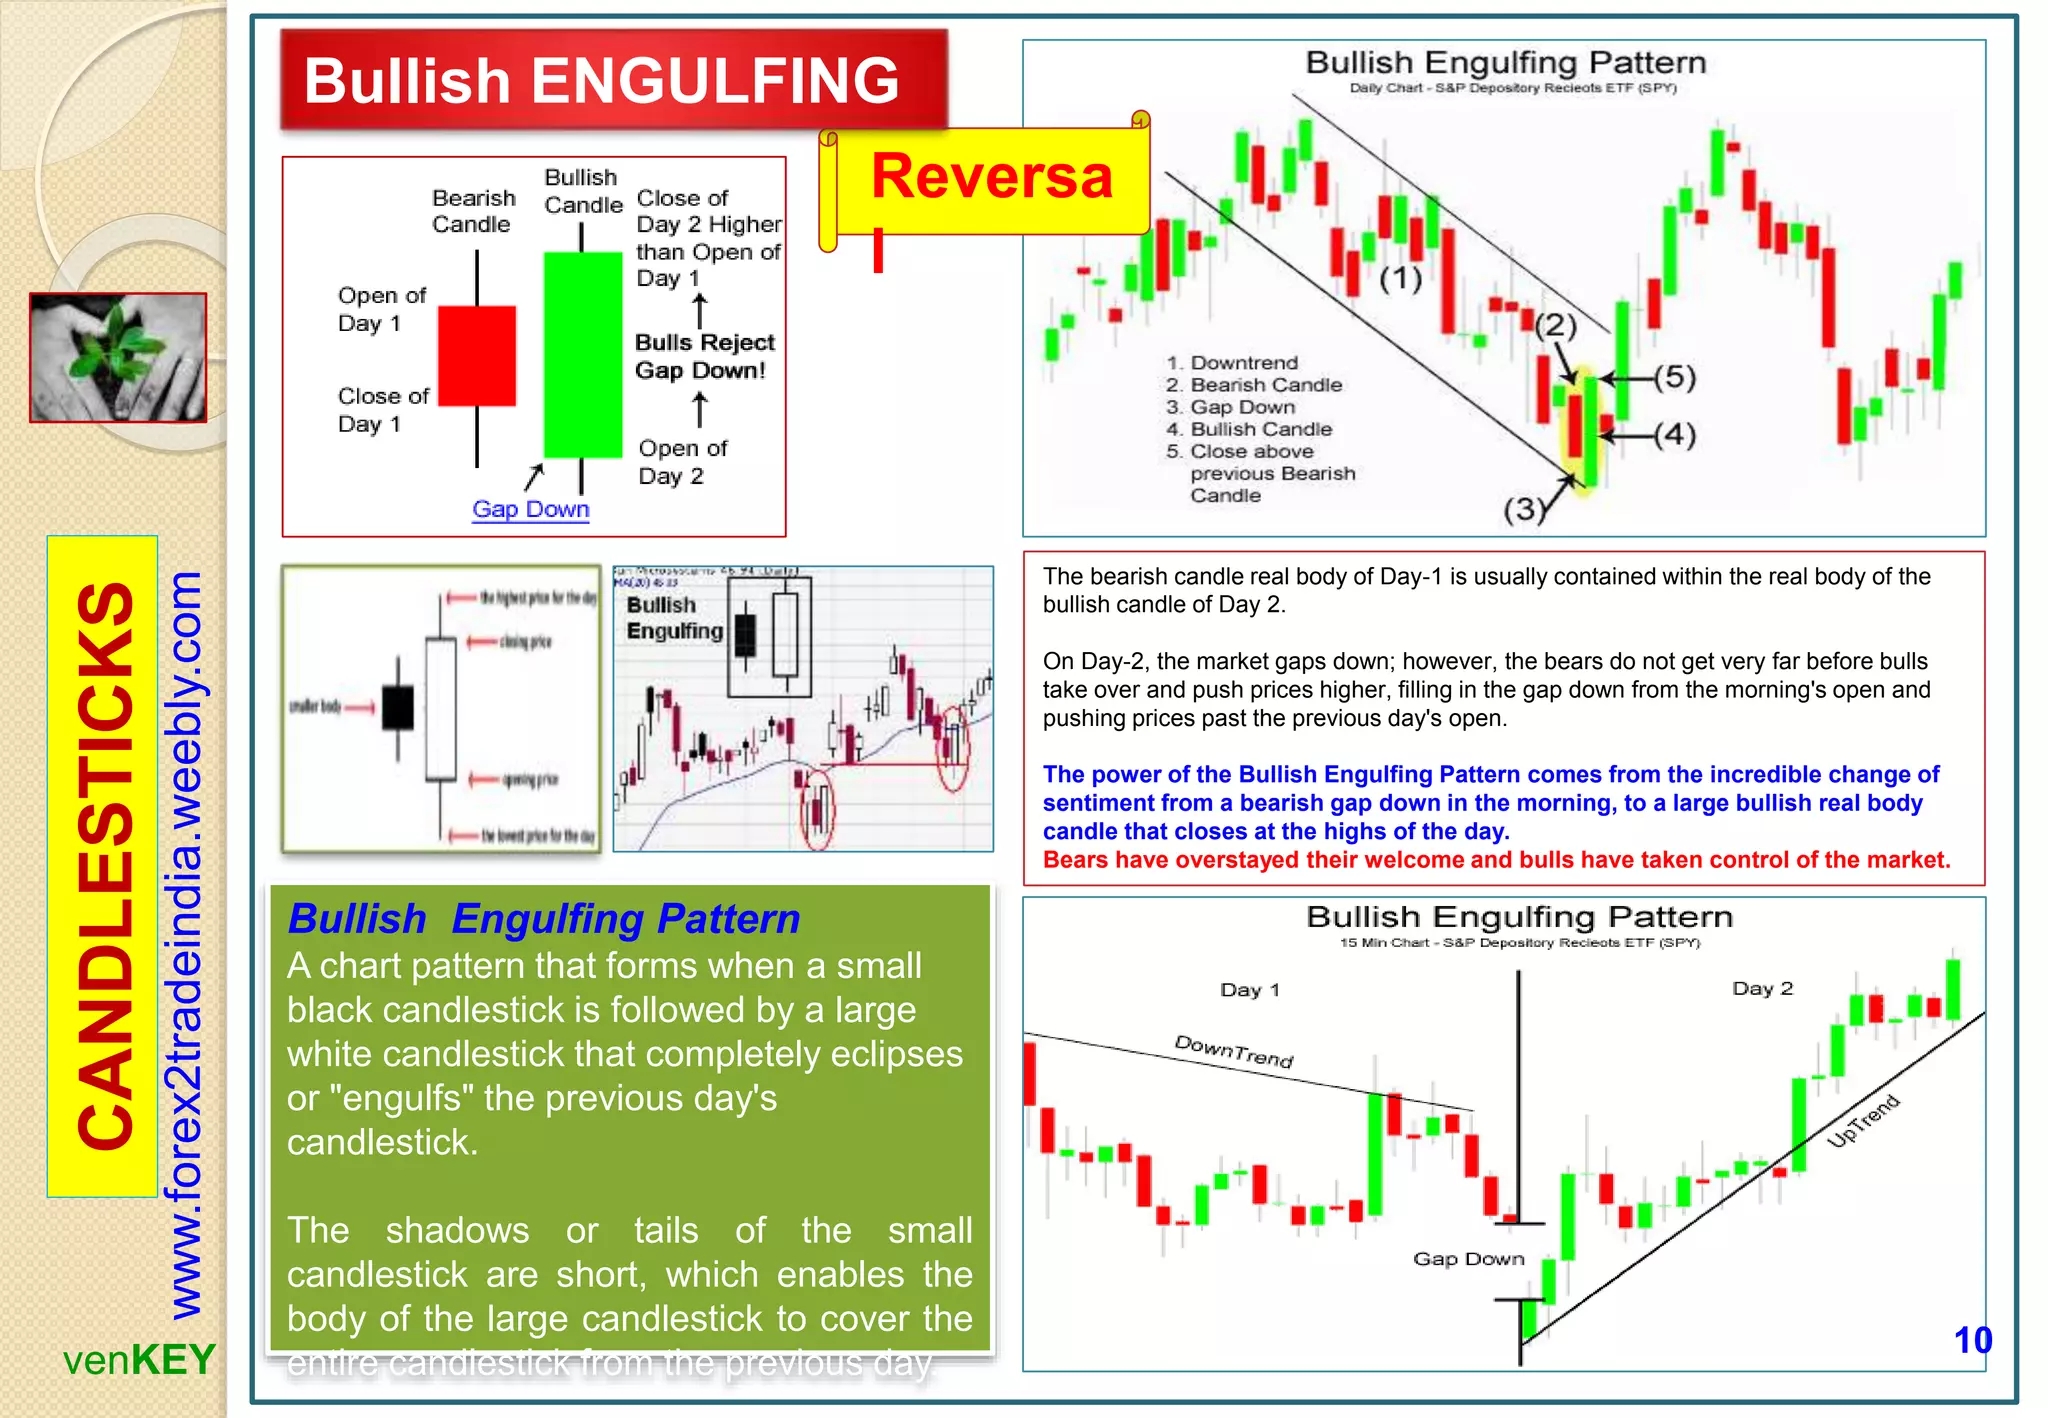
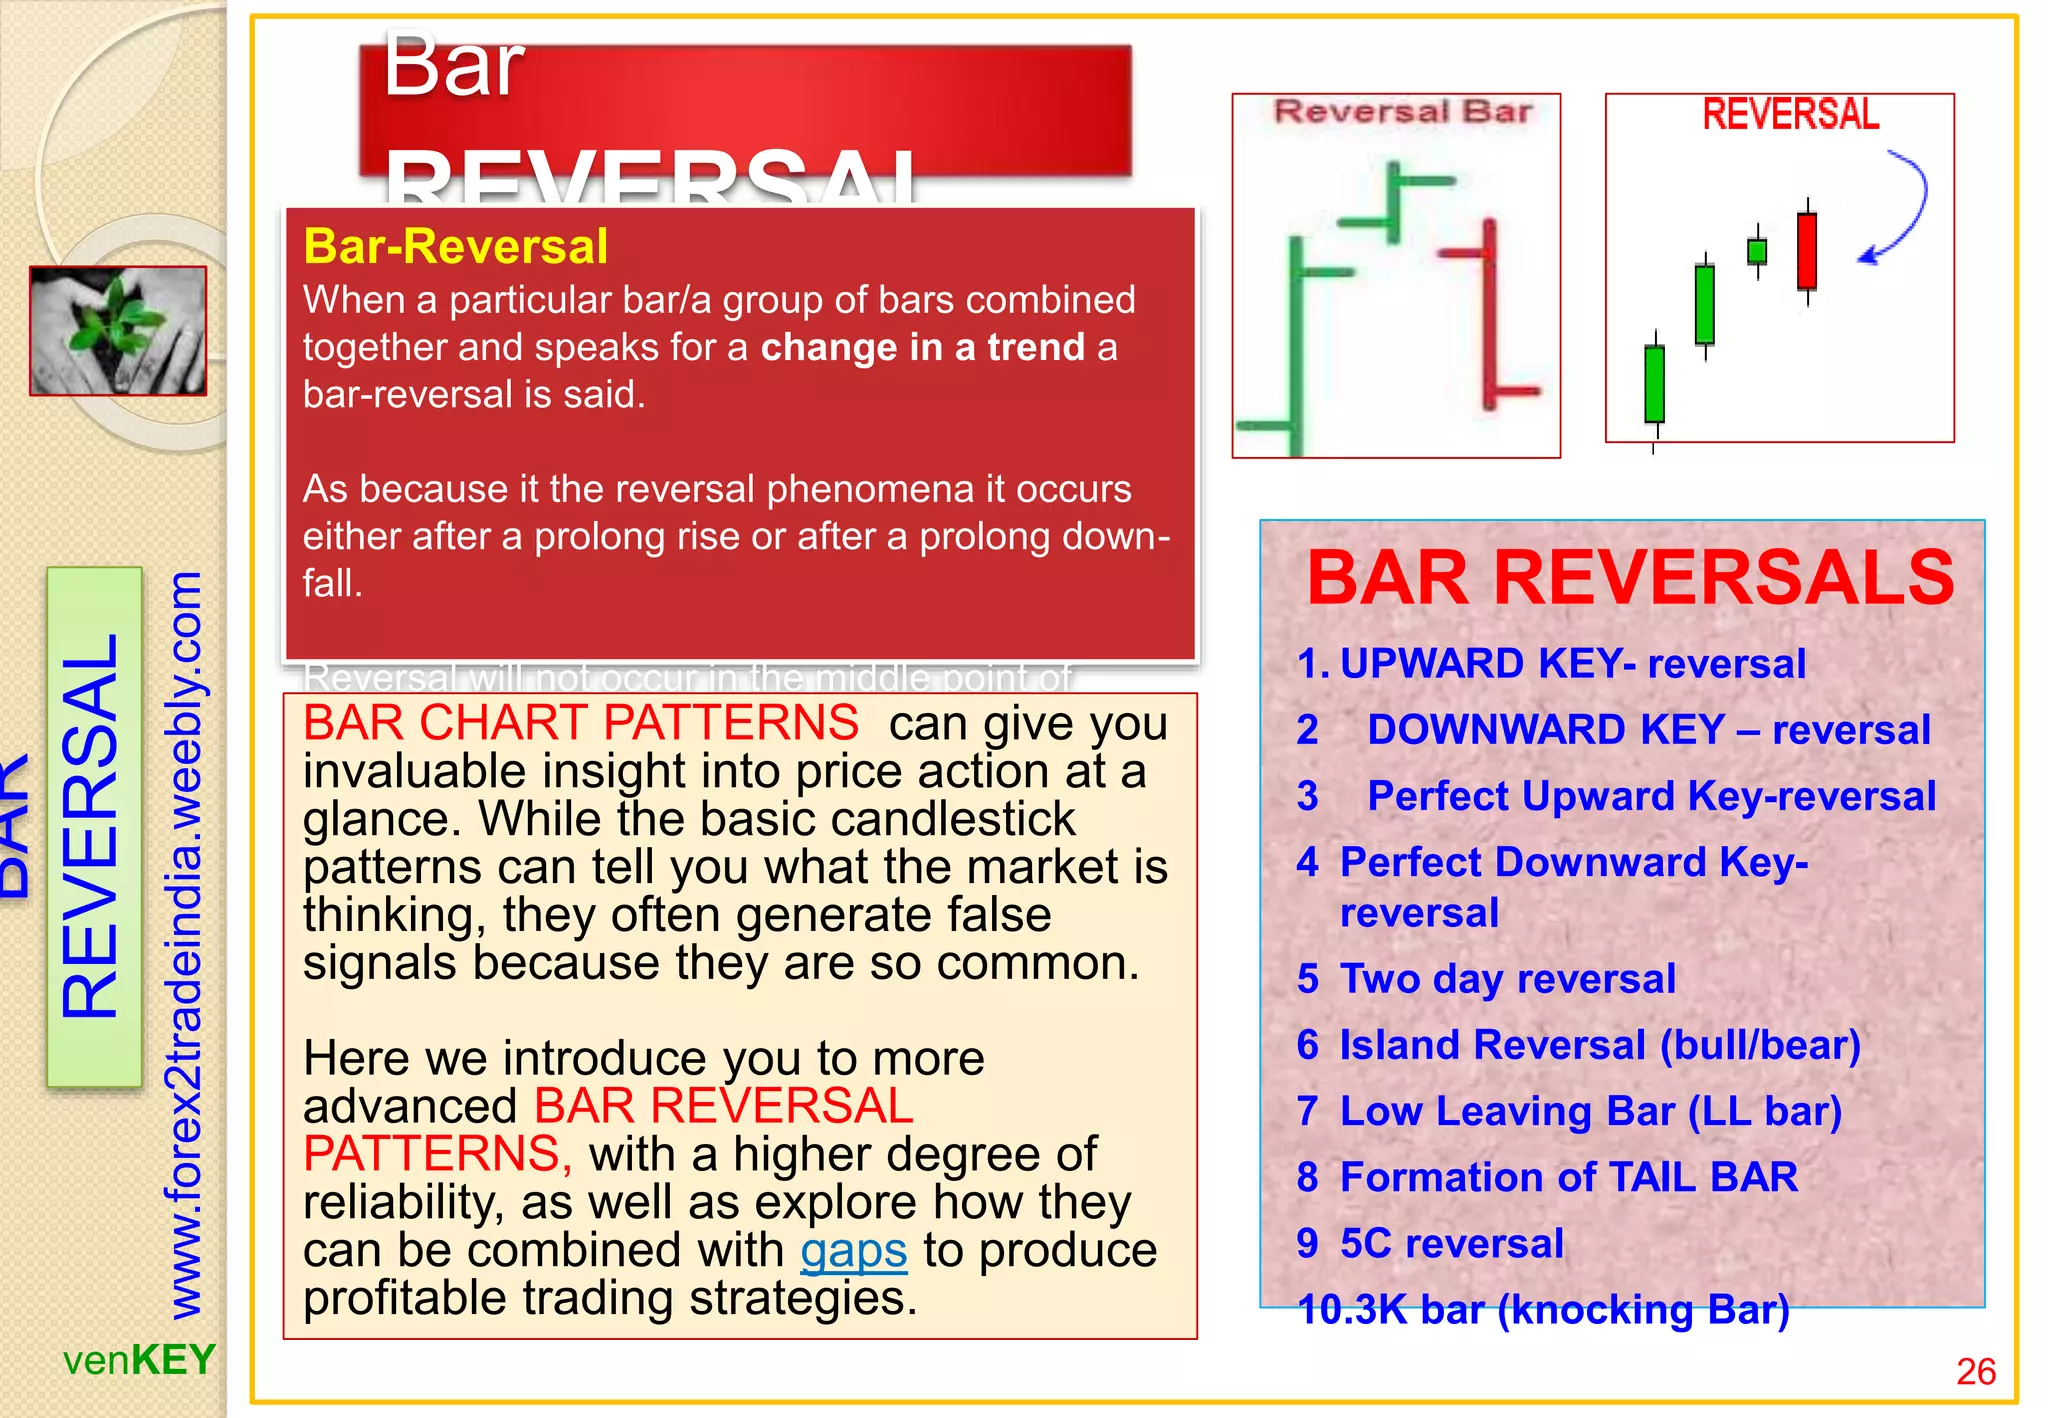
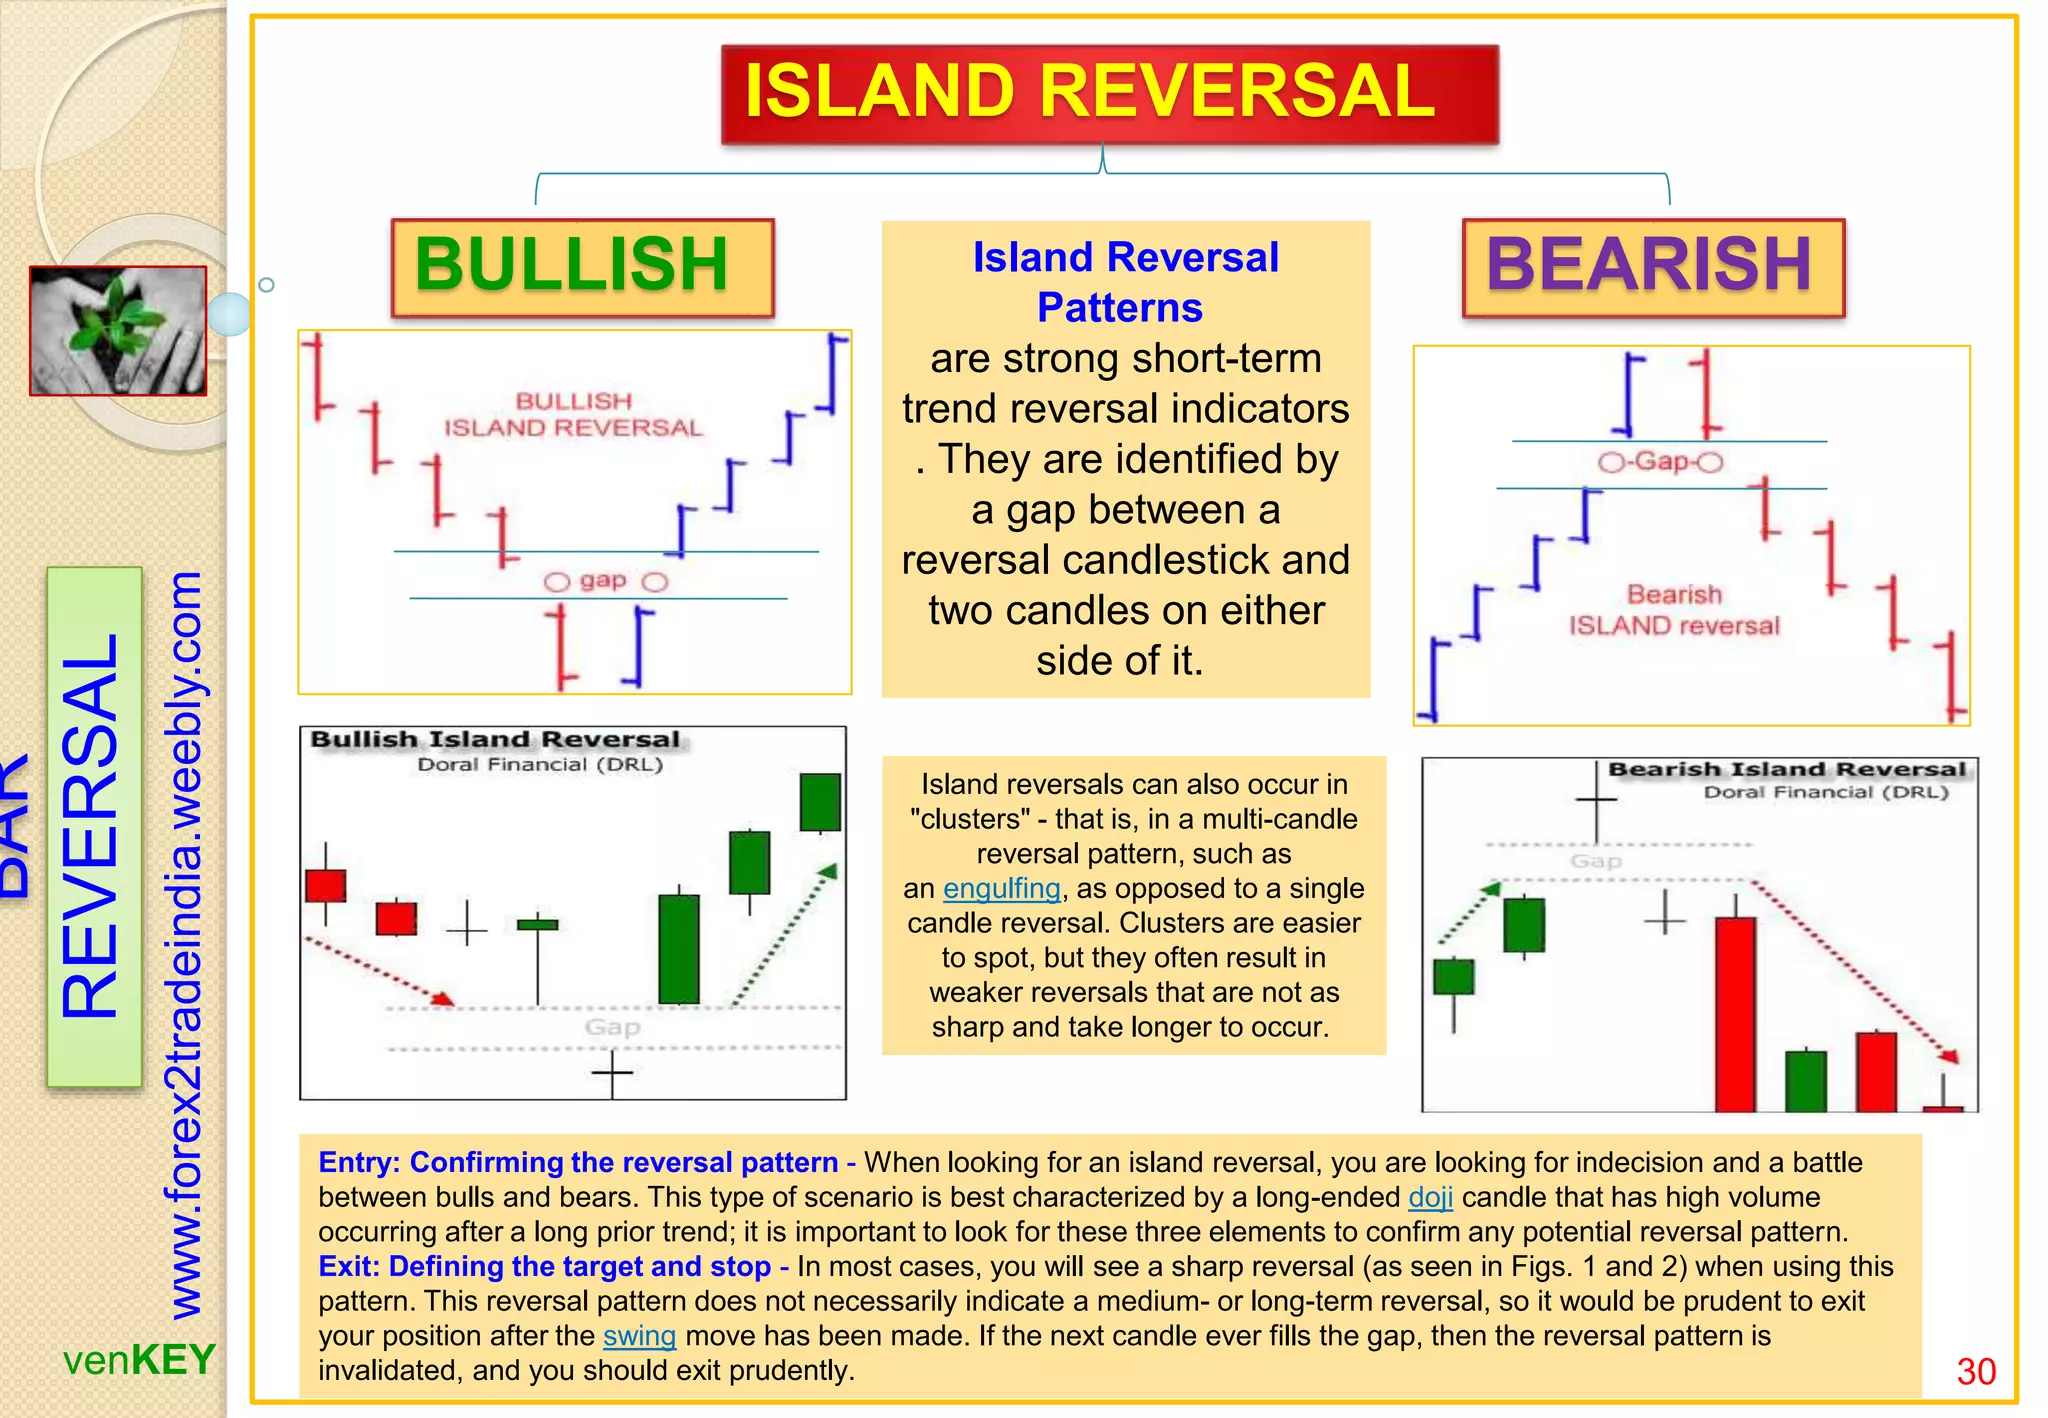
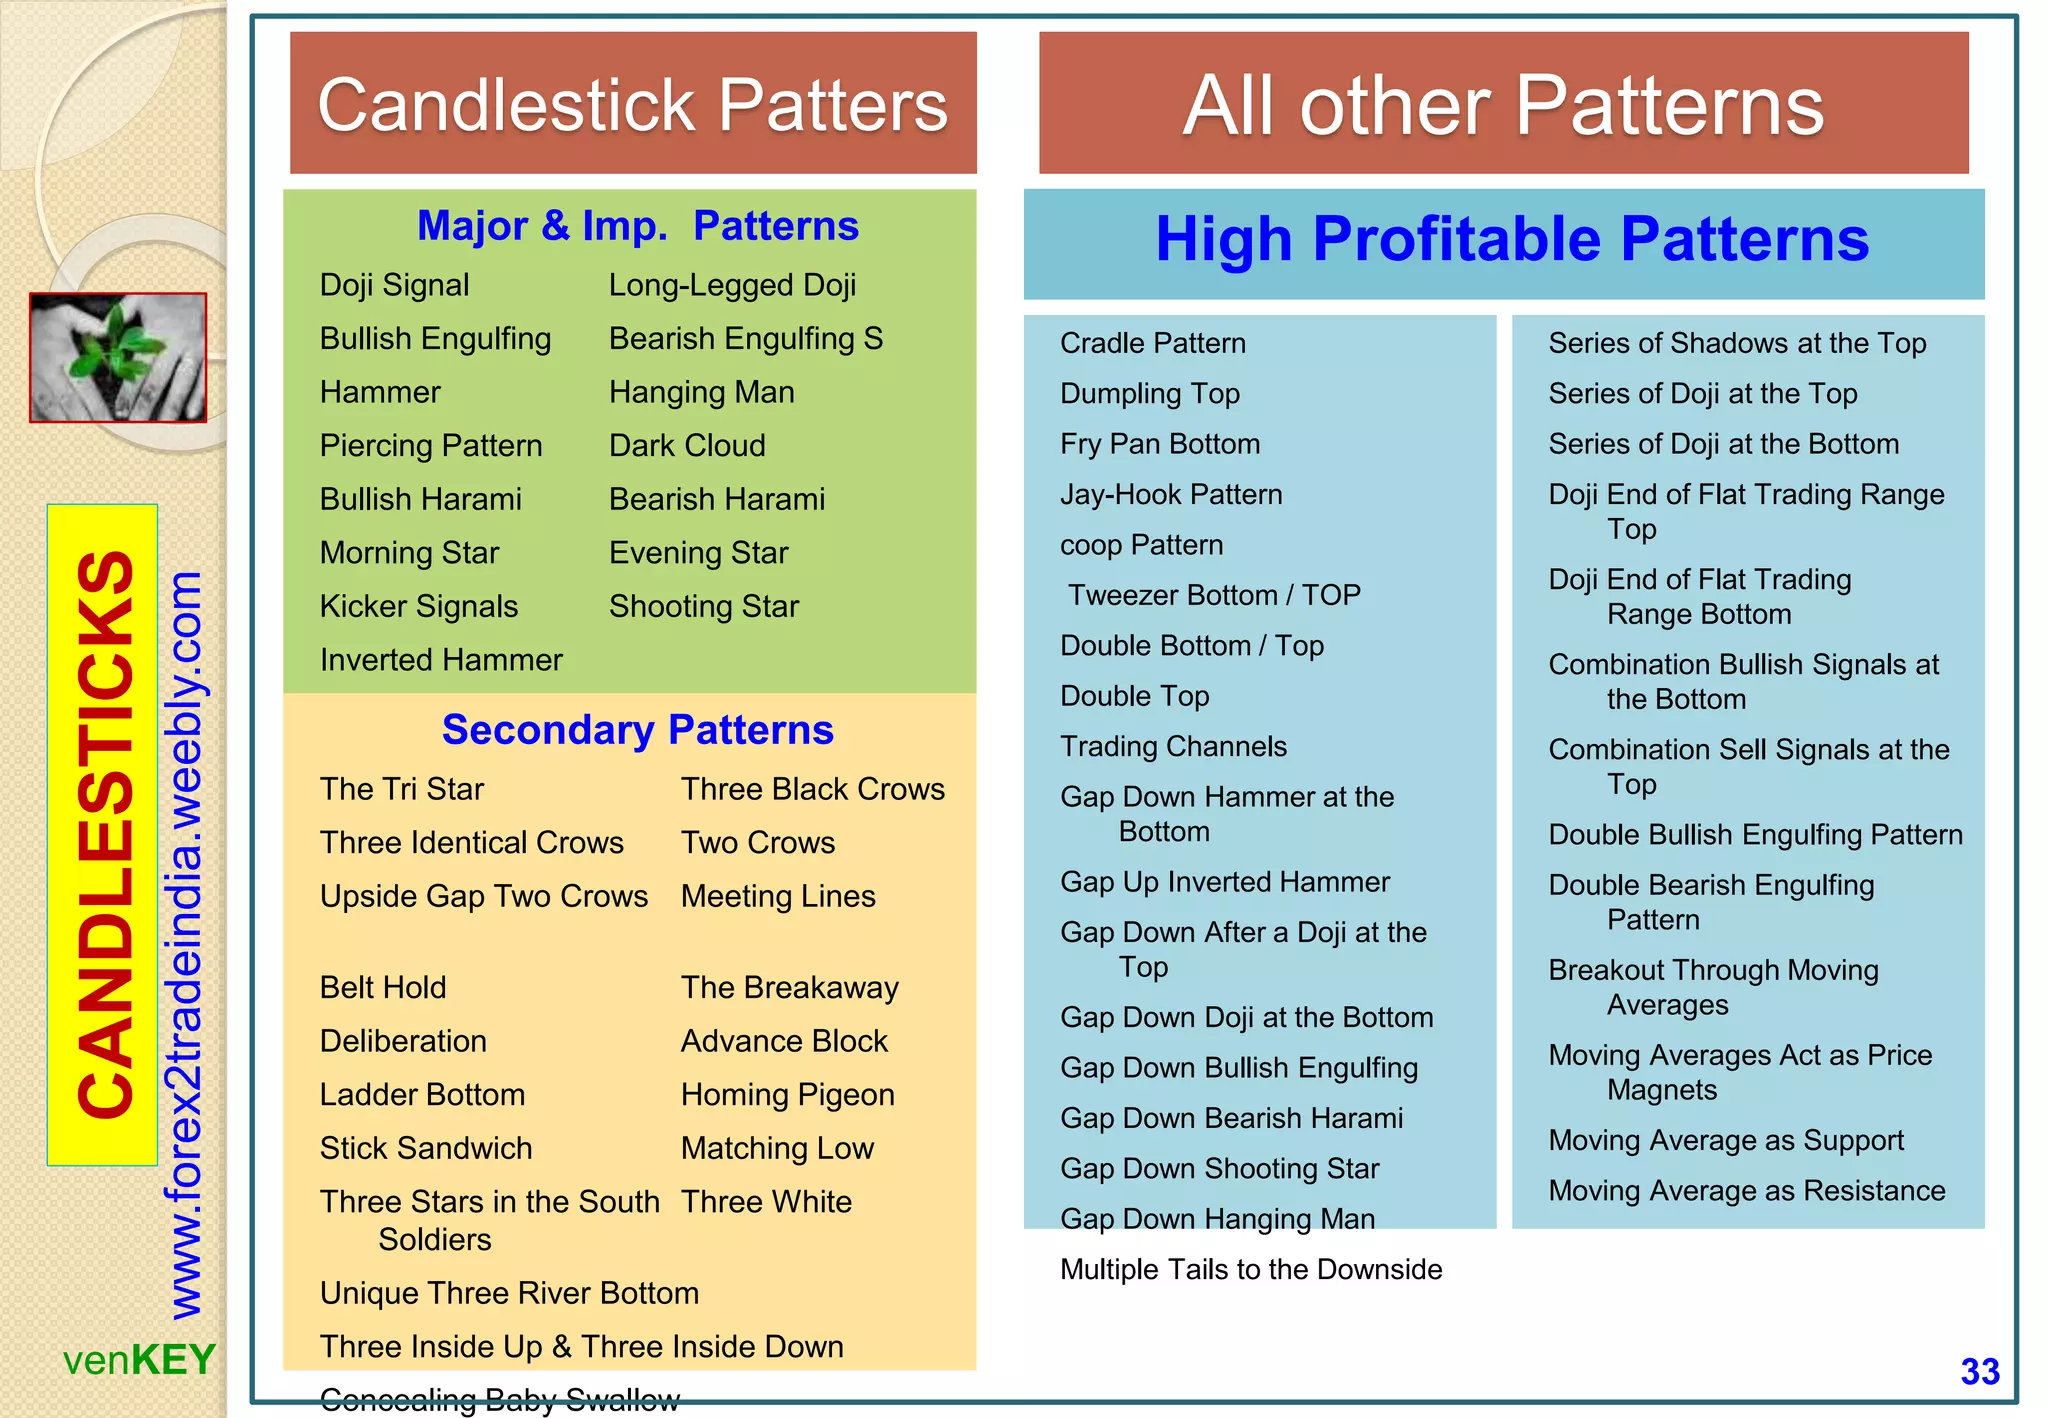
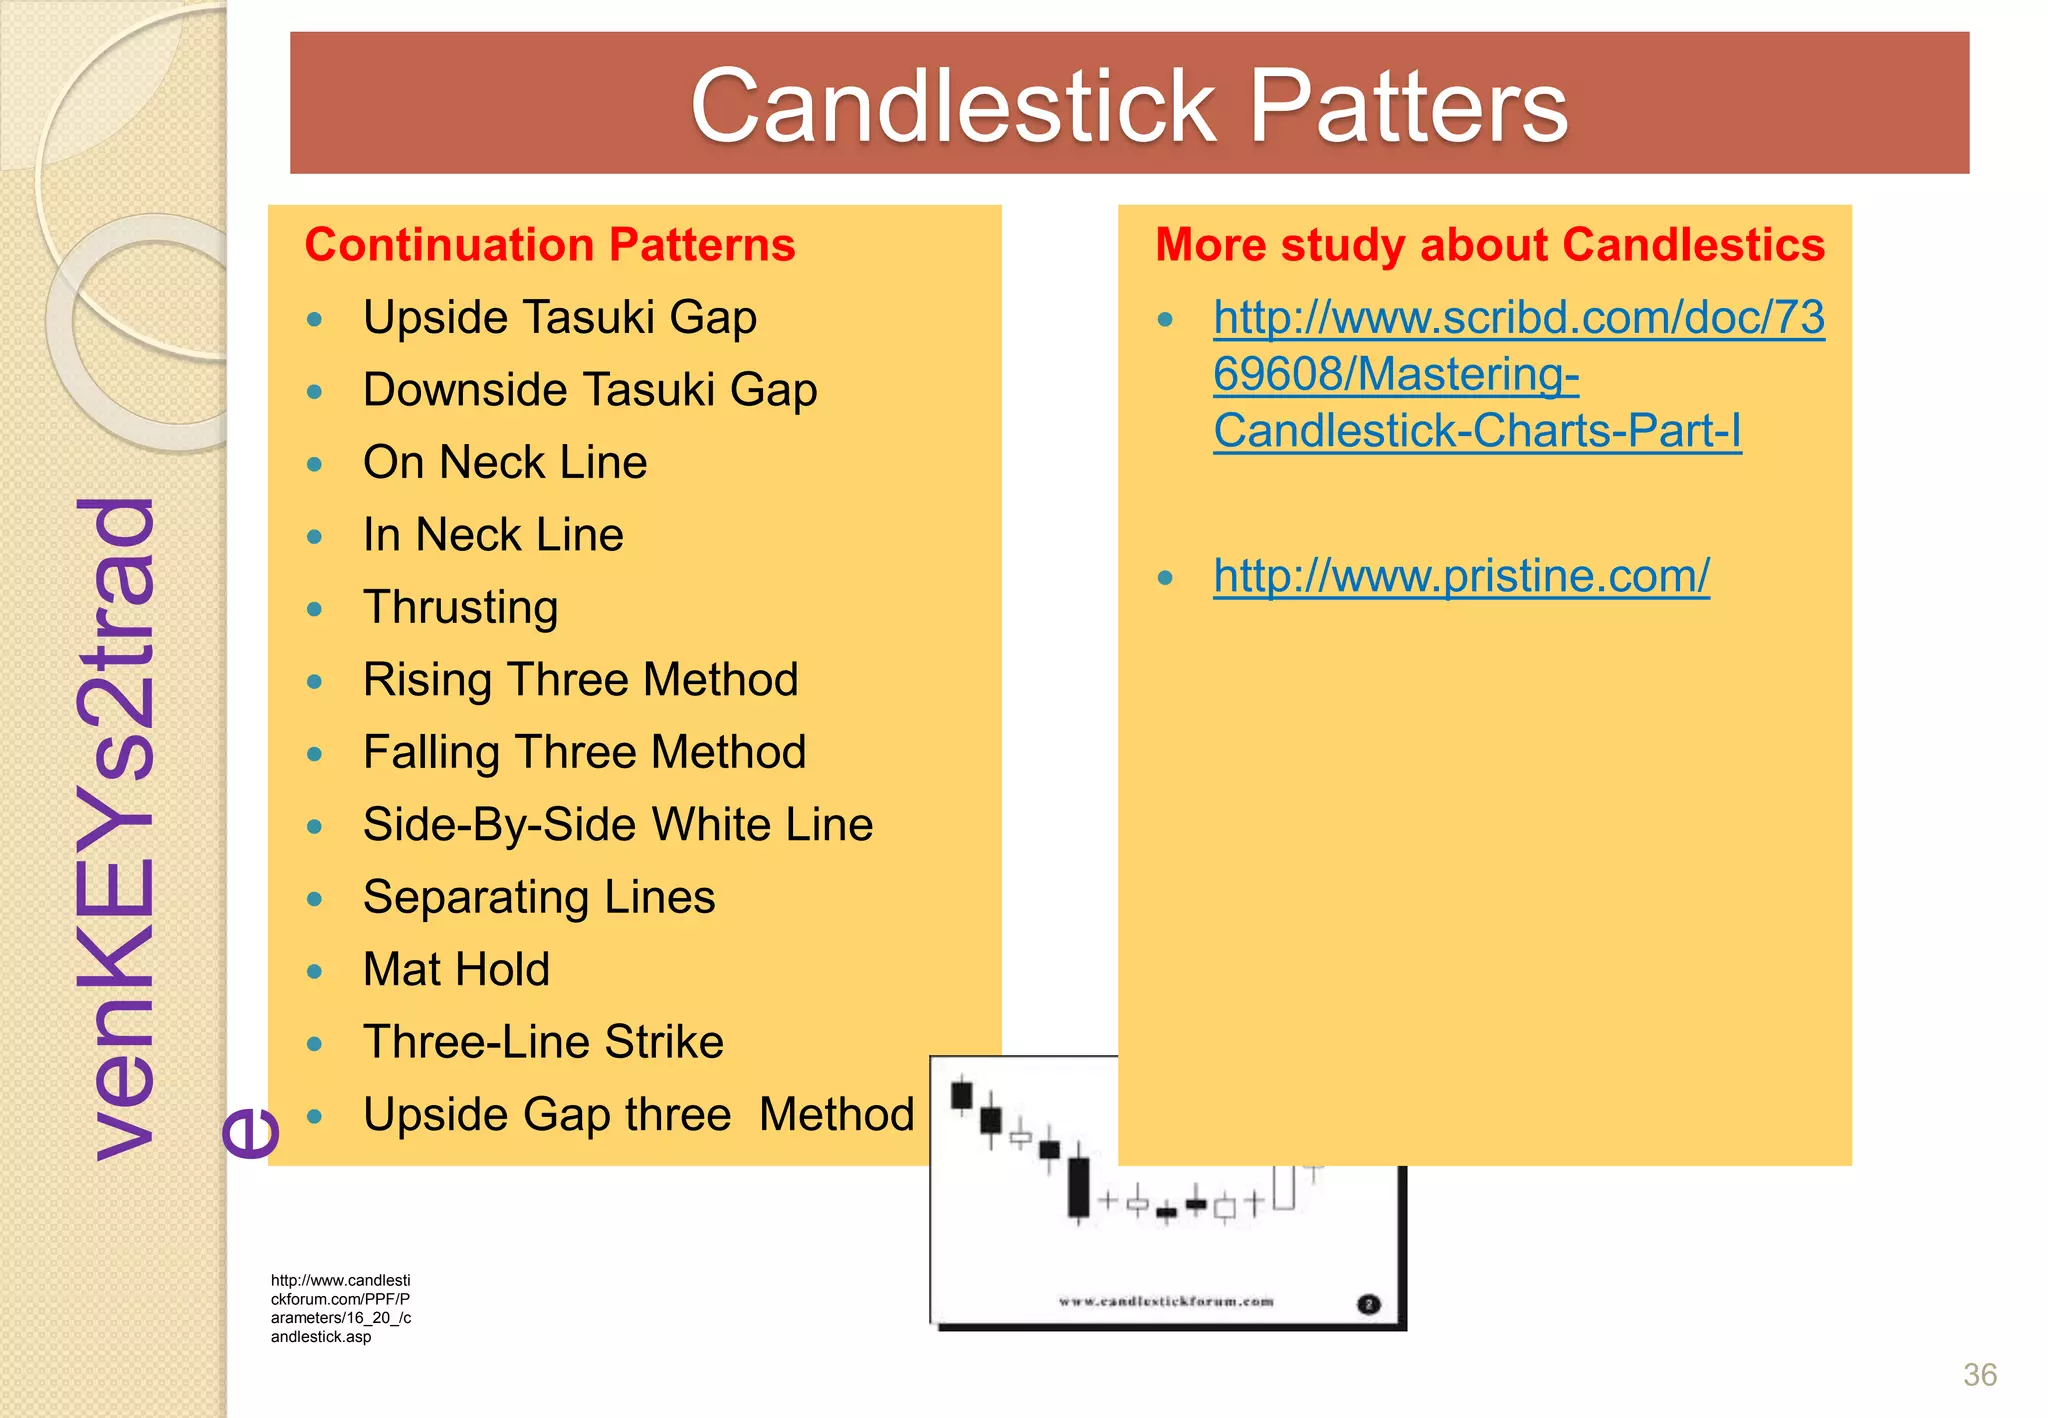
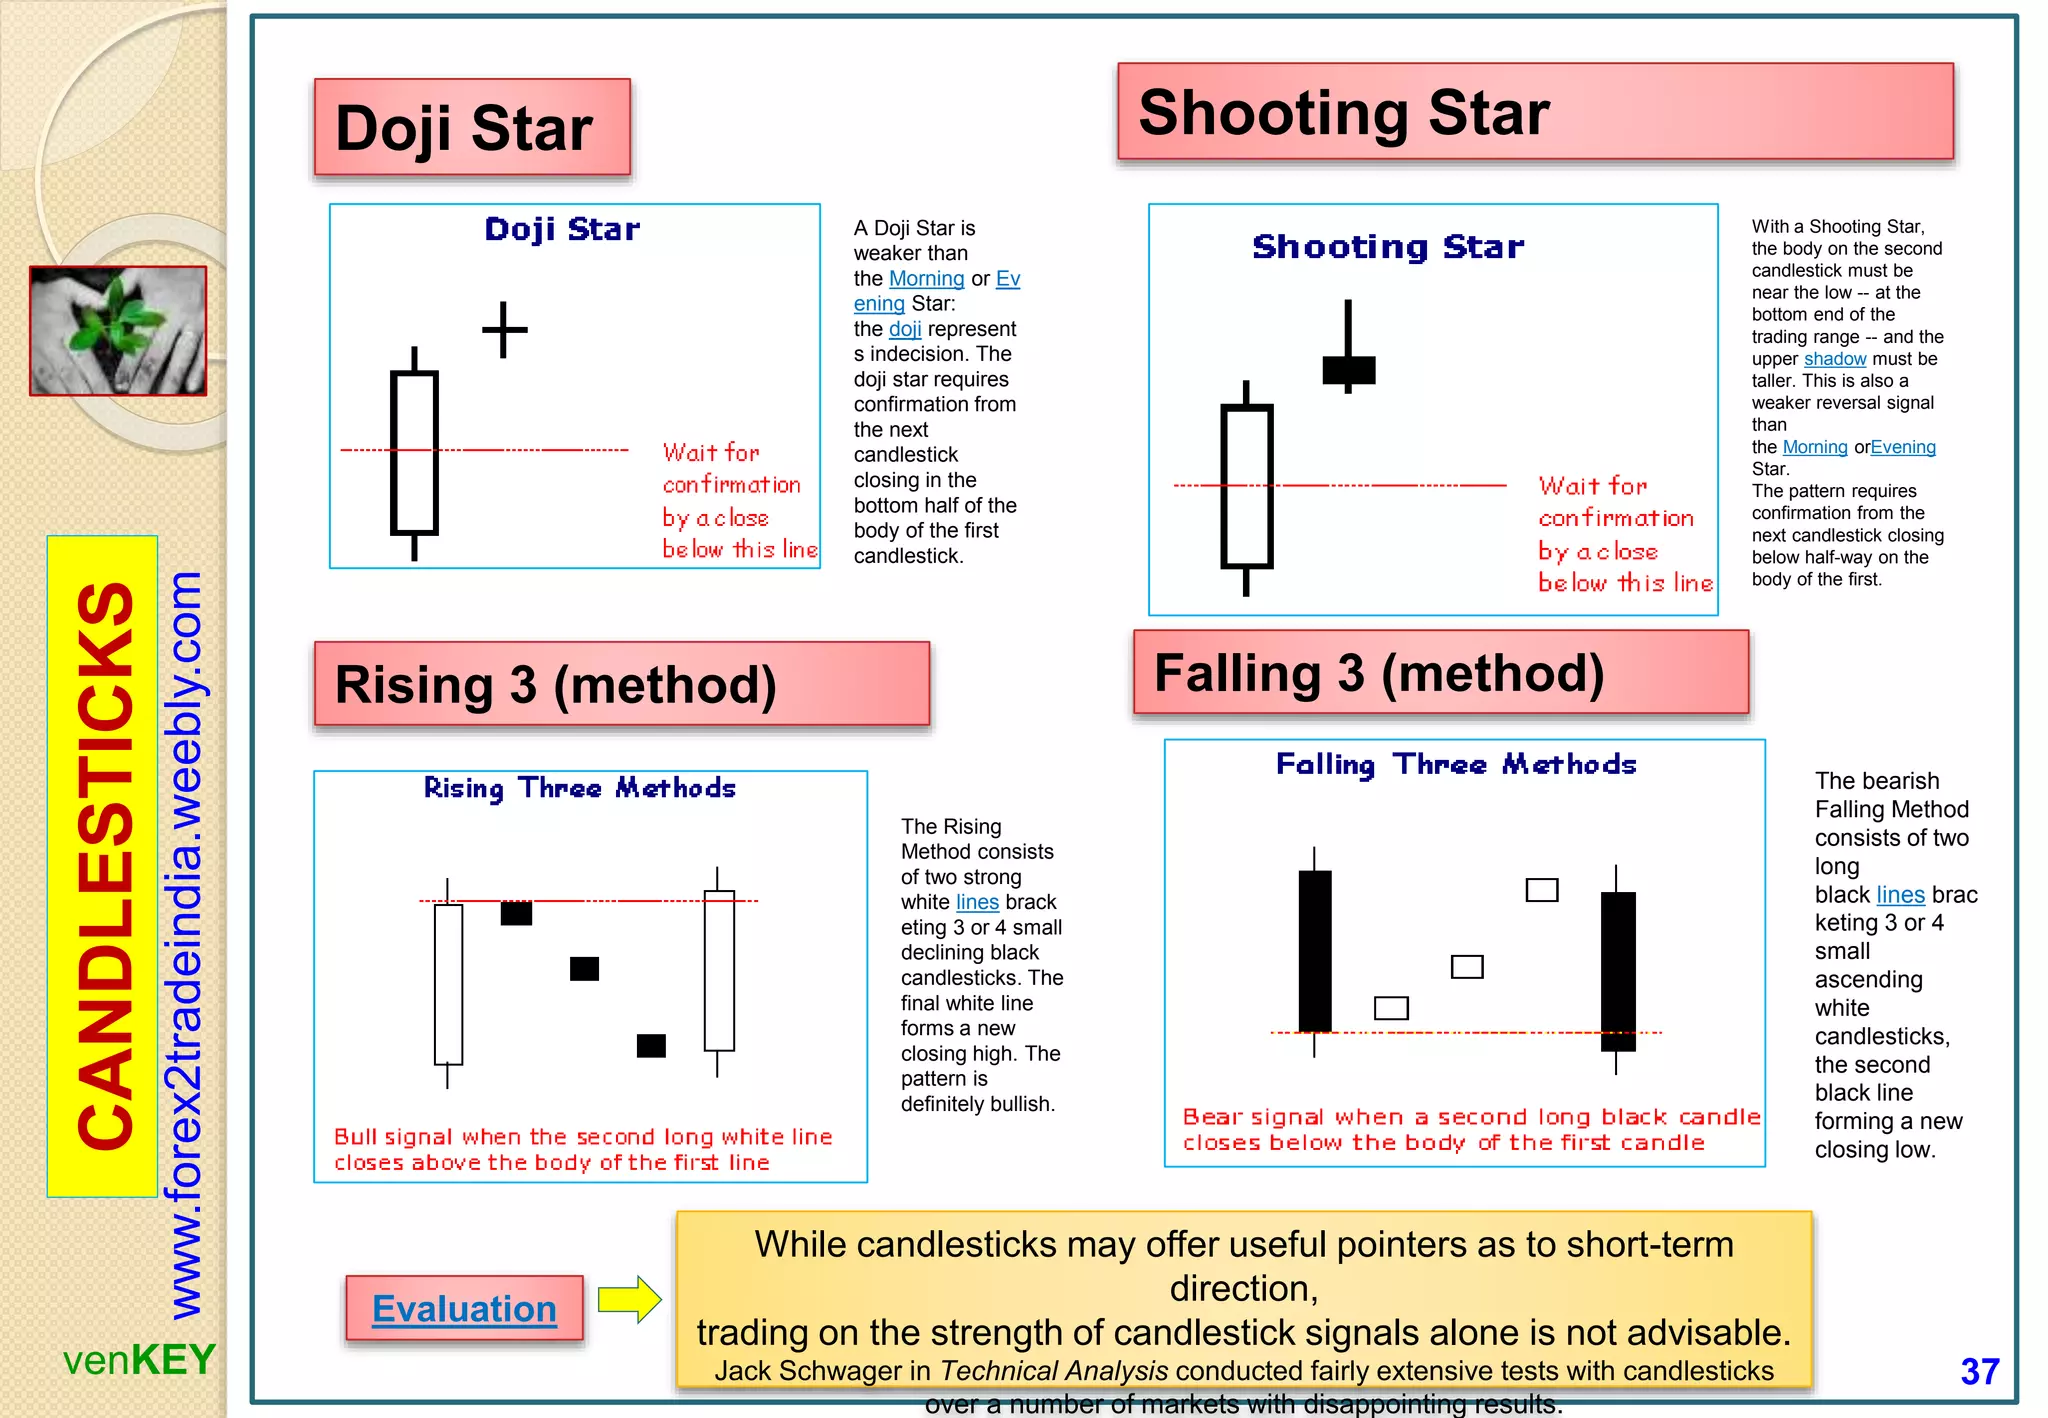
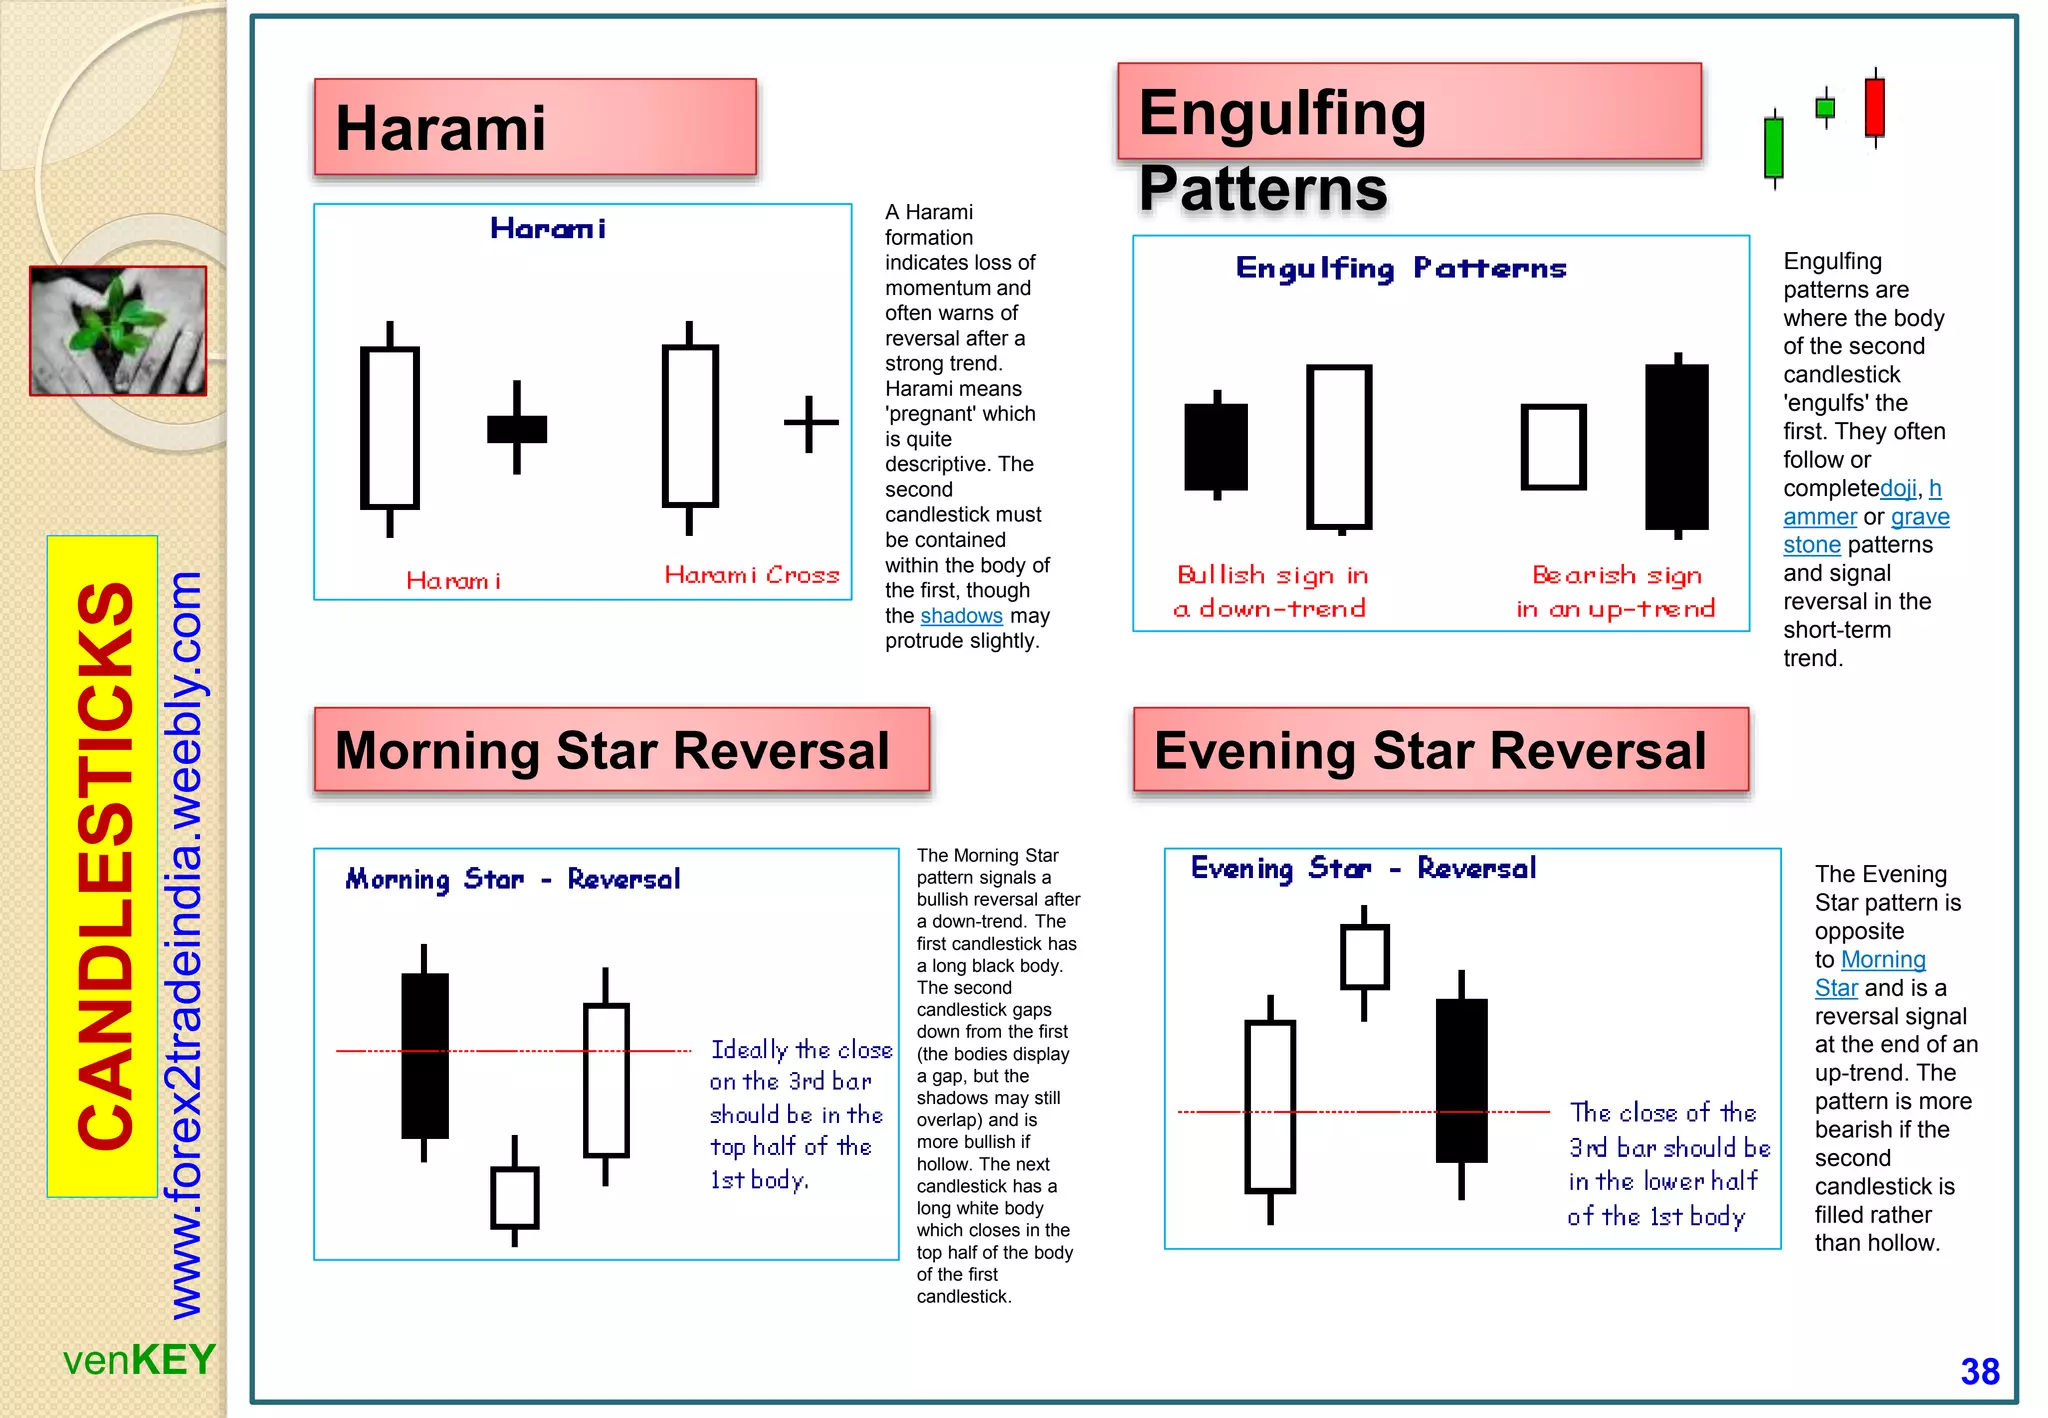
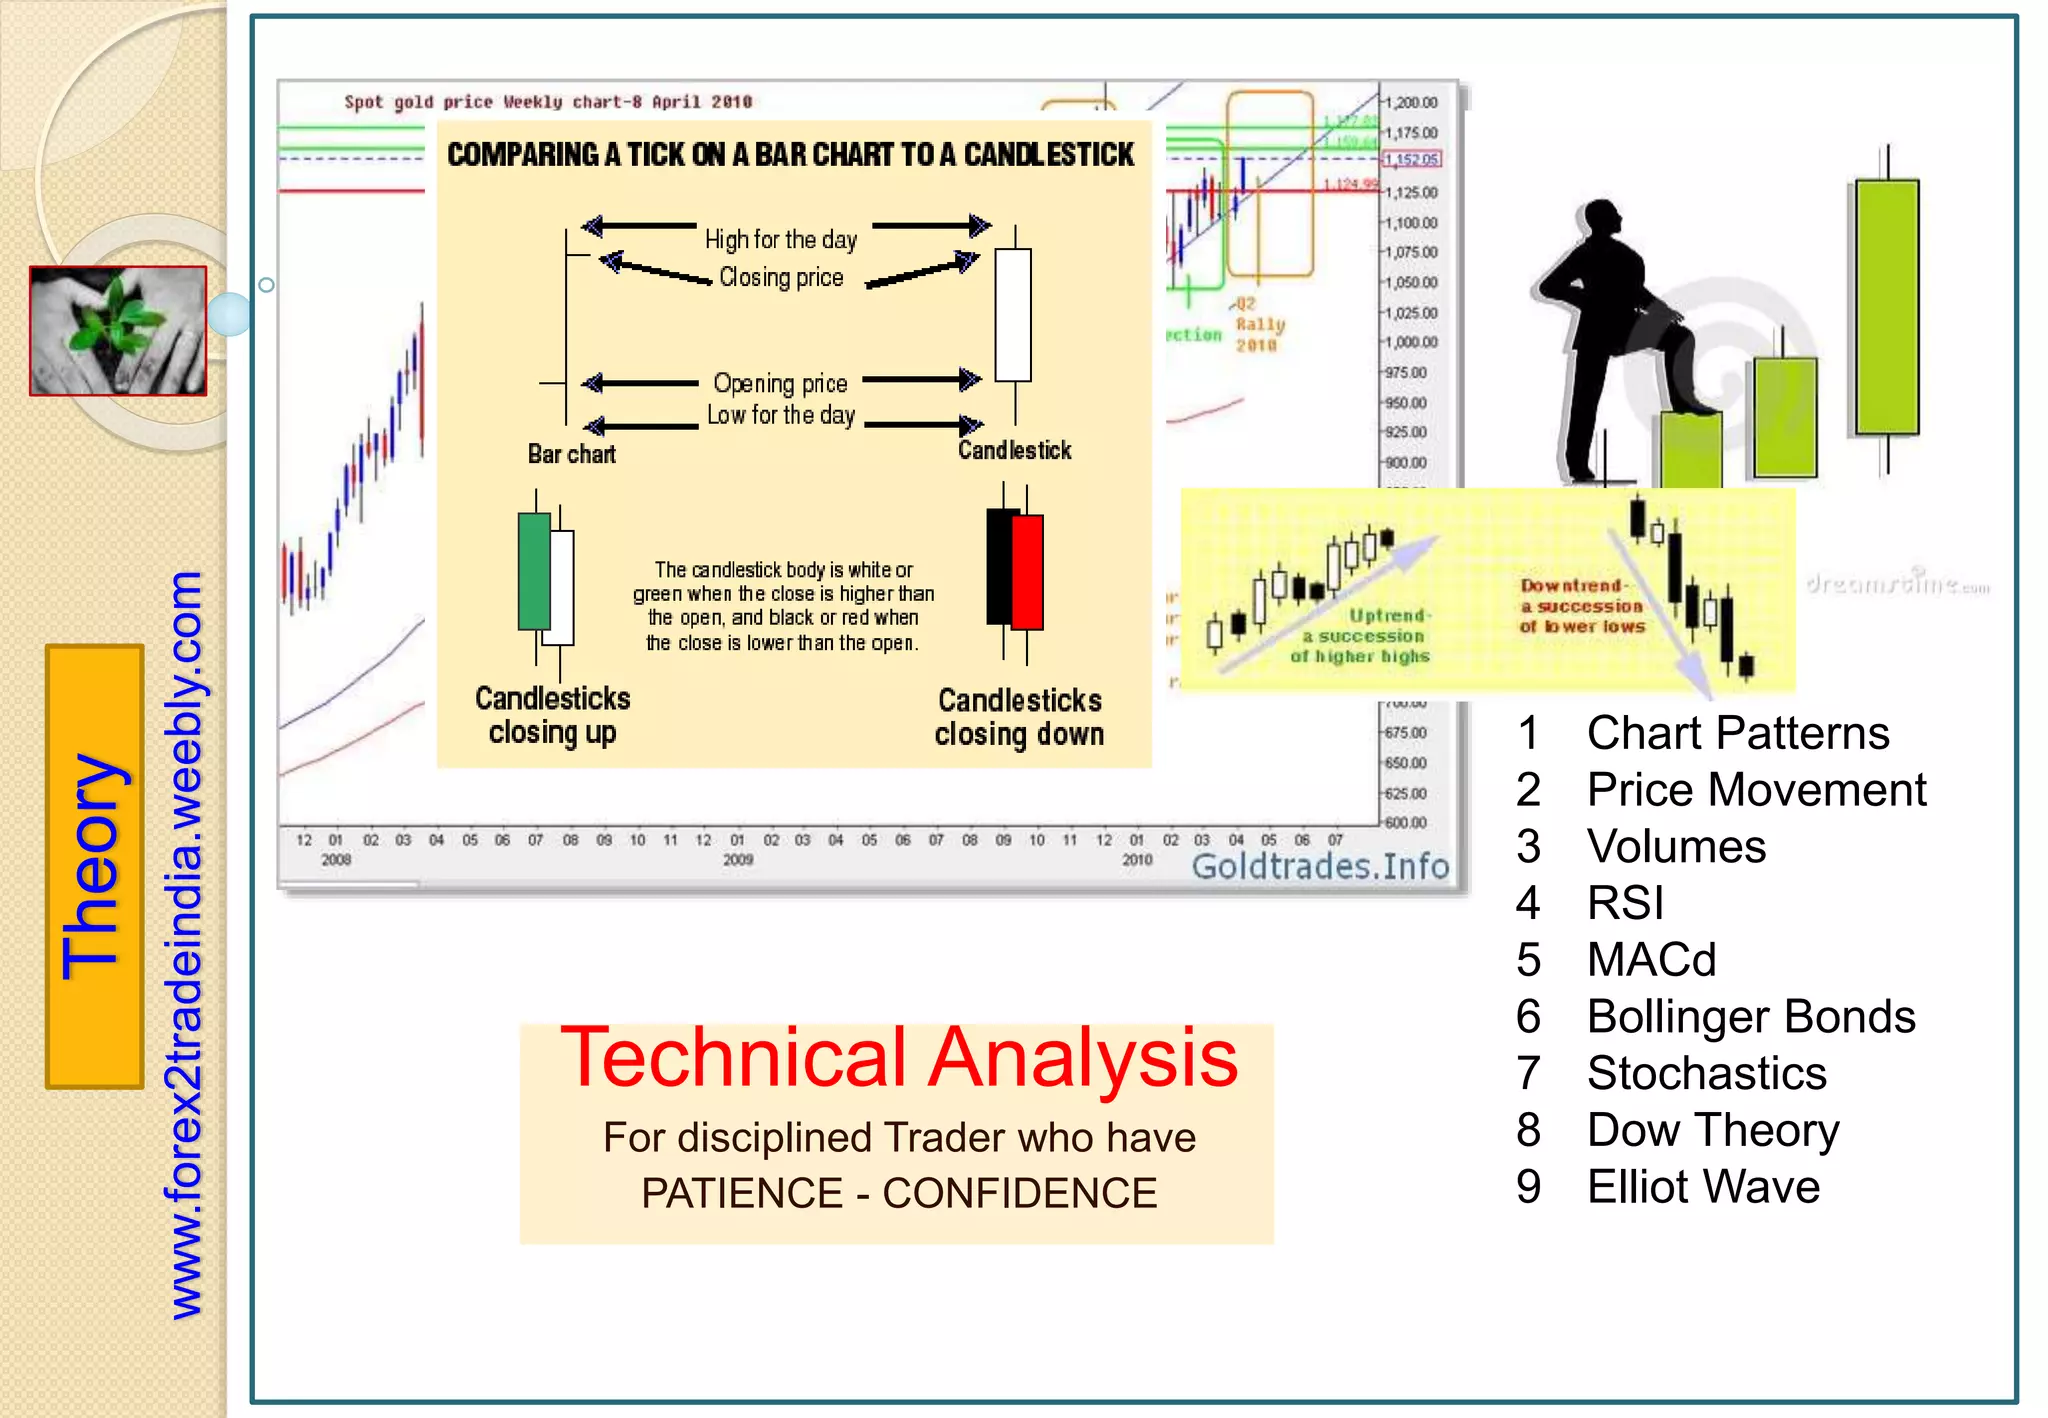
2. 1 DOJI – in style
- Doji-4 price/Longleg
- Dragon Fly Doji
- Gravestone Doji
2 Others (types)
- Spinning Tops
- Maruboji (2)
- Hammer (2)
- Hanging Man
- Shooting Star
- Engulfing (2)
- Harami (2)
- Dark Cloud Cover
- Tweezers (2)
- Windows
3 DOJI – in chart
- Morning Star
- Evening Star
- Tri-star
www.forex2tradeindia.weebly.com
This should be
Your Success
Trade
Your
EQUITY
Confirm
Watch
Technical Analysis -
CANDLESTICS
Vol. 4
100% -
67% -
50% -
38% -
0 -
Fibonacci
Levels
venKEY
CANDLESTICKS
CANDLESTIC PATTERNS
can give you invaluable insight into price action at a glance.
While the basic candlestick patterns can tell you what the
market is thinking, they often generate false signals because
they are so common.
2
3. CANDLISTICK Patterns
Candlestick Basics :
Candlestick charts are an effective way of visualizing price movements.
Candlesticks can be used for any time frame,
(whether it be one day, one hour, 30-minutes - whatever you want)
Candlesticks are used to describe price action during given time frame.
Bullish Candle: When the close is higher than the open (usually green or
white)
Bearish Candle: When the close is lower than the open (usually red or black)
Candlestick Parts (3)
Upper Shadow: The vertical line between the high of the day and the close
(bullish candle) or open (bearish candle)
Real Body : The difference between the open and close; colored portion
of the candlestick
Lower Shadow: The vertical line between the low of the day and the open
(bullish candle) or close (bearish candle)
Candlestick Patterns :
The power of Candlestick Charts is with multiple candlesticks forming reversal
and continuation patterns.
Bearish 3
Bearish Harami
Bearish Harami
Cross
Big Black Candle
Big White Candle
Black Body
Bullish 3
Bullish Harami
Bullish Harami
Cross
Dark Cloud Cover
Doji
Doji Star
Engulfing Bearish
Line
On Neck-Line
Piercing Line
Rising Window
Separating Lines
Shaven Bottom
Shaven Head
Shooting Star
Spinning Top
Three Black
Crows
Three White
Soldiers
Tweezer Bottoms
Tweezer Tops
White Body
Evening Doji Star
Evening Star
Falling Window
Gravestone Doji
Hammer
Hanging Man
Inverted Black
Hammer
Inverted Hammer
Long Legged Doji
Long Lower
Shadow
Long Upper
Shadow
Morning Doji Star
Morning Star
The Japanese have been using
candlestick charts since the 17th
century to analyze rice prices.
Candlesticks were introduced into
modern technical analysis by Steve
Nison in his book Japanese
Candlestick Charting Techniques.
www.forex2tradeindia.weebly.com
venKEY
CANDLESTICKS
3
4. No. of
Bars
Name Type Look Like
1
BAR
Hammer
Hanging Man
Reversal
Signal
1
BAR
Inverted
Hammer
Shooting
Star
Bearish
Reversal
1 or 2
BAR
Spinning
TOPS
Probable
Reverse
2
BAR
S
Windows
(Gaps)
Probable
Down
Trend
2
Bars
Bearish
Engulfin
g
Trend
Reversal
No. of
Bars
Name Type Look Like
1
BAR
- Doji
-Long leg
-4price doji
Neutral
In trend
reversal
1
BAR
Dragon
Fly
Trend
Reversa
l
1
BAR
Grave
Stone doji
Trend
Reversa
l
1
BAR
Marubozu Trend
Reversa
l
2
Bars
Bullish
Engulfing
Trend
Reversa
l
CANDLESTICK (Quick View- 1)
http://en.wikipedia.org/wiki/Candlestick_pattern, http://www.onlinetradingconcepts.com/
www.forex2tradeindia.weebly.com
venKEY
CANDLESTICKS
4
5. No. of
Bars
Name Type Look Like
2
Bars
Bearish
Harami
Reversal
2
Bars
Bullish
Harami
Reversal
2
Bars
Bearish
Harami
Cross
Probable
Reversal
2
Bars
Bullish
Harami
Cross
Probable
Reversal
2
Bars
Twin
TOWERS
(Tweezers)
Probable
Reverse
No. of
Bars
Name Type Look Like
2
Bars
Piercing
Line
Reversa
l
2
Bars
Dark
Cloud
Cover
Trend
Reversa
l
More
Bars
Morning
STAR
Trend
Reversa
l
More
Bars
Evening
STAR
More
Bars
Tri-
STAR
Star
Trend
Reversa
l
http://en.wikipedia.org/wiki/Candlestick_pattern,
http://www.daytradersbulletin.com/html/cs1.html
CANDLESTIC (Quick View- 2)
www.forex2tradeindia.weebly.com
venKEY
CANDLESTICKS
5
www.forex2tradeindia.weebly.com
6. DOJI & other
Styles
(1) 4-price Doji (-)
(2) Doji (+)
(3) Long legged Doji
Signifies Indecision
between Bulls & Bears.
These (3) candle formats :
are more helpful in
deciding trend / trend
reversals
• A Doji is quite often found at
the bottom and top of
trends and thus is
considered as a sign of
possible reversal of price
direction,
• Doji can be viewed as a
continuation pattern as
well (some times)
1) Doji is formed only when opening price & closing price are equal.
2) Long-legged Doji, (Rickshaw Man) except the upper & lower shadows are much longer than Doji.
3) 4-Price Doji is formed when the OHLC (Open, High, Low, Close) are equal.
Doji represents indecision. After the open, bulls push prices higher only for prices to be rejected and
pushed lower by the bears.
However, bears are unable to keep prices lower, and bulls then push prices back to the opening price.
Market closes back
where the day started.
www.forex2tradeindia.weebly.com
venKEY
CANDLESTICKS Indecisio
n
6
7. Dragon FLY Doji
Dragonfly Doji
Significant bullish
reversal
candlestick pattern
Mainly occurs at
the bottom of
downtrends.
The Dragonfly Doji is created when the open, high,
and close are the same or about the same price
(Where the open, high, and close are exactly the same
price is quite rare). The most important part of the
Dragonfly Doji is the long lower shadow.
Bullis
h
www.forex2tradeindia.weebly.com
venKEY
CANDLESTICKS
The long lower shadow implies that the market tested
to find where demand was located and found it. Bears
were able to press prices downward, but an area of
support was found at the low of the day and buying
pressure was able to push prices back up to the
opening price. Thus, the bearish advance downward
was entirely rejected by the bulls.
In the chart, the market began the day testing to find
where demand would enter the market. The Stock
eventually found support at the low of the day, so
much support and subsequent buying pressure, that
prices were able to close the day approximately
where they started the day.
The Dragonfly Doji is an extremely helpful
Candlestick pattern to help traders visually see where
support and demand is located. After a downtrend,
the Dragonfly Doji can signal to traders that the
downtrend could be over and that short positions
should probably be covered. Other indicators should
be used in conjunction with the Dragonfly Doji
pattern to determine buy signals, for example, a break
of a downward trendline.
Note: The reverse of the Dragon Fly is
Gravestone Doji (see: Gravestone Doji). 7
8. Grave STONE Doji
Gravestone Doji :
significant
bearish reversal
candlestick
pattern.
Mainly occurs at
the top of
uptrends.
The Gravestone Doji is an extremely helpful
Candlestick reversal pattern to help traders visually
see where resistance and supply is likely located.
Bearish
www.forex2tradeindia.weebly.com
venKEY
CANDLESTICKS
Note: The reverse of the Gravestone is
Dragon Fly Doji (see: DragonFly Doji).
The Gravestone Doji is created when the open, low,
and close are the same or about the same price
(Where the open, low, and close are exactly the same
price is quite rare). The most important part of the
Graveston Doji is the long upper shadow.
The long upper shadow is generally interpreted by
technicians as meaning that the market is testing
to find where supply and potential resistance is
located.
• The construction of the Gravestone Doji pattern occurs
when bulls are able to press prices upward.
• However, an area of resistance is found at the high of the
day and selling pressure is able to push prices back down
to the opening price.
• Therefore, the bullish advance upward was entirely
rejected by the bears.
After an uptrend, the Gravestone Doji can signal to
traders that the uptrend could be over and that long
positions should probably be exited. But other
indicators should be used in conjunction with the
Gravestone Doji pattern to determine an actual sell
signal.
A potential trigger could be a break of the upward
trendline support. 8
9. Spinning Tops or (koma) is a candlestick which the body
of the candlestick is smaller than the lower and upper wicks.
Spinning
TOPS
www.forex2tradeindia.weebly.com
venKEY
CANDLESTICKS Indecisio
n
If we spot on our chart a bullish Marubozu candle for example, we can
quickly come to the conclusion that for that time period (represented by the
candle) the buyers have controlled the price action from the first trade to the
last trade.
You can clearly see that a Marubozu candle has no shadows ( high and low
price levels outside the body). This means in the case of a bullish Marubozu
– that the seller could not push the buyers back from any new high price that
was created in that time period.
The opposite for a bearish Marubozu: the sellers had total control on
the price action, and the buyers could not push the market back up
from any new low.
As I mentioned before, the greater the time period of candles we are looking
at, the more important the shapes of the candles is to us.
MARUBOZU Reversa
l
IT represents a neutral position in which neither the bulls or bears are
able to gain control during the trading session.
Color of the real body is irrelevant as (body of the candle is so small)
If a spinning top arises after a strong uptrend or downtrend, it is an
early sign that the trend could be reversing.
Traders should wait for more confirmation that the trend is changing
prior to taking a short or long position.
MARUBOZU :when recognized, is a good example of a
strong buying ( in case of a bullish Marubozu) or selling ( in
case of a bearish Marubozu) pressure.
When we spot a Marubozu candle, we would want to
regard it with connection to how the market is trading
right now. If we are in the middle of a long bullish
trend, and we spot a bearish Marubozu, this can be a
sign for a coming reversal in price. 9
10. Bullish Engulfing Pattern
A chart pattern that forms when a small
black candlestick is followed by a large
white candlestick that completely eclipses
or "engulfs" the previous day's
candlestick.
The shadows or tails of the small
candlestick are short, which enables the
body of the large candlestick to cover the
entire candlestick from the previous day.
Reversa
l
The bearish candle real body of Day-1 is usually contained within the real body of the
bullish candle of Day 2.
On Day-2, the market gaps down; however, the bears do not get very far before bulls
take over and push prices higher, filling in the gap down from the morning's open and
pushing prices past the previous day's open.
The power of the Bullish Engulfing Pattern comes from the incredible change of
sentiment from a bearish gap down in the morning, to a large bullish real body
candle that closes at the highs of the day.
Bears have overstayed their welcome and bulls have taken control of the market.
www.forex2tradeindia.weebly.com
venKEY
CANDLESTICKS Bullish ENGULFING
10
11. Bearish Engulfing Pattern
A chart pattern that consists
of a small white candlestick with
short shadows or tails followed
by a large black candlestick that
eclipses or "engulfs" the small
white one. Which is reversal
pattern
A bearish harami may be formed from a combination of a large white or black candlestick and a smaller white or
black candlestick. The smaller the second candlestick, the more likely the reversal. It is thought to be a strong sign
that a trend is ending when a large white candle stick is followed by a small black candlestick.
Reversa
l
Generally, the bullish candle real body of Day 1 is contained within the real body of the bearish candle of Day 2.
The market gaps up (bullish sign) on Day 2; but, the bulls do not push very far higher before bears take over and push prices further down, not
only filling in the gap down from the morning's open but also pushing prices below the previous day's open.
With the Bullish Engulfing Pattern, there is an incredible change of sentiment from the bullish gap up at the open, to the large bearish
real body candle that closed at the lows of the day.
Bears have successfully overtaken bulls for the day and possibly for the next few periods.
www.forex2tradeindia.weebly.com
venKEY
Classical
PATTERNS Bearish ENGULFING
11
Reversa
l
12. Harami Cross
A trend indicated by a large candlestick
followed by a doji that is located within the
top and bottom of the candlestick's body.
This indicates that the previous trend is
about to reverse.
Definition:
Bullish Harami Cross Pattern is a doji preceded by a long
black real body. The Bullish Harami Cross Pattern is a major
bullish reversal pattern. It is more significant than a regular
Bullish Harami Pattern.
Recognition Criteria:
1. Market is characterized by downtrend.
2. Then we see a long black candlestick.
3. Long black candlestick is followed by a doji completely
engulfed by the real body of the first day. The shadows
(high/low) of the doji may not be necessarily contained
within the first black body, though it's preferable if they
are.
Explanation:
The Bullish Harami Cross Pattern is a strong signal of
disparity about the market’s health. During a downtrend, the
heavy selling reflected by a long, black real body; is followed
by a doji next day. This shows that the market is starting to
severe itself from the prior downtrend.
Important Factors:
The Bullish Harami Pattern is not a major reversal pattern,
however the Bullish Harami Cross Pattern is a major upside
reversal pattern. Short traders will not be wise to ignore the
significance of a harami cross just after a long black
candlestick. Harami crosses point out to the bottoms.
A third day confirmation of the reversal is recommended
(though not required) to judge that the downtrend has
reversed. The confirmation may be in the form of a white
candlestick, a large gap up or a higher close on the next
trading day.
www.forex2tradeindia.weebly.com
venKEY
CANDLESTICKS
Bullish HARAMI
cross
http://www.candlesticker.com/Cs43.asp
BULLSIH HARAMI CROSS
Type : Reversal
Relevance: : BULLISH
Prior Trend: : BEARISH
Reliability: ; Medium
Confirmation:Recommended
No. of Sticks : 2
12
13. Harami Cross
A trend indicated by a large candlestick
followed by a doji that is located within the
top and bottom of the candlestick's body.
This indicates that the previous trend is
about to reverse.
A Harami cross can be either bullish or bearish, depending on
the previous trend. The appearance of a Harami Cross, rather
than a smaller body, increases the likelihood that the trend will
reverse.
www.forex2tradeindia.weebly.com
venKEY
CANDLESTICKS
Definition:
Bearish Harami Cross Pattern is a doji preceded by a long
white real body. The Bearish Harami Cross Pattern is a major
reversal pattern and is more significant than a regular Bearish
Harami Pattern.
Recognition Criteria:
1. Market is characterized by uptrend.
2. We see a long white candlestick in the first day.
3. Then we see a doji completely engulfed by the real body of
the first day on the second day. The shadows (high/low) of
this Doji do not have to be contained within the first, though
it's preferable if they are.
Explanation:
The Bearish Harami Cross Pattern is a sign of disparity about the
market’s health. Market is bullish and strong buying continues as
evidenced by the long, white real body but then we see the doji.
This shows that the market may not continue in uptrend.
Important Factors:
While the Bearish Harami Pattern is not a major reversal pattern,
the Bearish Harami Cross Pattern is a major downside reversal
pattern. If a harami cross appears after a long white candlestick,
longs should take notice of it since Harami Crosses call tops very
effectively.
A confirmation on the third day is required to be sure that the
uptrend has reversed.
This confirmation may be in the form of a black candlestick, a
large gap down or a lower close on the third day.
BEARISH HARAMI CROSS
Type : Reversal
Relevance: : Bearish
Prior Trend: : Bullish
Reliability: ; Medium
Confirmation:Recommended
No. of Sticks : 2
Bearish HARAMI cross
13
14. DARK CLOUD COVER
Bearish
www.forex2tradeindia.weebly.com
venKEY
CANDLESTICKS
A Dark
Cloud
pattern
encounter
ed after an
up-trend is
a reversal
signal,
warning of
"rainy
days"
ahead.
Dark Cloud Cover
Dark Cloud Cover is a bearish candlestick
reversal pattern, similar to the Bearish Engulfing
Pattern (see: Bearish Engulfing Pattern).
Components of a Dark Cloud Cover formation:
Bullish Candle (1st) & Bearish Candle (2nd)
A Dark Cloud Cover Pattern occurs when a bearish
candle on Day 2 closes below the middle of Day 1's
candle.
In addition, price gaps up on Day 2 only to fill the gap
(see: Gaps) and close significantly into the gains made
by Day 1's bullish candlestick.
The rejection of the gap up is a bearish sign in and of
itself, but the retracement into the gains of the previous
day's gains adds even more bearish sentiment. Bulls are
unable to hold prices higher, demand is unable to keep
up with the building supply.
Dark Cloud Cover Sell Signal
Traders usually suggest not selling exactly when
one sees the Dark Cloud Cover Pattern (Day 1 &
Day 2) until other confirming signals are given
such as a break of an upward trendline or other
technical indicators. One reason for waiting for
confirmation is that the Dark Cloud Cover Pattern
is a bearish pattern, but not as bearish as it could
be: part of the gains from Day 1 have still been
preserved.
A more bearish reversal pattern is the Bearish Engulfing Pattern (see: Bearish Engulfing Pattern) that completely
rejects the gains of Day 1 and usually closes below the lows of Day 1.
Note :the bullish equivalent of the Dark Cloud Cover Pattern is the Piercing Pattern (see: Piercing Pattern).
14
15. PIERCING Line
www.forex2tradeindia.weebly.com
venKEY
CANDLESTICKS Bullis
h
The
Piercing
Line is the
opposite of
the Dark
Cloud
pattern
and is a
reversal
signal if it
appears
after a
down-
trend.
Piercing Line Pattern
A Bullish candlestick reversal pattern, similar
to the Bullish Engulfing Pattern (see: Bullish
Engulfing Pattern). Compents of a Piercing
Pattern :
Bearish Candle (1st) & Bullish Candle (2nd)
A Piercing Pattern occurs when a bullish candle on Day 2 closes
above the middle of Day 1's bearish candle.
Moreover, price gaps down on Day 2 only for the gap to be filled
(see: Gaps) and closes significantly into the losses made
previously in Day 1's bearish candlestick.
The rejection of the gap up by the bulls is a major bullish sign,
and the fact that bulls were able to press further up into the losses
of the previous day adds even more bullish sentiment. Bulls were
successful in holding prices higher, absorbing excess supply and
increasing the level of demand.
Piercing Pattern Candlestick Buy Signal
Generally other technical indicators are used to
confirm a buy signal given by the Piercing Pattern
(i.e. downward trendline break). Since the Piercing
Pattern means that bulls were unable to completely
reverse the losses of Day 1, more bullish movement
should be expected before an outright buy signal is
given. Also, more volume than usual on the bullish
advance on Day 2 is a stronger indicator that bulls
have taken charge and that the prior downtrend is
likely ending.
A more bullish reversal pattern is the Bullish Engulfing Pattern (see: Bullish Engulfing Pattern) that
completely reverses the losses of Day 1 and adds new gains.
For further study, the bearish equivalent of the Piercing Pattern is the Dark Cloud Cover Pattern
15
16. A hammer
that occurs
after an up
trend is
called a
'hanging
man' and
is a
bearish
signal.
www.forex2tradeindia.weebly.com
venKEY
CANDLESTICKS
Hanging Man - The Hanging Man candlestick formation, as one
could predict from the name, is a bearish sign. This pattern occurs
mainly at the top of uptrends and is a warning of a potential
reversal downward. It is important to emphasize that the Hanging
Man pattern is a warning of potential price change, not a signal, in
and of itself, to go short.
Hanging Man
The Hanging Man formation, just like theHammer, is created when
the open, high, and close are roughly the same price. Also, there is
a long lower shadow, which should be at least twice the length of
the real body.
When the high and the open are the same, a bearish Hanging Man
candlestick is formed and it is considered a stronger bearish sign
than when the high and close are the same, forming a bullish
Hanging Man (the bullish Hanging Man is still bearish, just less so
because the day closed with gains).
After a long uptrend, the formation of a Hanging Man is bearish
because prices hesitated by dropping significantly during the day.
Granted, buyers came back into the stock, future, or currency and
pushed price back near the open, but the fact that prices were able
to fall significantly shows that bears are testing the resolve of the
bulls. What happens on the next day after the Hanging Man pattern
is what gives traders an idea as to whether or not prices will go
higher or lower.
Confirmation that the uptrend was in trouble occured when
Alcoa gapped down the next day and continued downward
creating a large bearish red candle. To some traders, this
confirmation candle, plus the fact that the upward trendline
support was broken, gave the signal to go short.
It is important to repeat, that the Hanging Man formation is
not the sign to go short; other indicators such as a trendline
break or confirmation candle should be used to generate sell
signals.
The bullish version of the Hanging Man is the Hammer
formation (see: Hammer) that occurs after downtrends.
16
17. www.forex2tradeindia.weebly.com
venKEY
CANDLESTICKS TWEEZERS
Reversa
l
Twin
Towers
Tweezer Tops and Bottoms
The Tweezer Top formation is a bearish reversal pattern
seen at the top of uptrends and the Tweezer Bottom
formation is a bullish reversal pattern seen at the bottom of
downtrends.
Tweezer Top formation consists of two candlesticks:
Bullish Candle (Day 1) Bearish Candle (Day 2)
Tweezer Bottom formation consists of two candlesticks:
Bearish Candle (Day 1) Bullish Candle (Day 2)
Sometimes Tweezer Tops or Bottoms have three candlesticks.
A bearish Tweezer Top occurs during an uptrend when bulls
take prices higher, often closing the day off near the highs (a
bullish sign). However, on the second day, how traders feel (i.e.
their sentiment) reverses completely. The market opens and
goes straight down, often eliminating the entire gains of Day 1.
The reverse, a bullish Tweezer Bottomoccurs during a
downtrend when bears continue to take prices lower, usually
closing the day near the lows (a bearish sign).
Nevertheless, Day 2 is completely opposite because prices
open and go nowhere but upwards. This bullish advance on
Day 2 sometimes eliminates all losses from the previous day.
Tweezer BOTTOM
(intra-day)
17
18. 1.Morning Star :
A bullish candlestick pattern that consists of three
candles that have demonstrated the following
characteristics:
1. The first bar is a large red candlestick located within
a defined downtrend.
2. The second bar is a small-bodied candle (either red
or white) that closes below the first red bar.
3. The last bar is a large white candle that opens
above the middle candle and closes near the center
of the first bar's body.
As shown by the chart, this pattern is used by traders as
an early indication that the downtrend is about to
reverse.
Morning Star pattern - can be useful in determining trend changes, Particularly when used in conjunction
with other technical indicators. Many traders also use price oscillators such as the MACD and RSI to confirm
the reversal.
Day 1 of the Morning Star pattern for the Midcap 400 (MDY)
chart above was a strong bearish red candle. Day 2
continued Day 1's bearish sentiment by gapping down.
Day 2 was a Doji, which is a candlestick signifying
indecision. Bears were unable to continue the large
decreases of the previous day; they were only able to close
slightly lower than the open.
Day 3 began with a bullish gap up. The bulls then took hold
of the Midcap 400 exchange traded fund for the entire day.
Also, Day 3 broke above the downward trendline that had
served asresistance for MDY for the past week and a half.
Both the trendline break and the classic Morning Star
pattern gave traders a signal to go long and buy the Midcap
400 exchange traded fund.
The Morning Star pattern is a very powerful three
candlestick bullish reversal pattern. The bearish
equivalent of the Morning Star is the Evening Star
pattern (see: Evening Star).
Morning STAR
Bullish
www.forex2tradeindia.weebly.com
venKEY
CANDLESTICKS
18
19. Evening Star:
A bearish candlestick pattern consisting of three
candles that have demonstrated the following
characteristics:
1. The first bar is a large white
candlestick located within an uptrend.
2. The middle bar is a small-bodied candle (red or
white) that closes above the first white bar.
3. The last bar is a large red candle that opens below
the middle candle and closes near the center of the
first bar's body.
As shown by the chart below, this pattern is used by
traders as an early indication that the uptrend is about
to reverse.
Evening Star formations can be useful in determining trend changes, particularly when used in
conjunction with other indicators. Many traders use price oscillators and trendlines to confirm this
candlestick pattern
Evening STAR
Bearish
Day 1 of the Evening Star pattern for Exxon-Mobil (XOM) stock
above was a strong bullish candle, in fact it was so strong that the
close was the same as the high (very bullish sign).
Day 2 continued Day 1's bullish sentiment by gapping up. However,
Day 2 was a Doji, which is a candlestick signifying indecision. Bulls
were unable to continue the large rally of the previous day; they
were only able to close slightly higher than the open.
Day 3 began with a bearish gap down. In fact, bears took hold of
Exxon-Mobil stock the entire day, the open was the same as the
high and the close was the same as the low (a sign of very bearish
sentiment). Also, Day 3 powerfully broke below the upward trendline
that had served as support for XOM for the past week. Both the
trendline break and the classic Evening Star pattern gave traders a
signal to sell short ……>
The Evening Star pattern is a very powerful three candlestick
bearish reversal pattern. The bullish equivalent of the Evening
Star is the Morning Star pattern (see: Morning Star).
www.forex2tradeindia.weebly.com
venKEY
CANDLESTICKS
19
20. Tri-Star - A type of candlestick pattern that signals a reversal
in the current trend. This pattern is formed when three
consecutive doji candlesticks appear at the end of a prolonged
trend.
The chart below illustrates a bearish tri-star pattern at the top of
the uptrend and is used to mark the beginning of a shift in
momentum.
Tri-Star - A single Doji candlestick is an infrequent
occurrence that is used by traders to suggest market
indecision. Having a series of three consecutive
doji candles is extremely rare, but when it is discovered,
the severe market indecision generally leads to a sharp
reversal of the given trend. The "three stars" pattern can
also be used to signal the reversal of downward
momentum when the pattern is formed at the end of a
prolonged downtrend.
TRI Star
www.forex2tradeindia.weebly.com
venKEY
CANDLESTICKS
NEW
PATTERN
20
21. Hook Reversal
Pattern
www.forex2tradeindia.weebly.com
venKEY
CANDLESTICKS
Bullish
Hook
reversals are
short- to medium-
term reversal
patterns. They are
identified by a
higher low and a
lower high
compared to the
previous day.
Exit:
Defining the target and
stop - In most cases, you will
see a sharp reversal (as seen
in Figs. 3 and 4) when using
this pattern. If the next candle
shows a strong continuation of
the prior trend, then the
reversal pattern is invalidated,
and you should exit quickly, but
prudently.
Entry: Confirming the reversal pattern -
If the pattern occurs after an uptrend, then
the open must be near the prior high, and the
low must be near the prior low.
If the pattern occurs after a downtrend, then
the opposite is true. As with the island
reversal pattern, we are also looking for high
volume on this second candle. Finally, the
stronger the prior trend, the more reliable the
reversal pattern.
Bearish
21
22. www.forex2tradeindia.weebly.com
venKEY
CANDLESTICKS Kickers Kicker patterns are some of the strongest, most
reliable candlestick patterns. They are characterized
by a very sharp reversal in price during the span of
two candlesticks.
Bullish
Entry: Confirming the reversal pattern -
This kind of price action tells you that one group of traders has overpowered
the other (often as a result of a fundamental change in the company), and a
new trend is being established.
Ideally, you should look for a gap between the first and second candles, along
with high volume.
Exit: Defining a target and stop -
When using this pattern, you will see an immediate reversal, which should
result in an overall trend change.
If the trend instead moves sideways or against the reversal direction, then
you should exit quickly, but prudently.
Candles
Appear
On
CHART
22
23. San-Ku (Three Gaps)
Patterns
San-Ku (Three Gaps)
Patterns
are anticipatory trend reversal
indicators. In other words, they
do not indicate an exact point
of reversal; rather, they indicate
that a reversal is likely to occur
in the near future. They are
identified by three gaps within a
strong trend.
Bearish
www.forex2tradeindia.weebly.com
venKEY
CANDLESTICKS
Exit: Defining the target and stop -
In most cases, when using this pattern, you will
see a price reversal shortly after the third gap
takes place (as seen in Fig. 5). However, if there
are any breakouts on high volume after the last
gap, then the pattern is invalidated, and you
should exit quickly, but prudently.
Entry: Confirming the reversal pattern -
This pattern operates on the premise that prices
are likely to retreat after sharp moves because
traders are likely to start booking profits.
Therefore, this pattern is best used with
ther exhaustion indicators. So, look for extremes
being reached in indicators such as
the RSI (relative strength
index), MACD (moving average convergence
divergence) crossovers, and other such
indicators. It is also useful to look for volume
patterns that suggest exhaustion.
23
25. SAKATA 5-method
www.forex2tradeindia.weebly.com
BAR
REVERSAL
25
venKEY
Three Methods
- Raising 3 method
- falling 3 method
This looks similar to the rising
three of falling three method
discussed in my other post.
The market makes a pause
within this pattern and starts to
go in the direction of the trend
again after the three methods
is „over”.
Sakata’s method has its own set of candlestick patterns and they have been developed based on Honma’s 160 rules. The number 3 is important in case of
his patterns
Three Mountains -
Previously, when talking
about other type
of charts and such I have
mentioned the three top
formations etc. This three
mountains looks similar.
Three Gaps –
After the market has bottomed,
you can see three empty
candlesticks going up, there’s a
gal between all of them. Once
the third long candlestick is
visible, you can expect a
reversal.
Munehisa Honma -1755 - One of Sakata’s method baselines is
that if you feel you could benefit from a certain formation, wait 3 days
and if it still looks promising, enter the trade and you can most likely
make profits.
Three Buddhas -
like head and shoulders
formation.
Three rivers /Three
Sisters–
Opposite to the three
mountains formation. This
is basically a three bottom
formation.
Note that in case of
Sakata’s method there’s
not just 1-5 candlesticks
that we are looking at
anymore but rather the
whole chart which may
consist of multiple weeks,
months or years.
Three soldiers/black crows
I’d say it’s similar to the
three gaps – three soldiers who
are all going in the same
direction, except that
no gaps are required. Note that
this is not a reversal but rather
a CONTINUATION pattern.
http://www.learning-to-
invest.com/
3 –days
3-methods
Triple TOPS
Head & Shoulder
Triple BOTTOMS
26. Bar
REVERSAL
BAR REVERSALS
1. UPWARD KEY- reversal
2 DOWNWARD KEY – reversal
3 Perfect Upward Key-reversal
4 Perfect Downward Key-
reversal
5 Two day reversal
6 Island Reversal (bull/bear)
7 Low Leaving Bar (LL bar)
8 Formation of TAIL BAR
9 5C reversal
10.3K bar (knocking Bar)
www.forex2tradeindia.weebly.com
BAR
REVERSAL
26
Bar-Reversal
When a particular bar/a group of bars combined
together and speaks for a change in a trend a
bar-reversal is said.
As because it the reversal phenomena it occurs
either after a prolong rise or after a prolong down-
fall.
Reversal will not occur in the middle point of
chart..
venKEY
BAR CHART PATTERNS can give you
invaluable insight into price action at a
glance. While the basic candlestick
patterns can tell you what the market is
thinking, they often generate false
signals because they are so common.
Here we introduce you to more
advanced BAR REVERSAL
PATTERNS, with a higher degree of
reliability, as well as explore how they
can be combined with gaps to produce
profitable trading strategies.
27. www.forex2tradeindia.weebly.com
BAR
REVERSAL
venKEY
Upward KEY-
reversal Comes after a
prolong down trend
Symptoms:
The previous trend was down , market has been falling for
a considerable period of time. One day market open below
of the previous day and keep falling further. After some
time price starts recovery from the day low and moved
within the body of the previous day bar at least by 50% and
manages to close near the high of the day.
Bullish
Reversal
Downward KEY-reversal Comes after a
prolong up trend
Symptoms:
The previous trend was UP, market moves for a
considerable period of time and one day the market open
up of the previous day high and keep going up trend.
After a considerable time the price starts selling pressure
with or without volumes. (revers of the above)
Trading method: -Volume has no
IMPORTANCE
Bearish
Reversal
Trading method: Before taking long position – one should
examine the VOLUME of the said period.
Volume should be 2 times better than the average of last 5 bars.
27
Compare with
Piercing Line
Compare with
DARKCLOUD
28. www.forex2tradeindia.weebly.com
BAR
REVERSAL
venKEY
Perfect upward KEY-reversal
In case of the perfect upwards key reversal volume
tends to greater than the upward key reversal. Some
time it acts as a bear market-bottom.
The previous trend was UP, market moves for a
considerable period of time and one day the market
open up of the previous day high and keep going up
trend.
After a considerable time the price starts selling
pressure with or without volumes.
Trading method:
Before taking long position – one should examine
the VOLUME of the said period.
Volume has no IMPORTANCE
Bullish
Reversal
Bearish
Reversal
Perfect downward KEY-reversal
In case of the perfect DOWNwards key reversal
volume tends to LESSER than the DOWN ward key
reversal.
Some time it acts as a BULL market-Tops
The previous trend was UP, market moves for a
considerable period of time and one day the market
open up of the previous day high and keep going up
trend.
After a considerable time the price starts selling
pressure with or without volumes. (reveres of the
above)
Trading method: -Volume has no
IMPORTANCE 28
Compare with
BULLISH ENGULFING
Compare with
BEARISH
ENGULFING
29. www.forex2tradeindia.weebly.com
BAR
REVERSAL
venKEY
2-day Reversal
Two day reversal bar occurs on a consecutive two-day
bars where the main of the bars is equal but nature is
totally different.
In case of the Bullish two day reversal which as closing
above the opening on the 1st and closing above the
opening on the 2nd day.
In case of bullish two-day reversal the formation of the
second bar should supported by the greater volume
BULLISH BEARISH
Two day reversal bar occurs on a consecutive two-day
bars where the main of the bars is equal but nature is
totally different.
In case of the Bullish two day reversal which as closing
below the opening on the 1st and closing above the
opening on the 2nd day.
Volume has No criteria
29
30. www.forex2tradeindia.weebly.com
BAR
REVERSAL
venKEY
ISLAND REVERSAL
BULLISH BEARISH
Island Reversal
Patterns
are strong short-term
trend reversal indicators
. They are identified by
a gap between a
reversal candlestick and
two candles on either
side of it.
Entry: Confirming the reversal pattern - When looking for an island reversal, you are looking for indecision and a battle
between bulls and bears. This type of scenario is best characterized by a long-ended doji candle that has high volume
occurring after a long prior trend; it is important to look for these three elements to confirm any potential reversal pattern.
Exit: Defining the target and stop - In most cases, you will see a sharp reversal (as seen in Figs. 1 and 2) when using this
pattern. This reversal pattern does not necessarily indicate a medium- or long-term reversal, so it would be prudent to exit
your position after the swing move has been made. If the next candle ever fills the gap, then the reversal pattern is
invalidated, and you should exit prudently.
Island reversals can also occur in
"clusters" - that is, in a multi-candle
reversal pattern, such as
an engulfing, as opposed to a single
candle reversal. Clusters are easier
to spot, but they often result in
weaker reversals that are not as
sharp and take longer to occur.
30
31. www.forex2tradeindia.weebly.com
BAR
REVERSAL
venKEY
LL Bar (Low Leaving Bar)
Low leaving bar occurs after
a prolong down fall. After
opening of the market price
fall in the first session but
manages to find support in
second session. And manage
to close at least 30% of the
above of day low. Buy signal
occurred while price
manages/crosses the high of
the low leaving bar.
The length of the said bar is greater
than the average of the last 11 bars.
If the Low leaving bar is occurred at
the top of the Chart then there is a
High Chance of BEARISH trend
Reversal.
Reverse the same if it appears at the
bottome of the Chart. Then one could
expect a BULLISH rally from the
Point.
Formation of TAIL BAR
31
32. www.forex2tradeindia.weebly.com
BAR
REVERSAL
venKEY
3 k (knocking) BAR
A single bar should close
below the low of the
previous three candles
It signifies the Bearish
5 C Reversal ( Closing
Basis)
5C reversal (closing basis):
Rock Sold bottom…after strong
consolidations…market moves towards
high trending.
It has to close above the last 5 candle…
other-wise it is not a valid 5C reversal.
Trade with sl= 5 bars low= solid rock
means highly and no. of times tested it
support.
32
33. Candlestick Patters
Major & Imp. Patterns
Doji Signal Long-Legged Doji
Bullish Engulfing Bearish Engulfing S
Hammer Hanging Man
Piercing Pattern Dark Cloud
Bullish Harami Bearish Harami
Morning Star Evening Star
Kicker Signals Shooting Star
Inverted Hammer
Secondary Patterns
The Tri Star Three Black Crows
Three Identical Crows Two Crows
Upside Gap Two Crows Meeting Lines
Belt Hold The Breakaway
Deliberation Advance Block
Ladder Bottom Homing Pigeon
Stick Sandwich Matching Low
Three Stars in the South Three White
Soldiers
Unique Three River Bottom
Three Inside Up & Three Inside Down
Concealing Baby Swallow
www.forex2tradeindia.weebly.com
venKEY
CANDLESTICKS
33
Cradle Pattern
Dumpling Top
Fry Pan Bottom
Jay-Hook Pattern
coop Pattern
Tweezer Bottom / TOP
Double Bottom / Top
Double Top
Trading Channels
Gap Down Hammer at the
Bottom
Gap Up Inverted Hammer
Gap Down After a Doji at the
Top
Gap Down Doji at the Bottom
Gap Down Bullish Engulfing
Gap Down Bearish Harami
Gap Down Shooting Star
Gap Down Hanging Man
Multiple Tails to the Downside
Series of Shadows at the Top
Series of Doji at the Top
Series of Doji at the Bottom
Doji End of Flat Trading Range
Top
Doji End of Flat Trading
Range Bottom
Combination Bullish Signals at
the Bottom
Combination Sell Signals at the
Top
Double Bullish Engulfing Pattern
Double Bearish Engulfing
Pattern
Breakout Through Moving
Averages
Moving Averages Act as Price
Magnets
Moving Average as Support
Moving Average as Resistance
High Profitable Patterns
All other Patterns
34. Day Trading
Strategies
1. BUY above> or SELL below<
2. Day LOW and HIGH breakings
3. Previous day Closing
4. Volume (Value or Qty.)
5. RSI (over bought/over sold)
6. Moving Averages/ MACd
crossover
7. Divergence (price vs. Indicators)
8. Double Top/Bottoms
9. Spread strategies
10. Hedging
11. Price Gaps Trading
12. Choosing Options
PROFIT Deciding Factors
1. Breakouts
2. Support & Resistance
3. Retracement Levels
- Pivot Points
- Fibonacci
4. Trend Reversal
5. Moving Averages & Cross over
6. Anniversary Figures
7. Rounded Figures
8. Holidays / Weekends
9. Popular Patterns
- Head & Shoulder
- Triangles
- Double Top/Bottoms
- Cup & Handle
- Rounding Top/Bottom
- Diamond Pattern
- Greatly Pattern
www.forex2tradeindia.weebly.com
Theory
34
venKEY
35. Tgt. & Sl.
fixation
Regular System:
Day Low or Day High
Yesterday Closing
Technical Aspect
Change of Open Interest
Tech. Support & Resistance (Pivot-
Day)
Tech. Support & Resistance
(Fibonacci)
Pys. Support & Resistance ( Trend
Lines)
Supports & Resistance ( Patterns)
Moving Averages Crossover
RSI-Over bought/sold conditions
Stochastics
Divergence
Last ‘n’ No. of Bars
Last (3) bars High/Lows
Other Affective Factors :
•Supply & Demand
•Inventory
•Bulk deals/profit booking/panic
buying
•Economy Statistics(GDP/Inflation)
•News Alerts (Intnl. Meets,
Resolutions)
•Corporate Results
•(Dividends, Orders, Returns)
•Government Policies
•(Imports/Exports/Taxes)
•Rounded Figures /Historical
Figures
•Historical Importance
•Seasons / weather
•Holidays
•Political Issues/Strikes
•Geographical Issues/Earth quake
www.forex2tradeindia.weebly.com
Theory
35
36. Candlestick Patters
Continuation Patterns
Upside Tasuki Gap
Downside Tasuki Gap
On Neck Line
In Neck Line
Thrusting
Rising Three Method
Falling Three Method
Side-By-Side White Line
Separating Lines
Mat Hold
Three-Line Strike
Upside Gap three Method
venKEYs2trad
e
http://www.candlesti
ckforum.com/PPF/P
arameters/16_20_/c
andlestick.asp
36
More study about Candlestics
http://www.scribd.com/doc/73
69608/Mastering-
Candlestick-Charts-Part-I
http://www.pristine.com/
37. Doji Star Shooting Star
Rising 3 (method) Falling 3 (method)
With a Shooting Star,
the body on the second
candlestick must be
near the low -- at the
bottom end of the
trading range -- and the
upper shadow must be
taller. This is also a
weaker reversal signal
than
the Morning orEvening
Star.
The pattern requires
confirmation from the
next candlestick closing
below half-way on the
body of the first.
The Rising
Method consists
of two strong
white lines brack
eting 3 or 4 small
declining black
candlesticks. The
final white line
forms a new
closing high. The
pattern is
definitely bullish.
The bearish
Falling Method
consists of two
long
black lines brac
keting 3 or 4
small
ascending
white
candlesticks,
the second
black line
forming a new
closing low.
A Doji Star is
weaker than
the Morning or Ev
ening Star:
the doji represent
s indecision. The
doji star requires
confirmation from
the next
candlestick
closing in the
bottom half of the
body of the first
candlestick.
While candlesticks may offer useful pointers as to short-term
direction,
trading on the strength of candlestick signals alone is not advisable.
Jack Schwager in Technical Analysis conducted fairly extensive tests with candlesticks
over a number of markets with disappointing results.
Evaluation
www.forex2tradeindia.weebly.com
venKEY
CANDLESTICKS
37
38. Harami Engulfing
Patterns
Morning Star Reversal Evening Star Reversal
Engulfing
patterns are
where the body
of the second
candlestick
'engulfs' the
first. They often
follow or
completedoji, h
ammer or grave
stone patterns
and signal
reversal in the
short-term
trend.
The Morning Star
pattern signals a
bullish reversal after
a down-trend. The
first candlestick has
a long black body.
The second
candlestick gaps
down from the first
(the bodies display
a gap, but the
shadows may still
overlap) and is
more bullish if
hollow. The next
candlestick has a
long white body
which closes in the
top half of the body
of the first
candlestick.
The Evening
Star pattern is
opposite
to Morning
Star and is a
reversal signal
at the end of an
up-trend. The
pattern is more
bearish if the
second
candlestick is
filled rather
than hollow.
A Harami
formation
indicates loss of
momentum and
often warns of
reversal after a
strong trend.
Harami means
'pregnant' which
is quite
descriptive. The
second
candlestick must
be contained
within the body of
the first, though
the shadows may
protrude slightly.
www.forex2tradeindia.weebly.com
venKEY
CANDLESTICKS
38
39. Technical Analysis
For disciplined Trader who have
PATIENCE - CONFIDENCE
1 Chart Patterns
2 Price Movement
3 Volumes
4 RSI
5 MACd
6 Bollinger Bonds
7 Stochastics
8 Dow Theory
9 Elliot Wave
www.forex2tradeindia.weebly.com
Theory