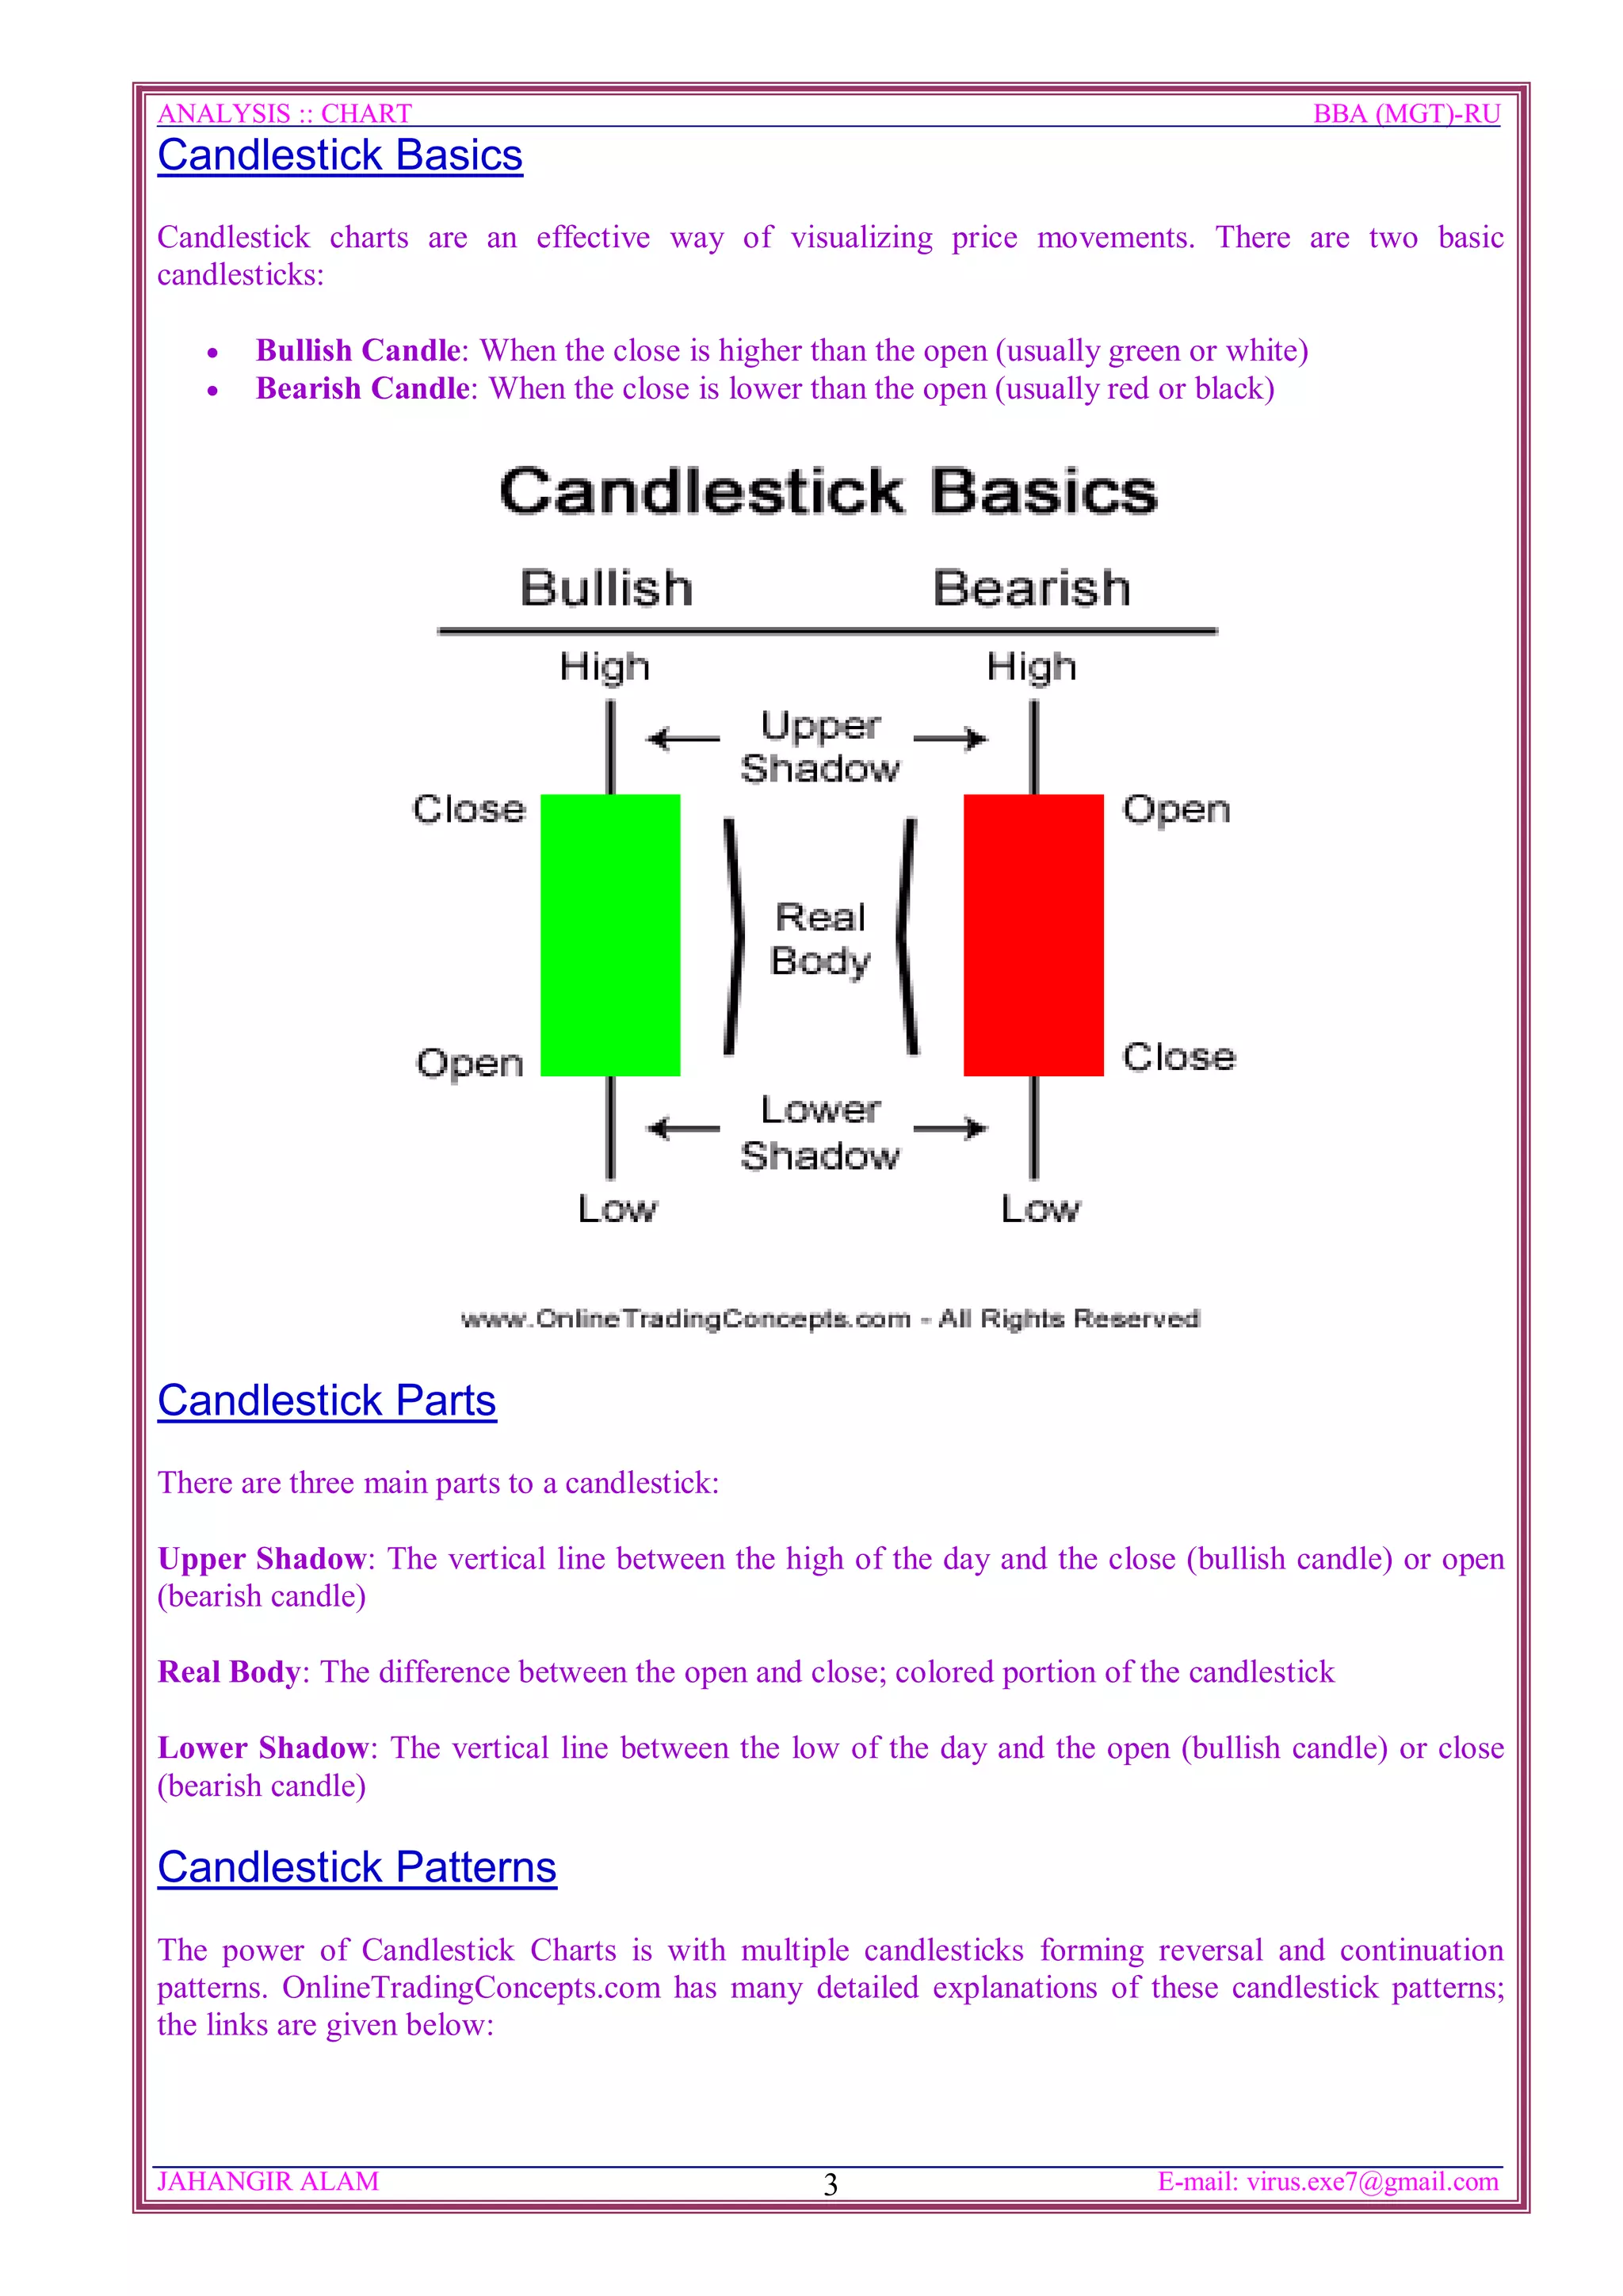
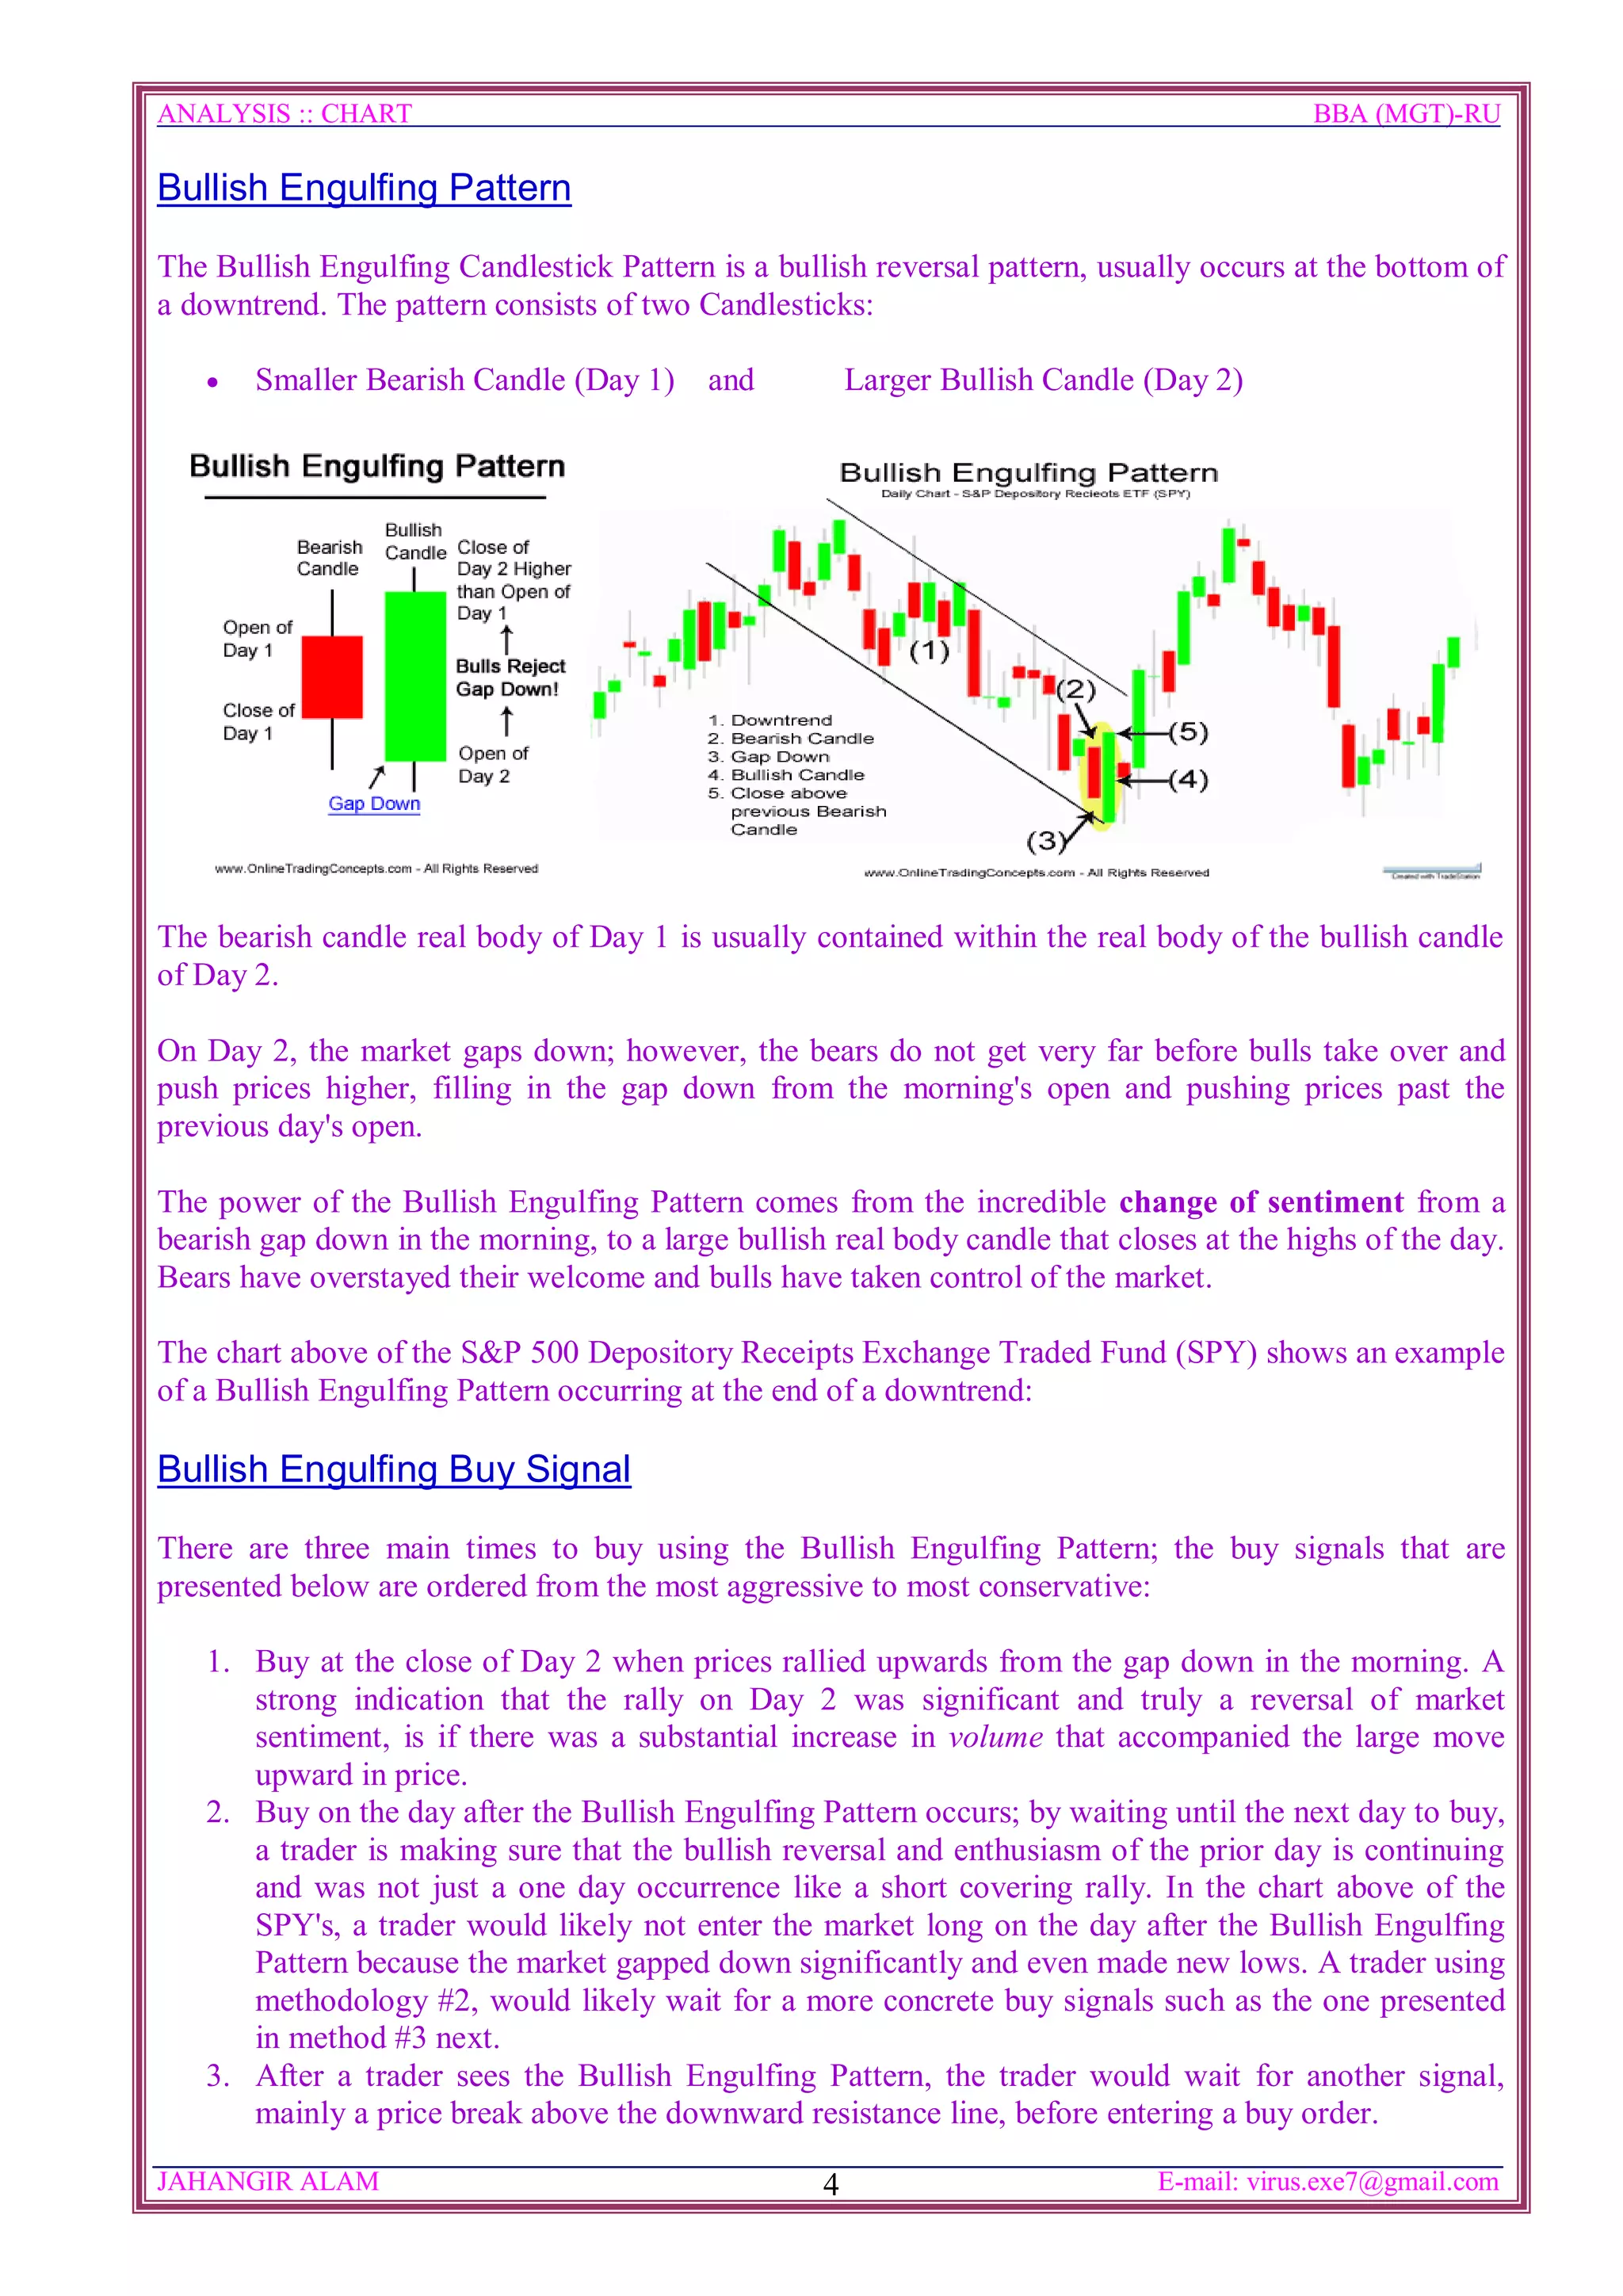
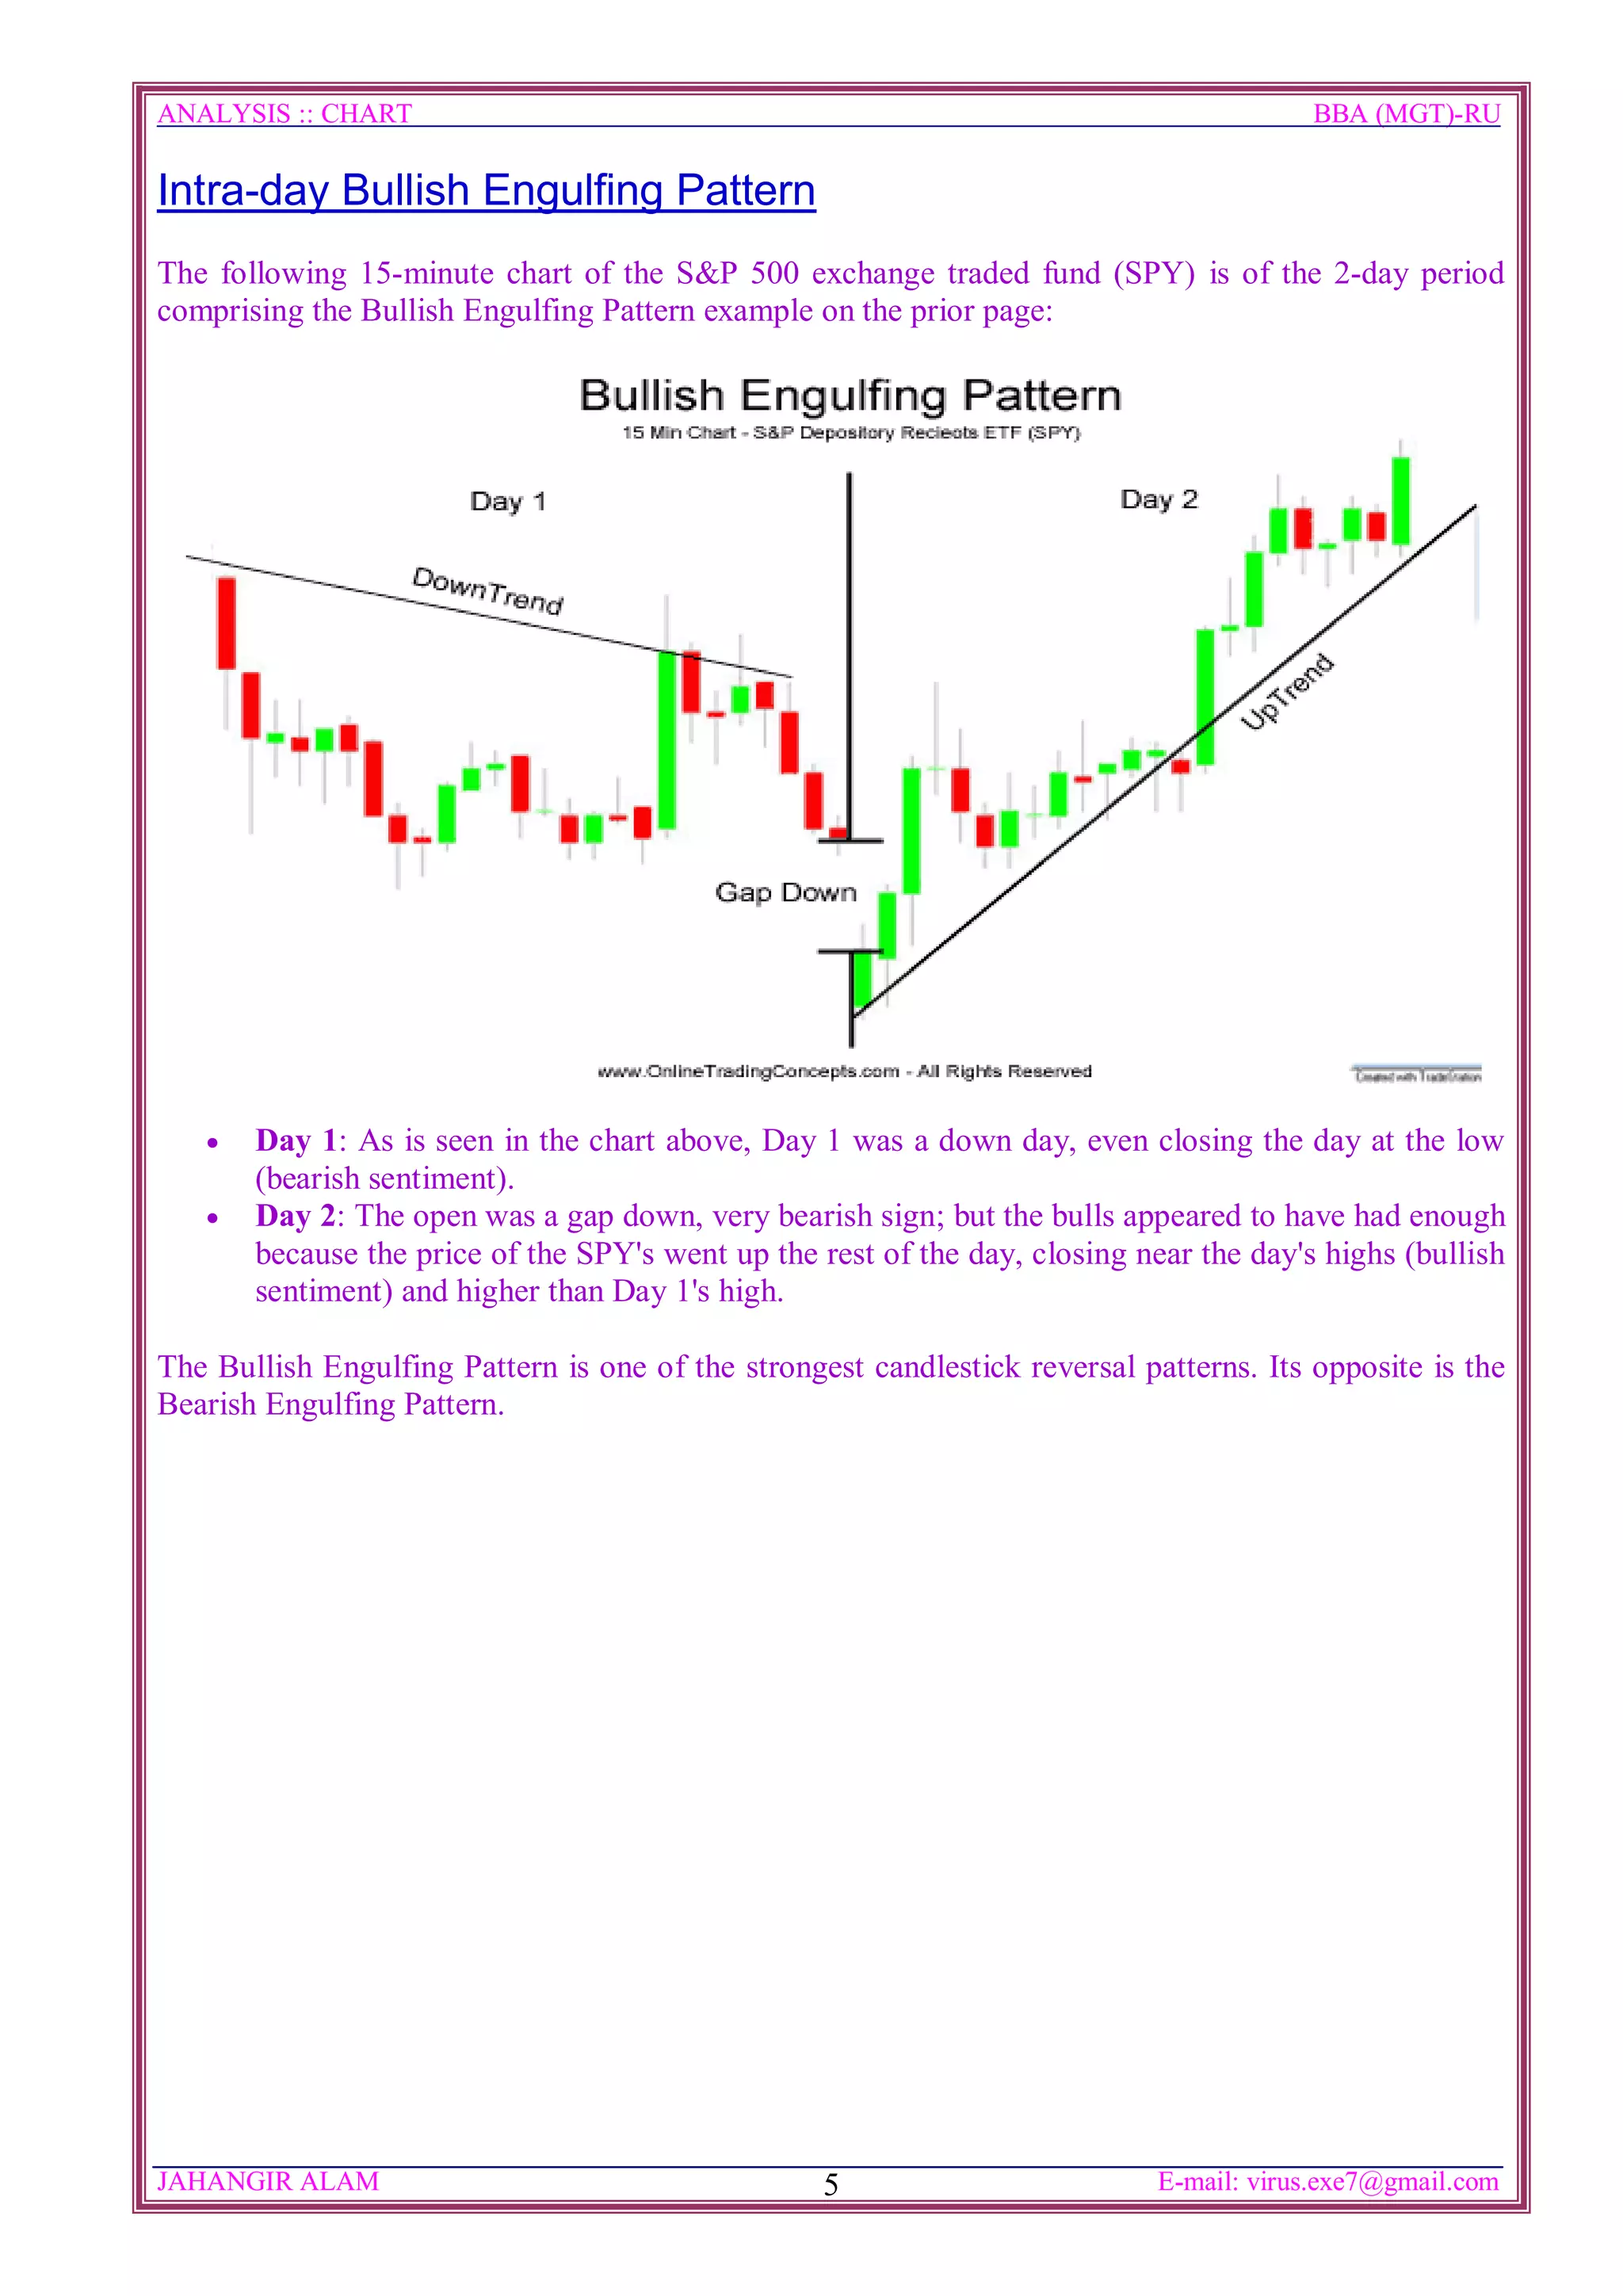
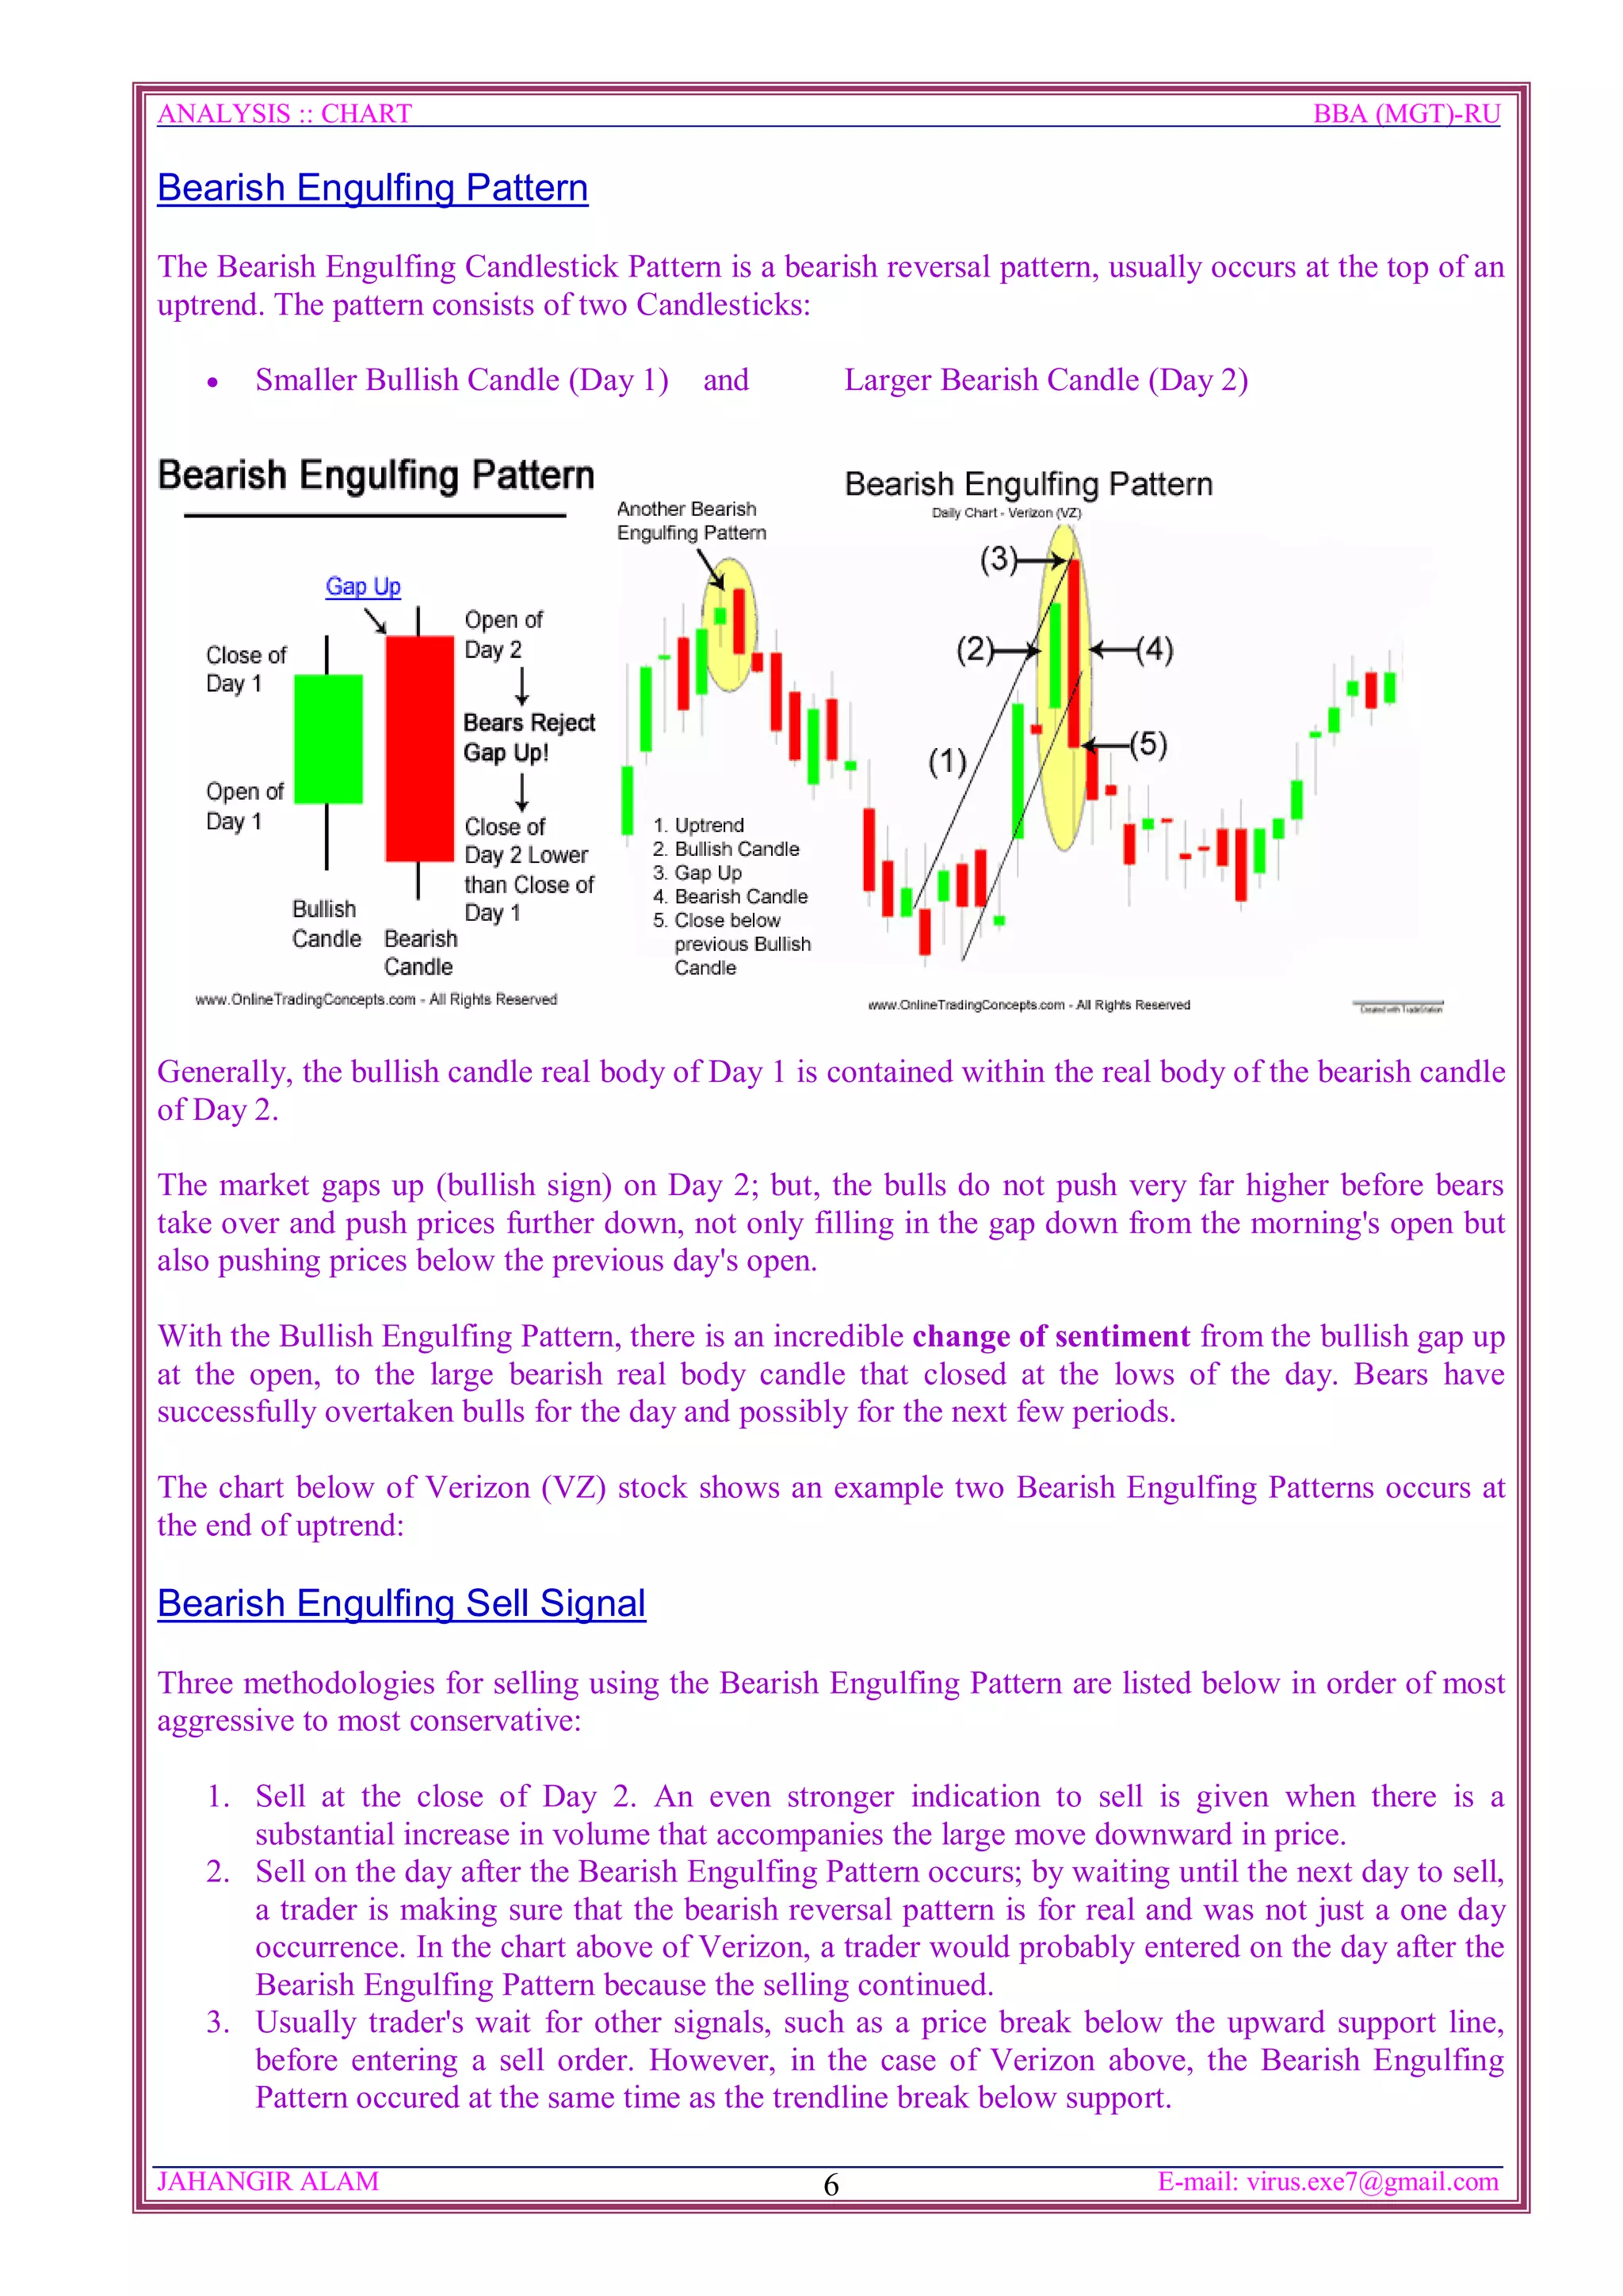
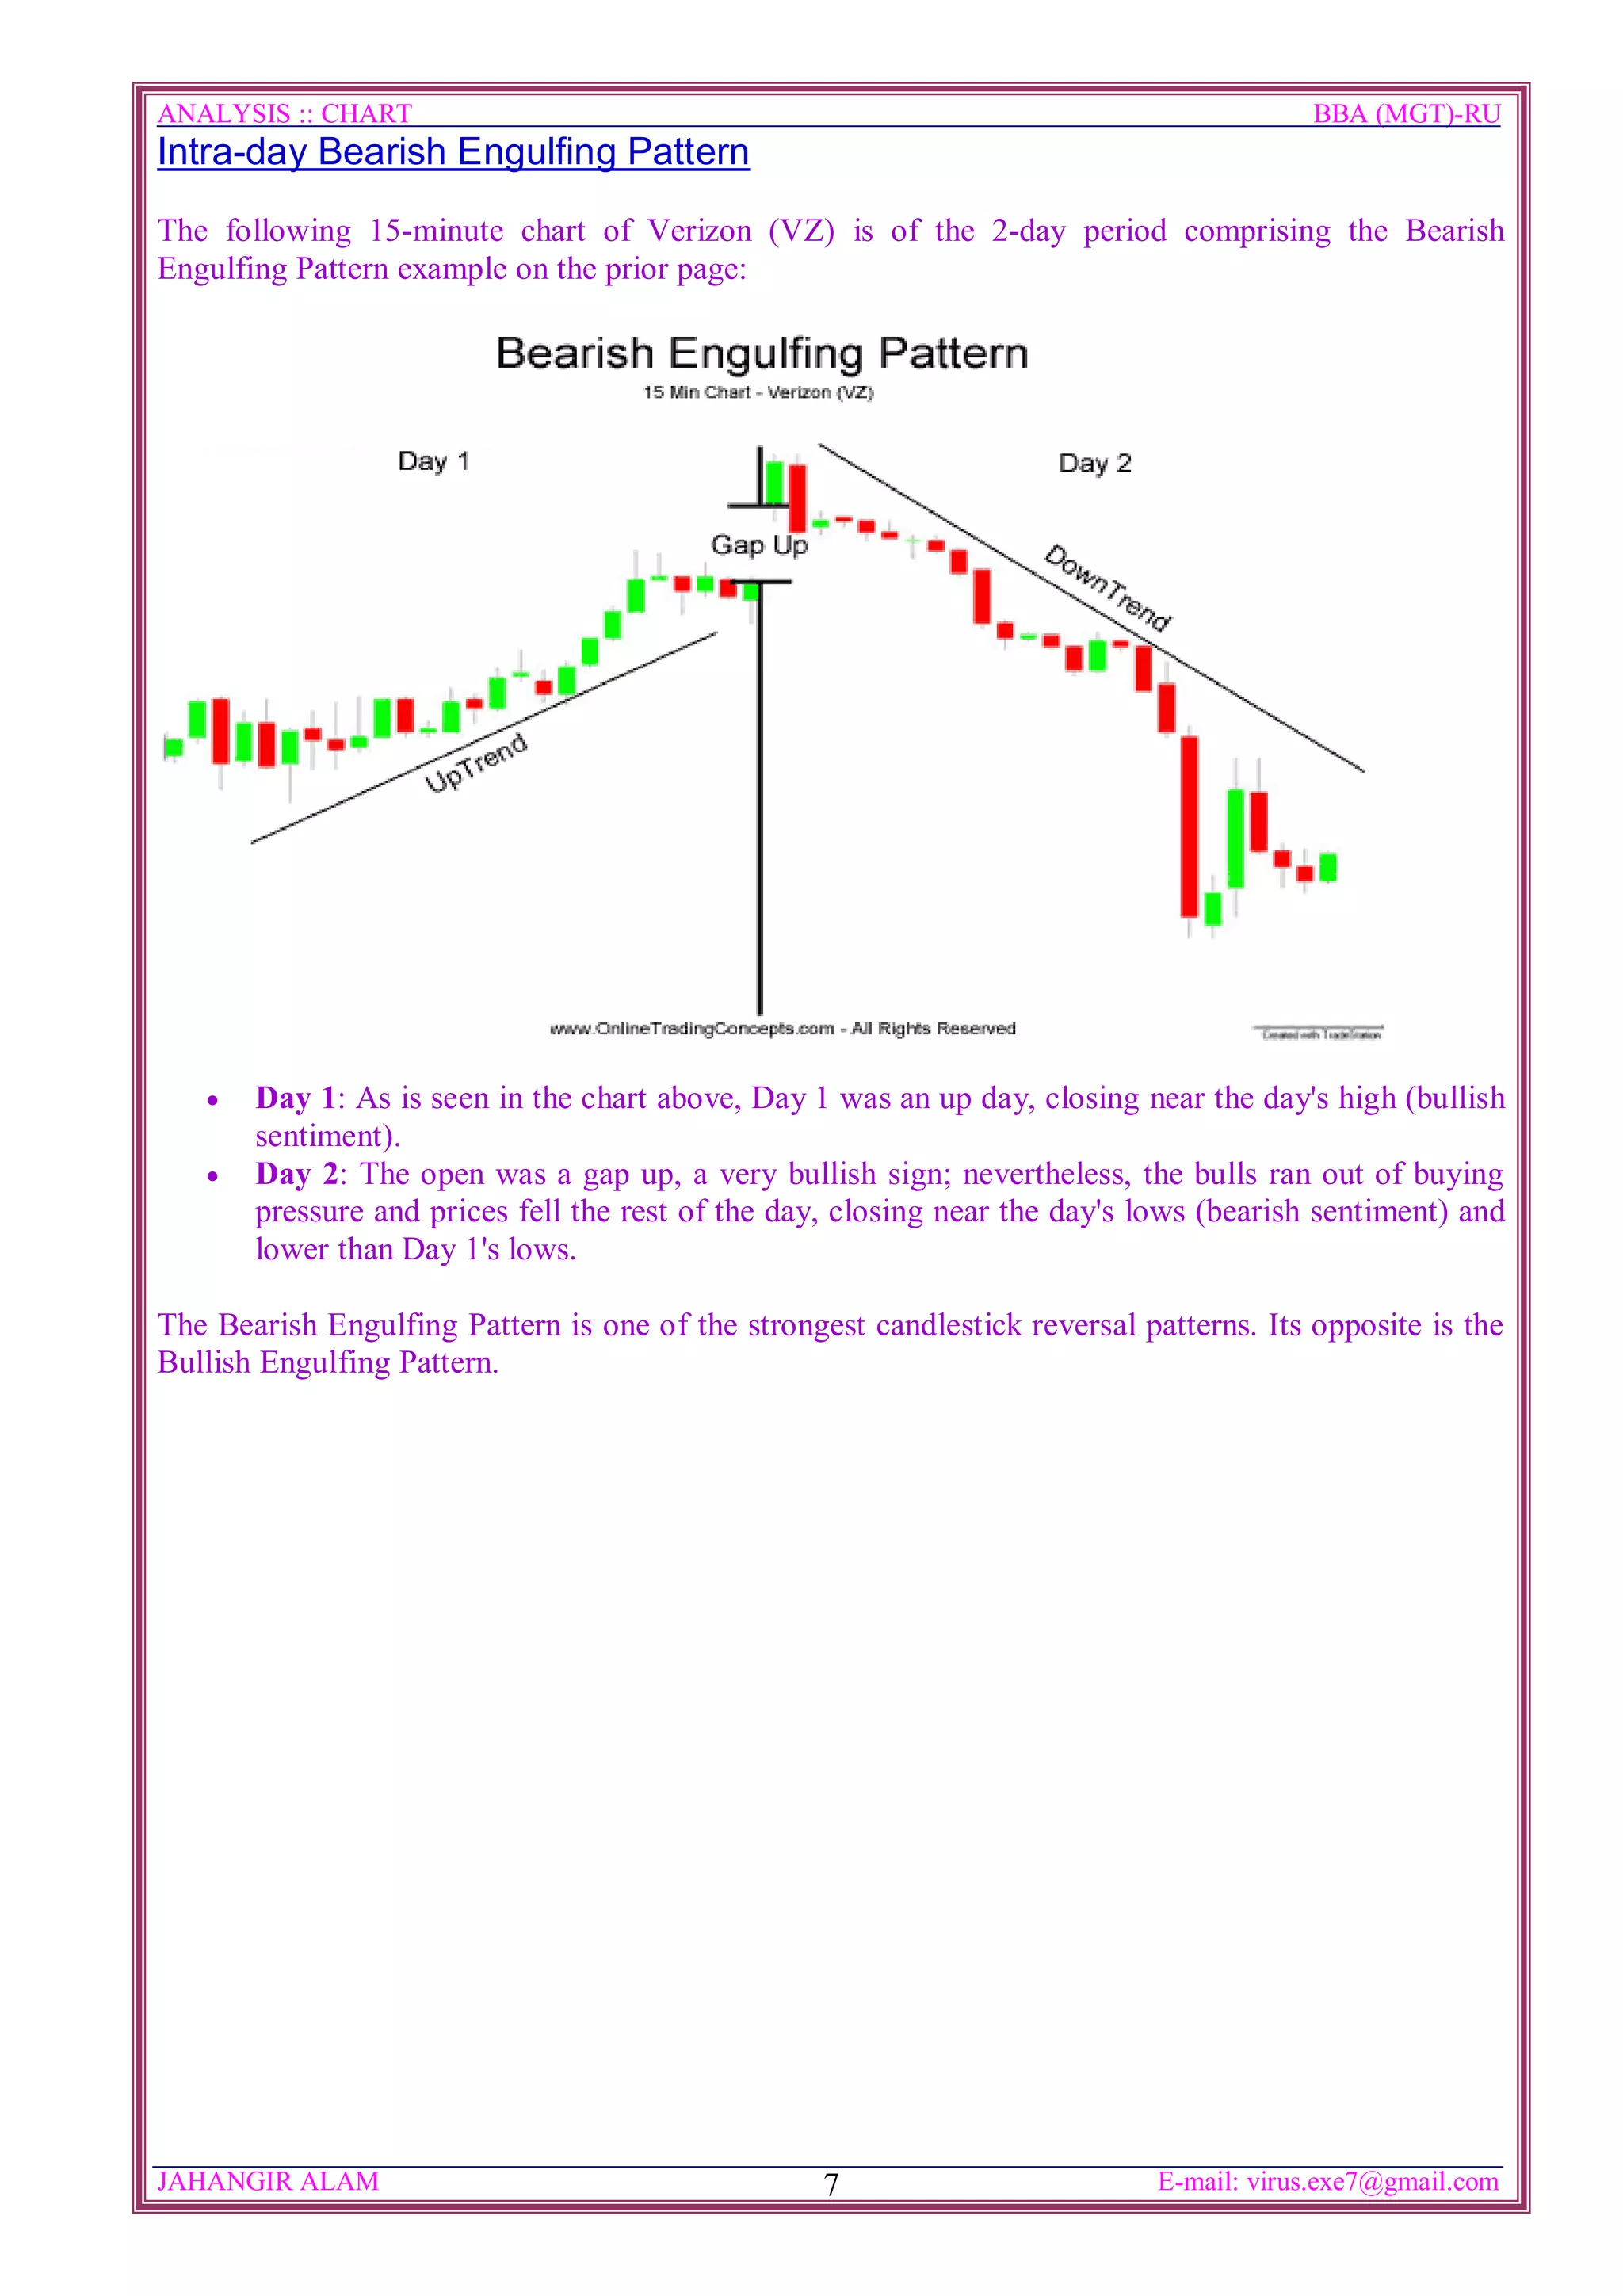
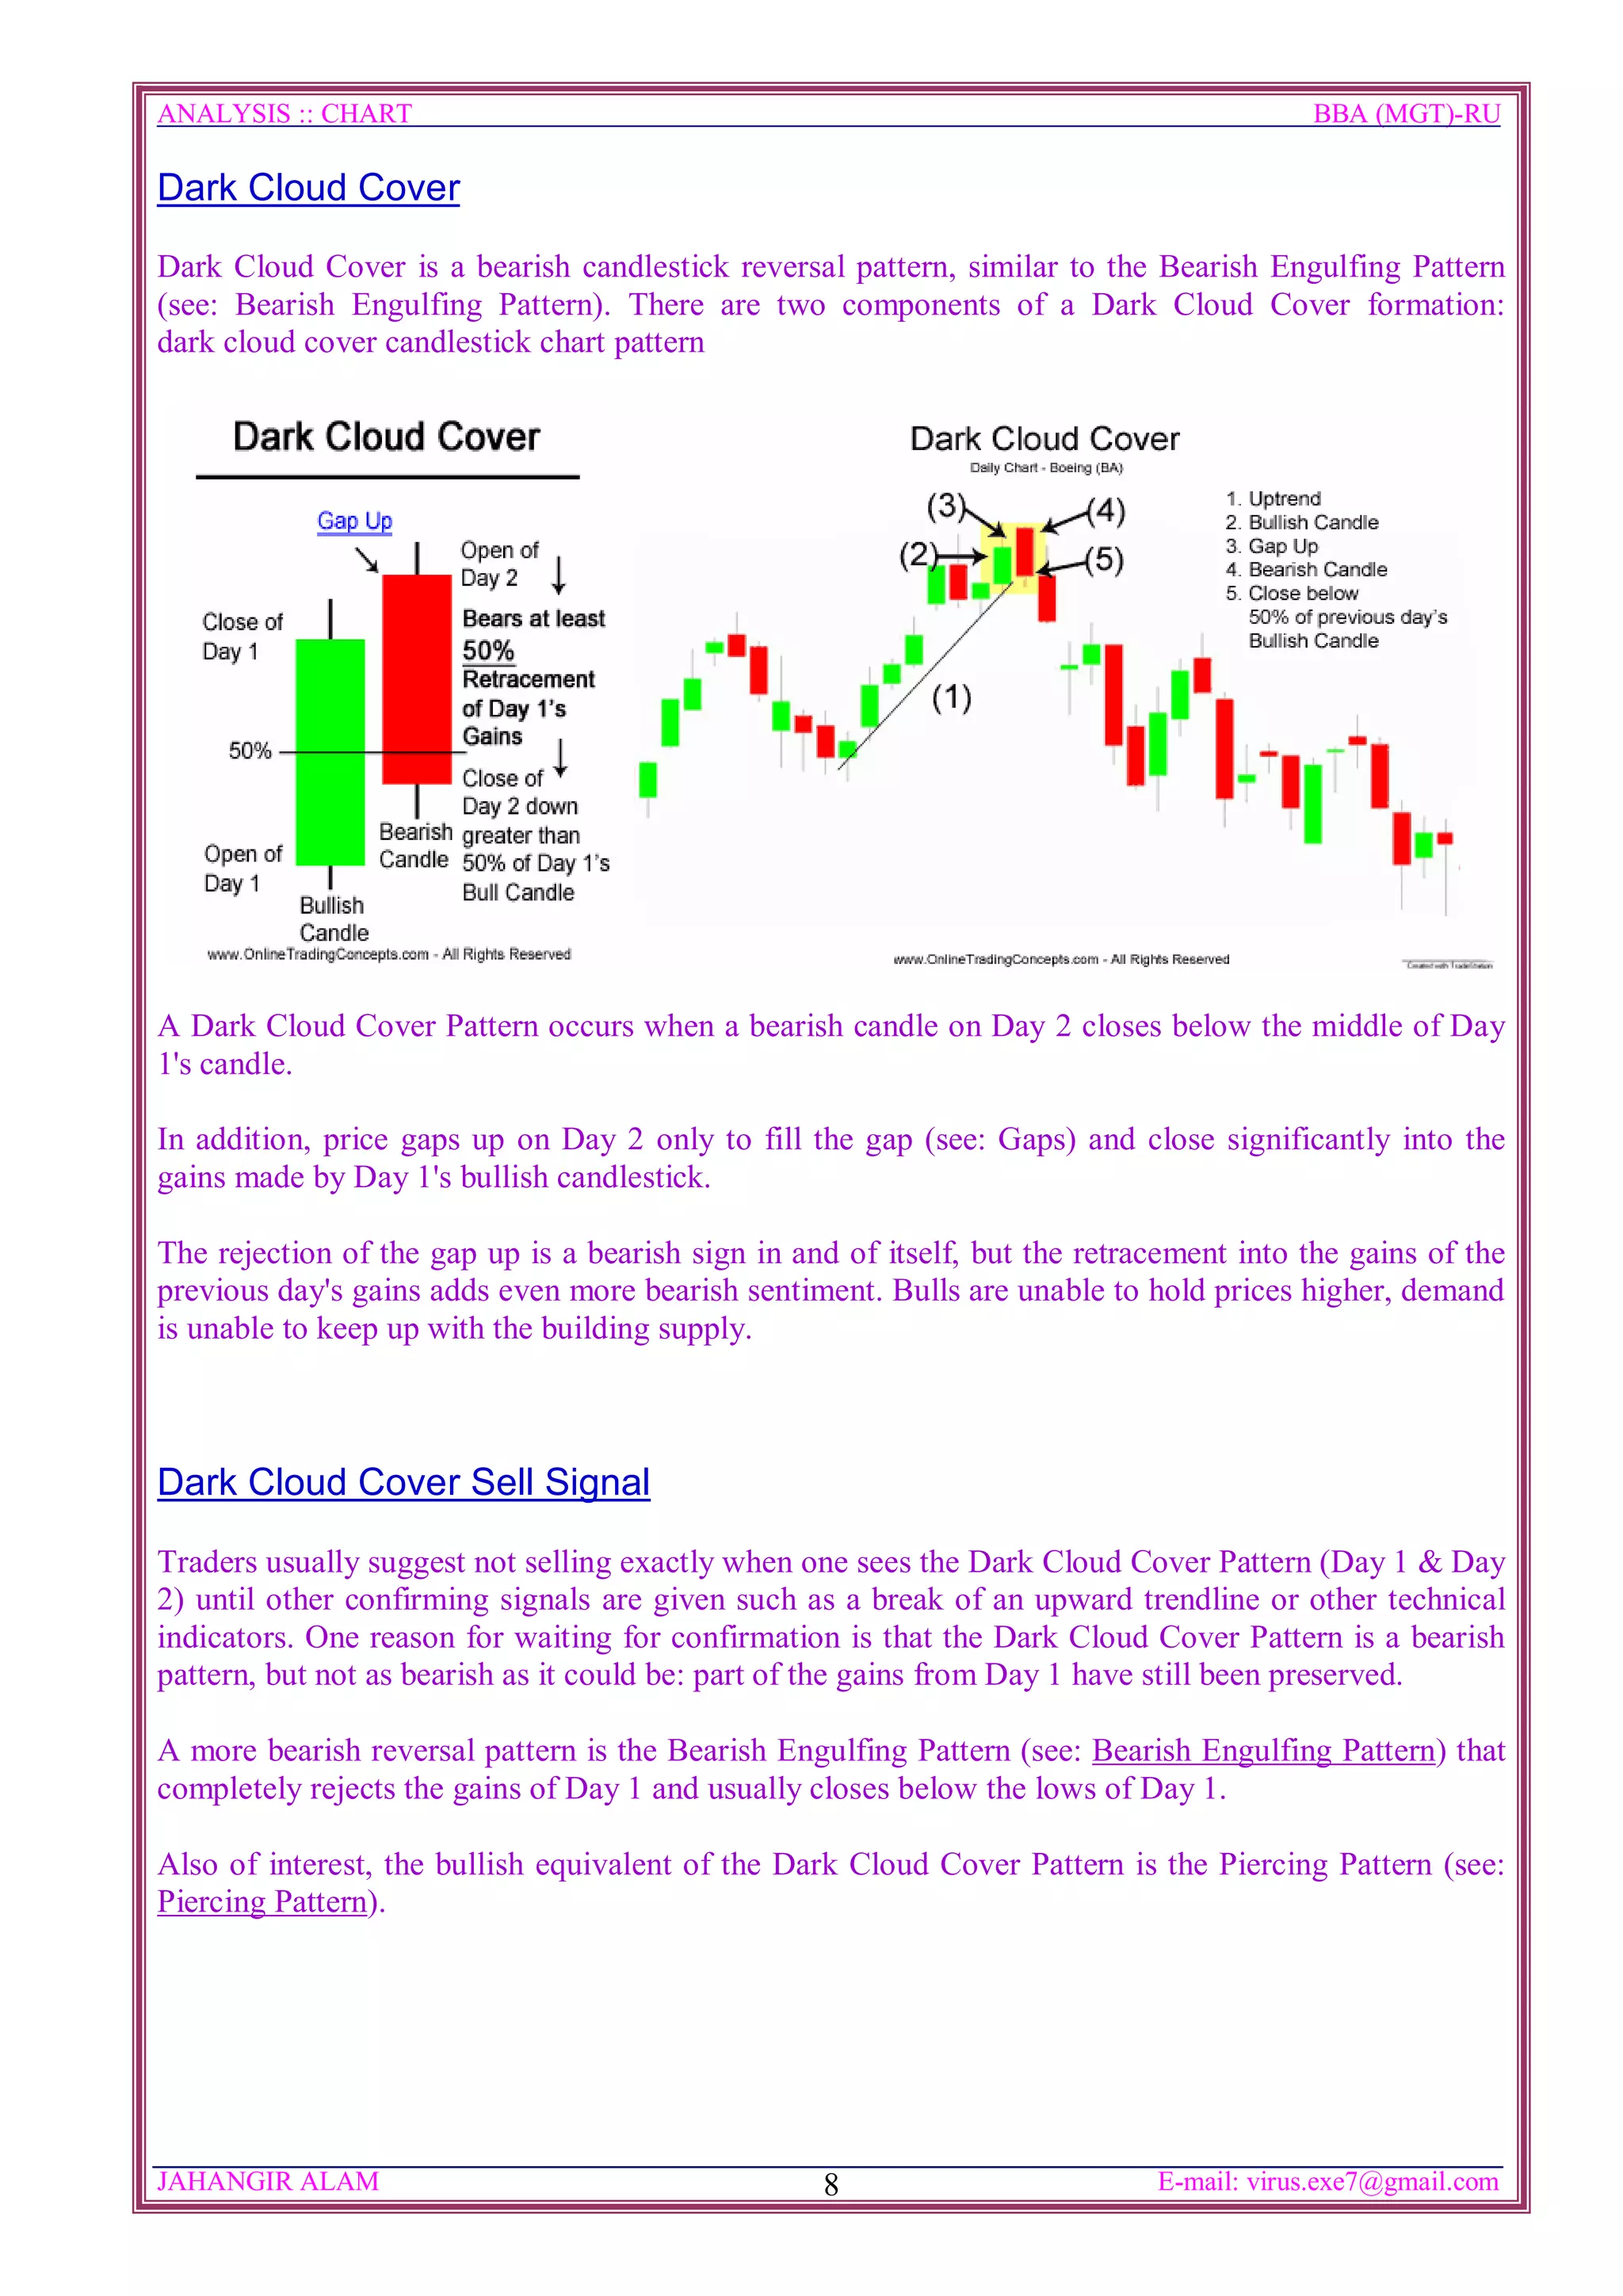
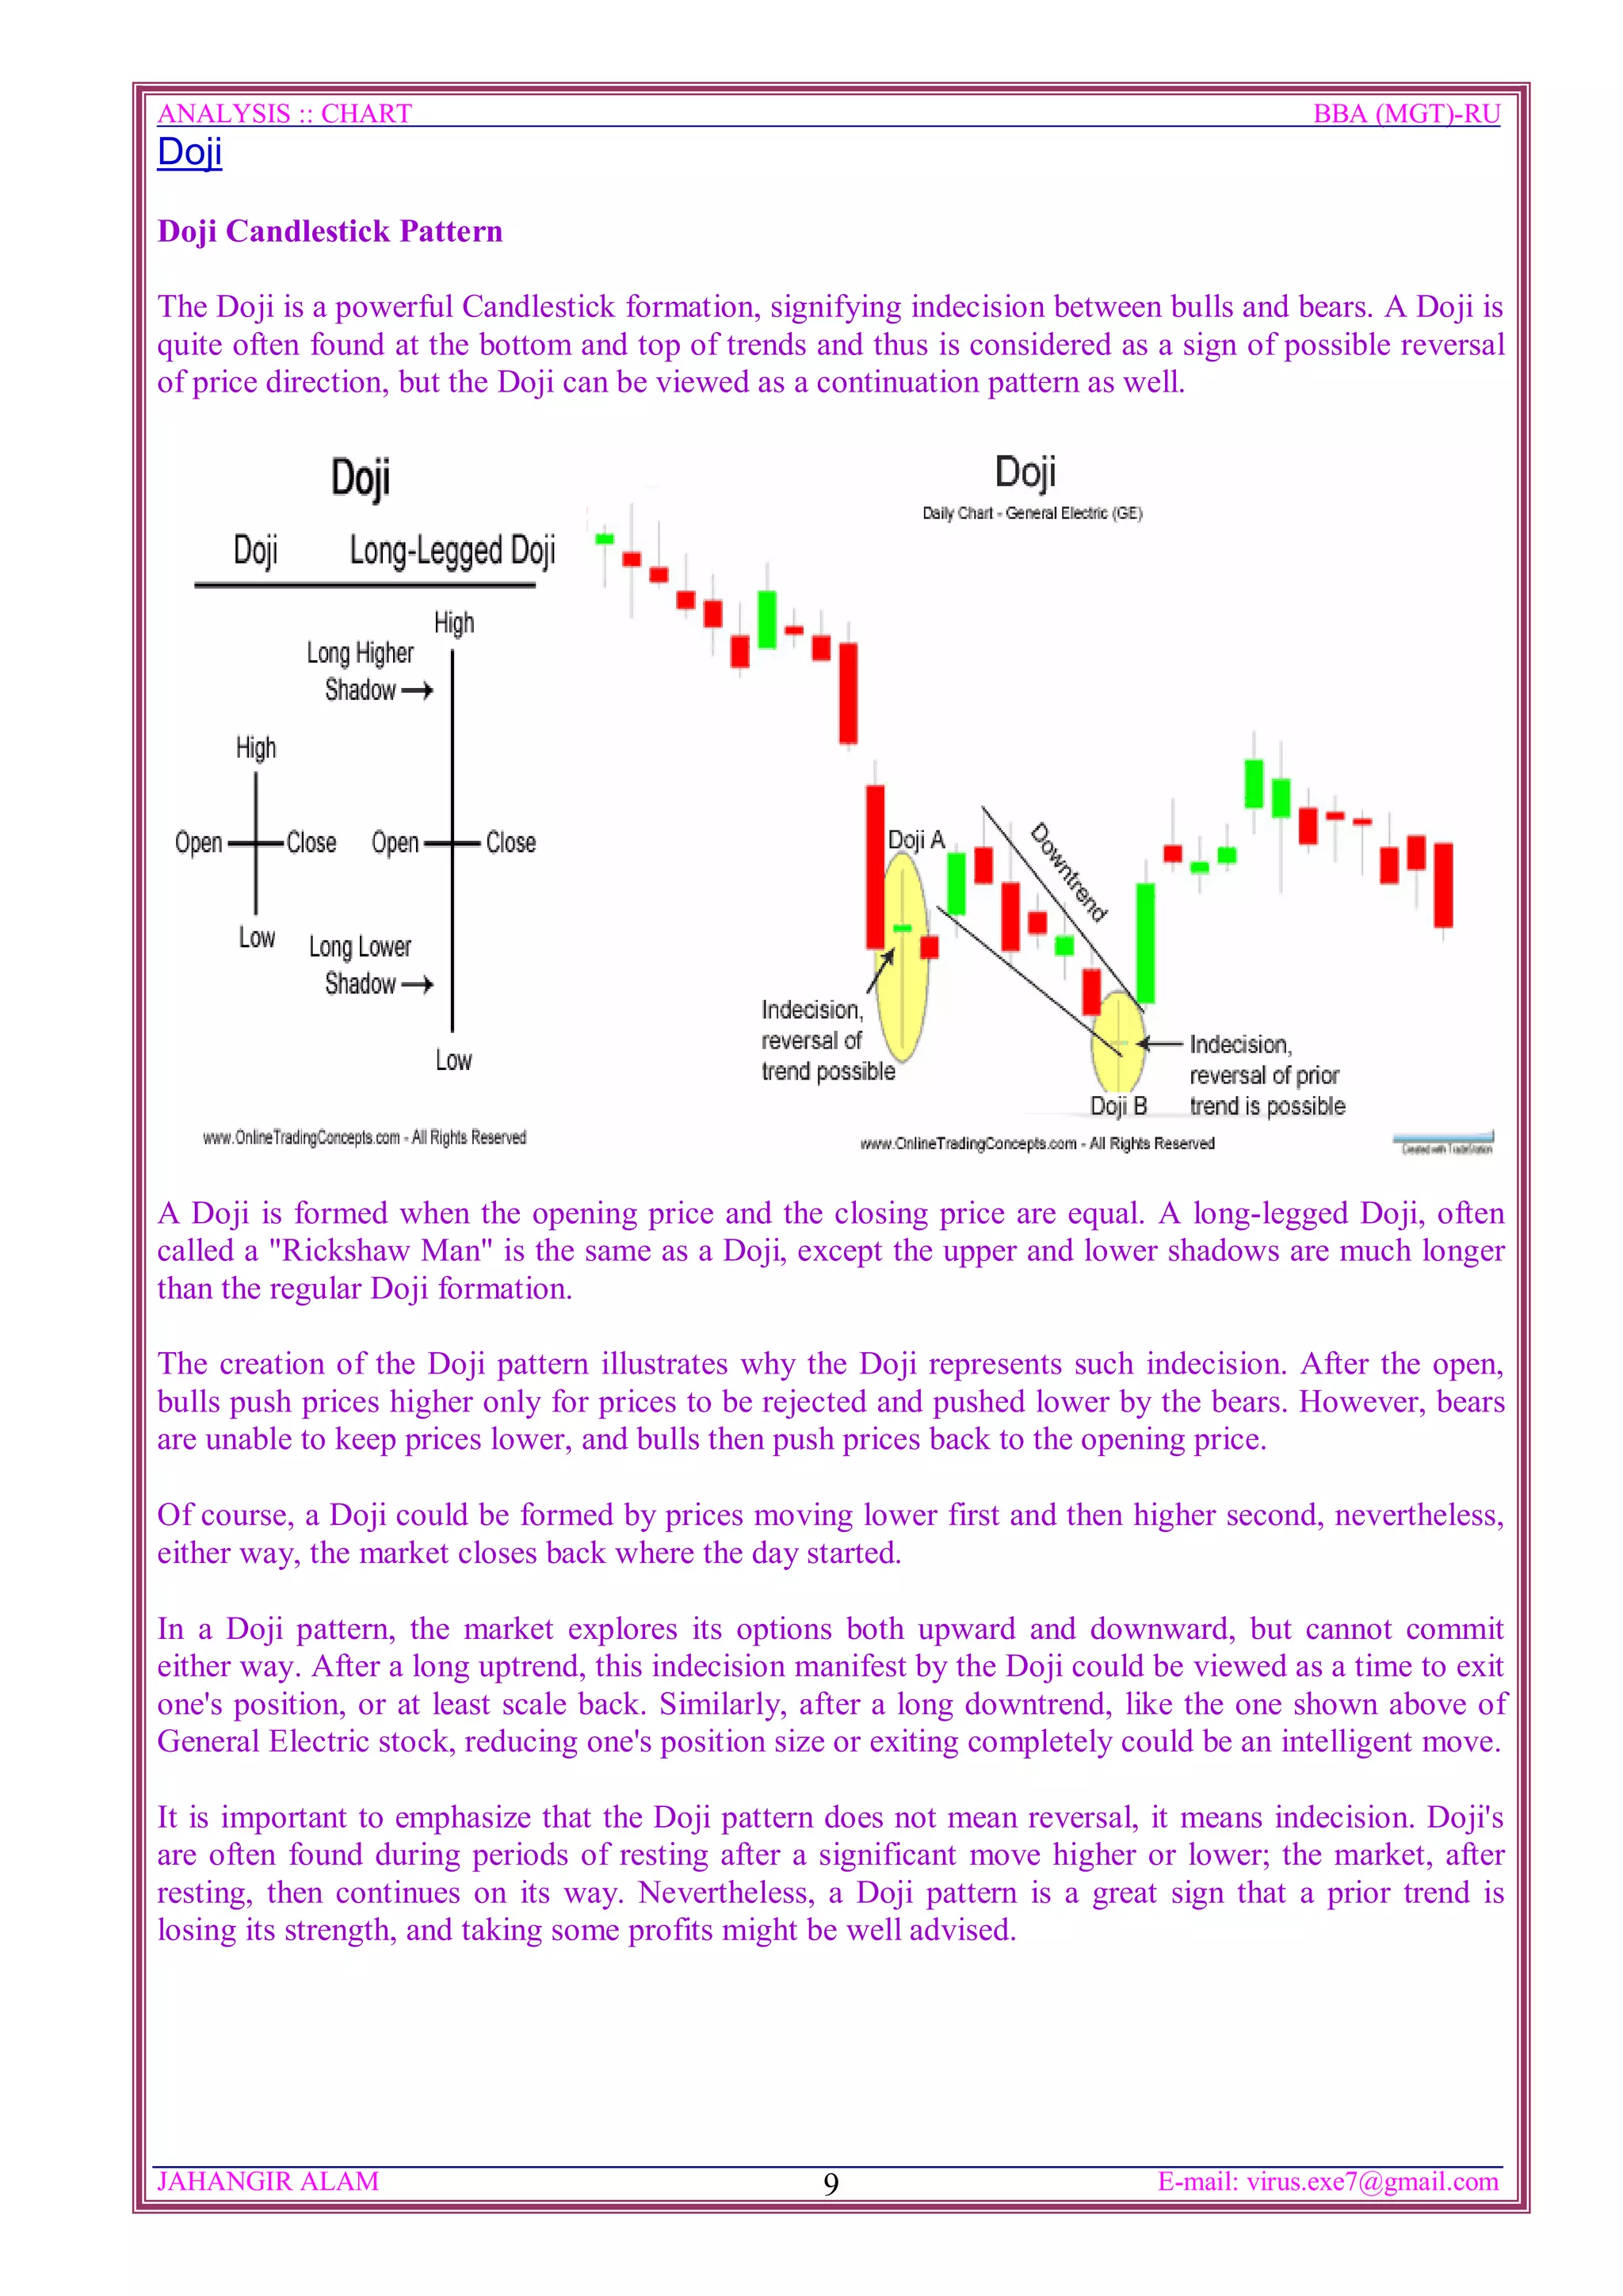
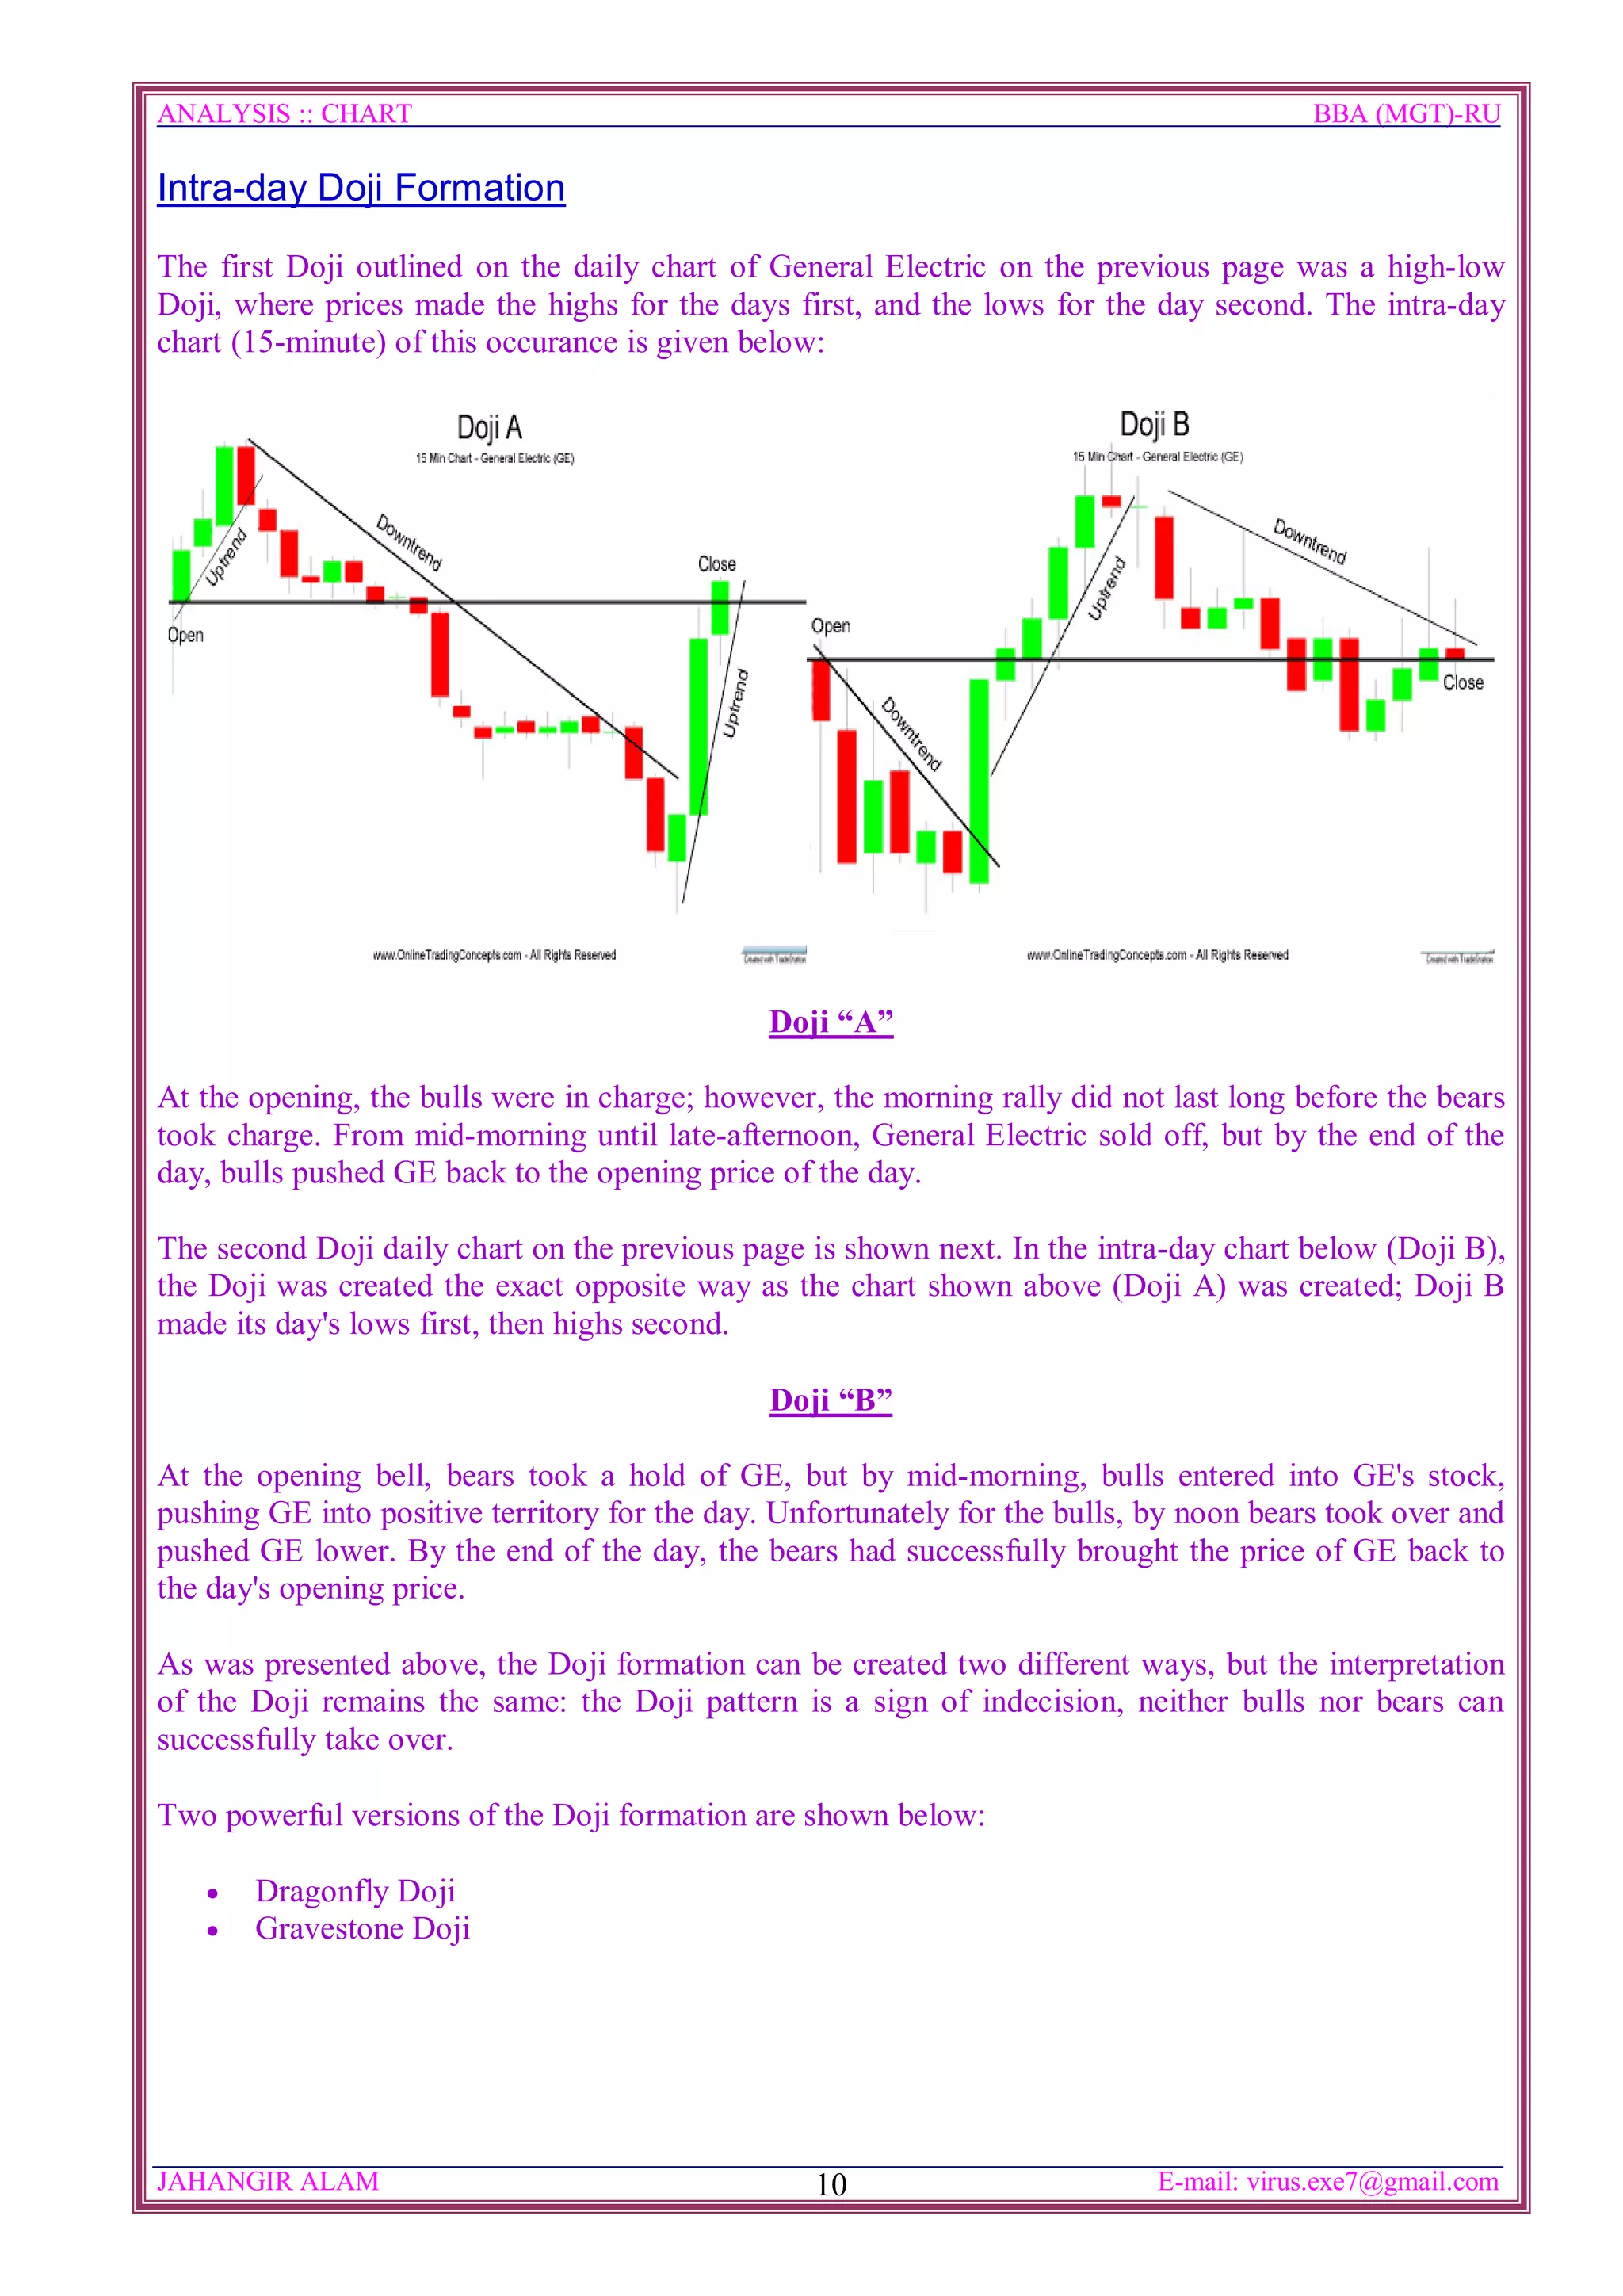
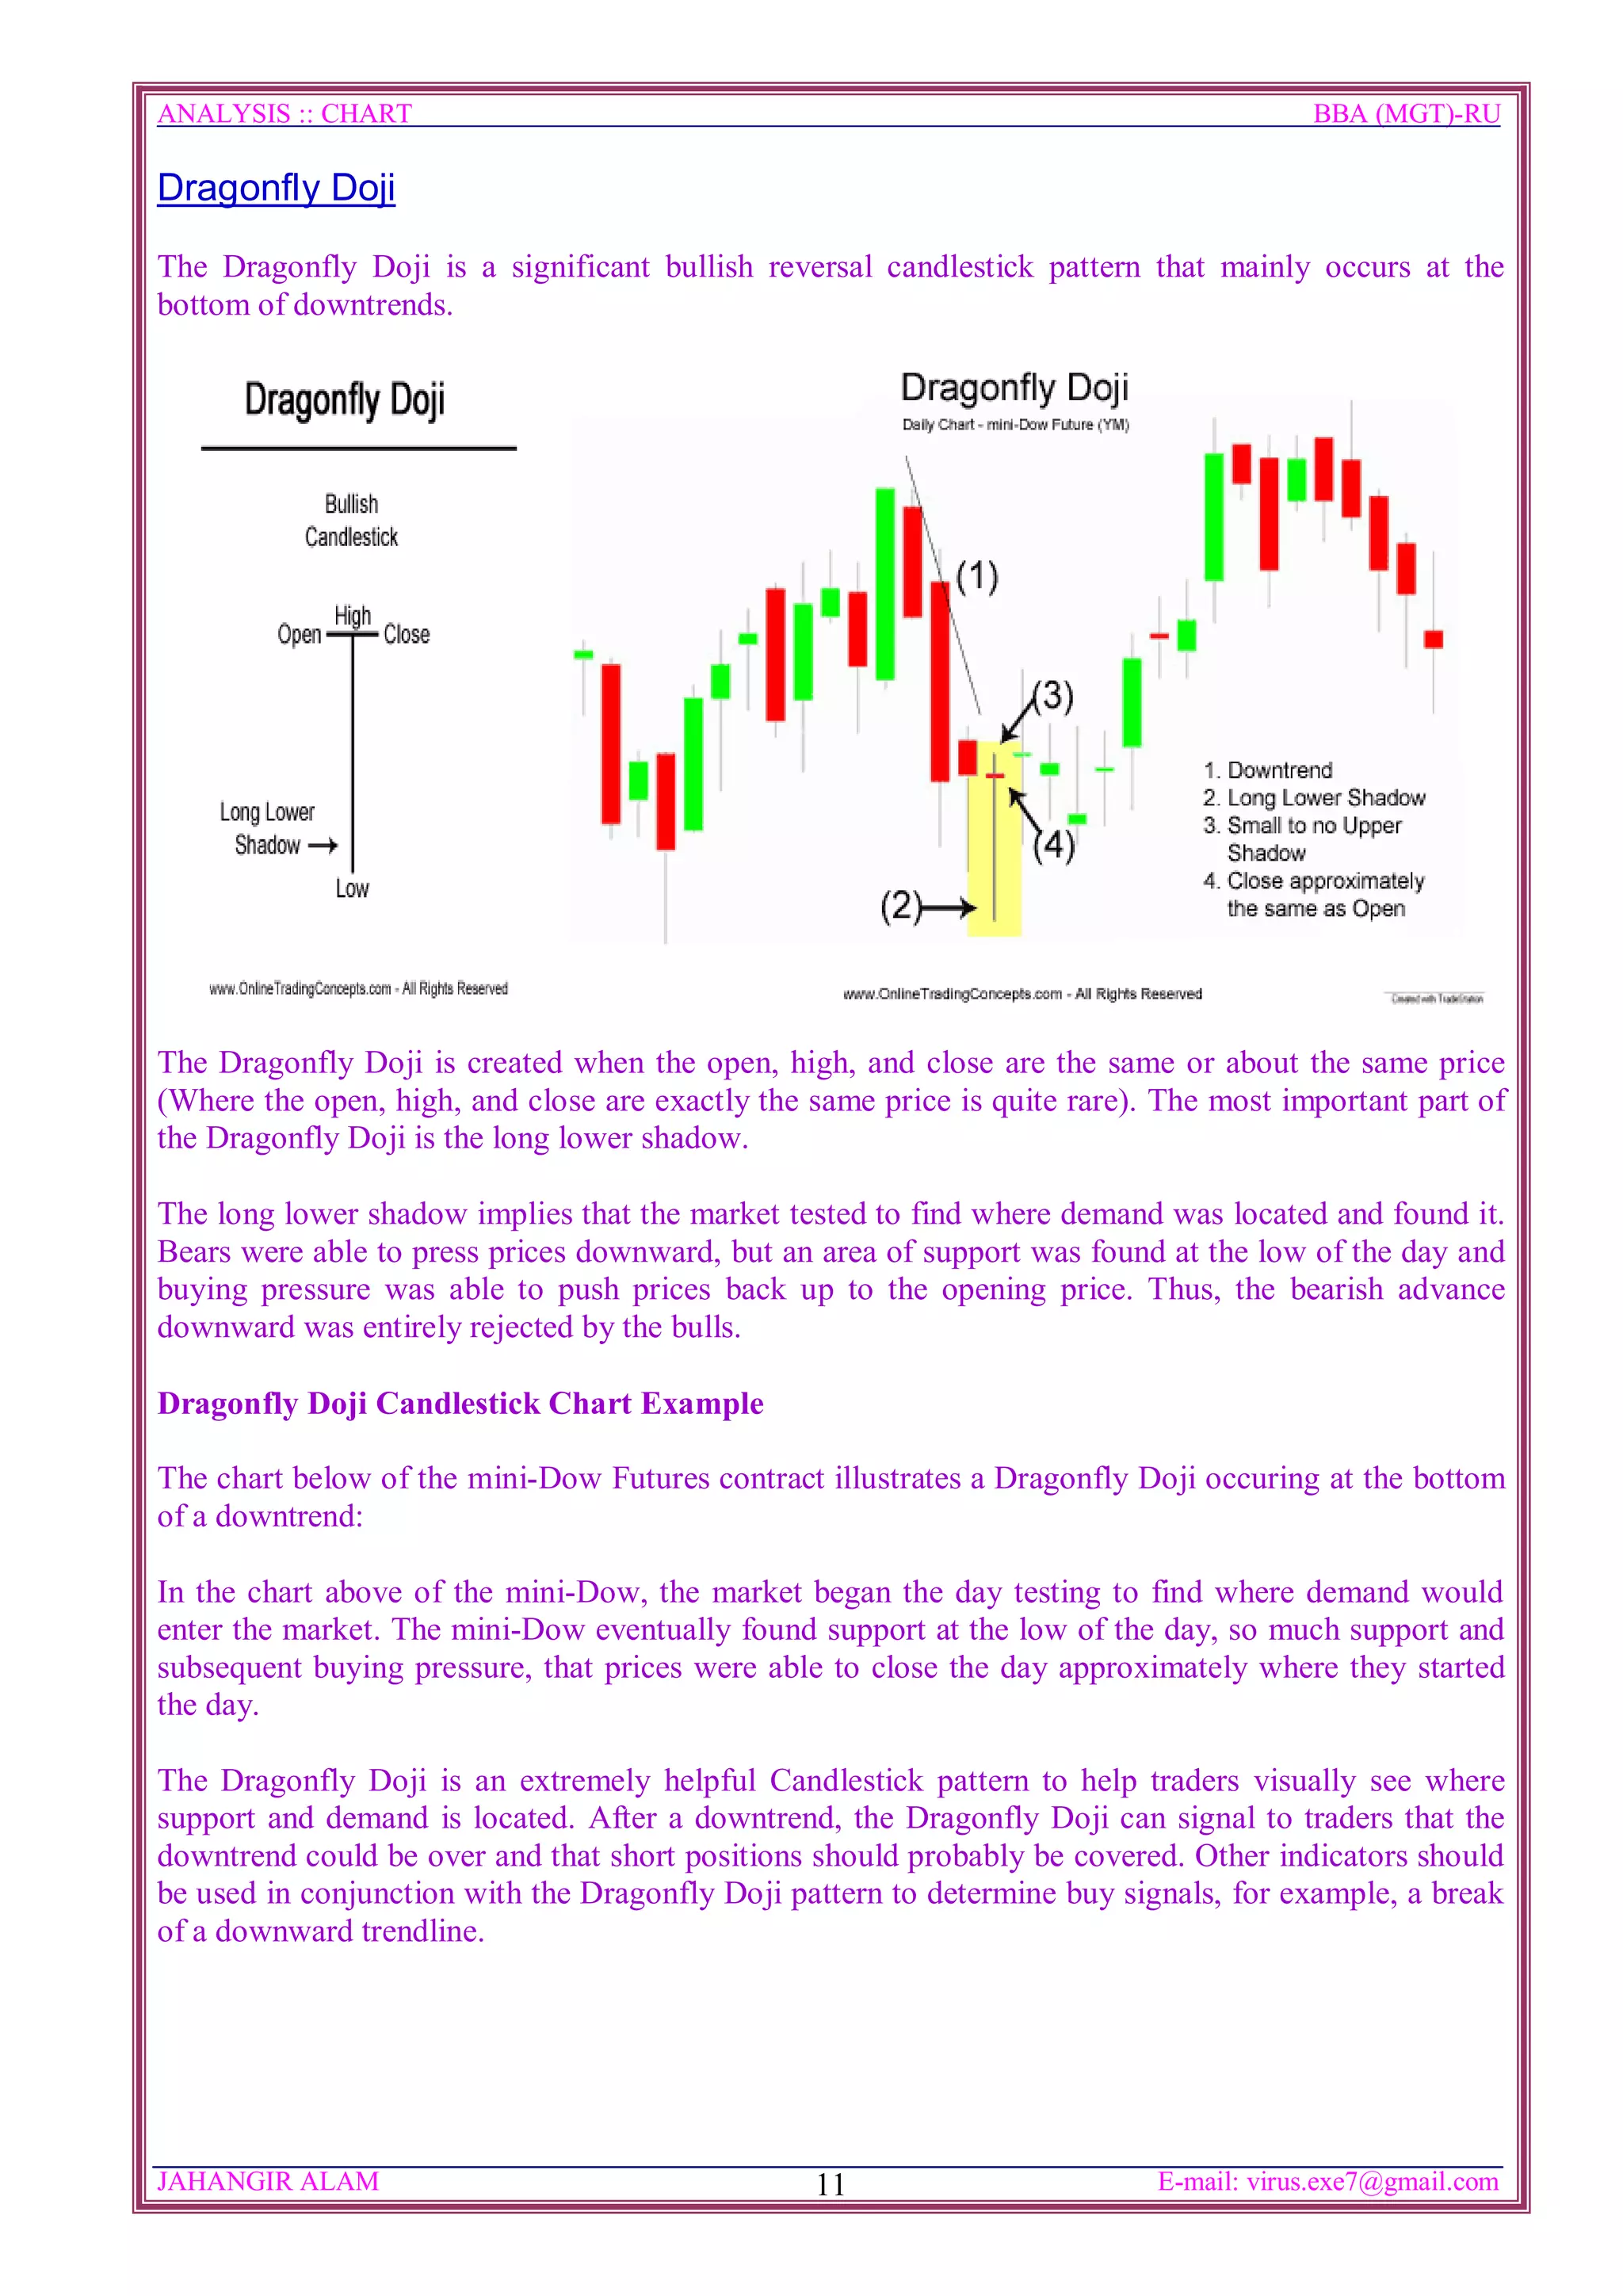
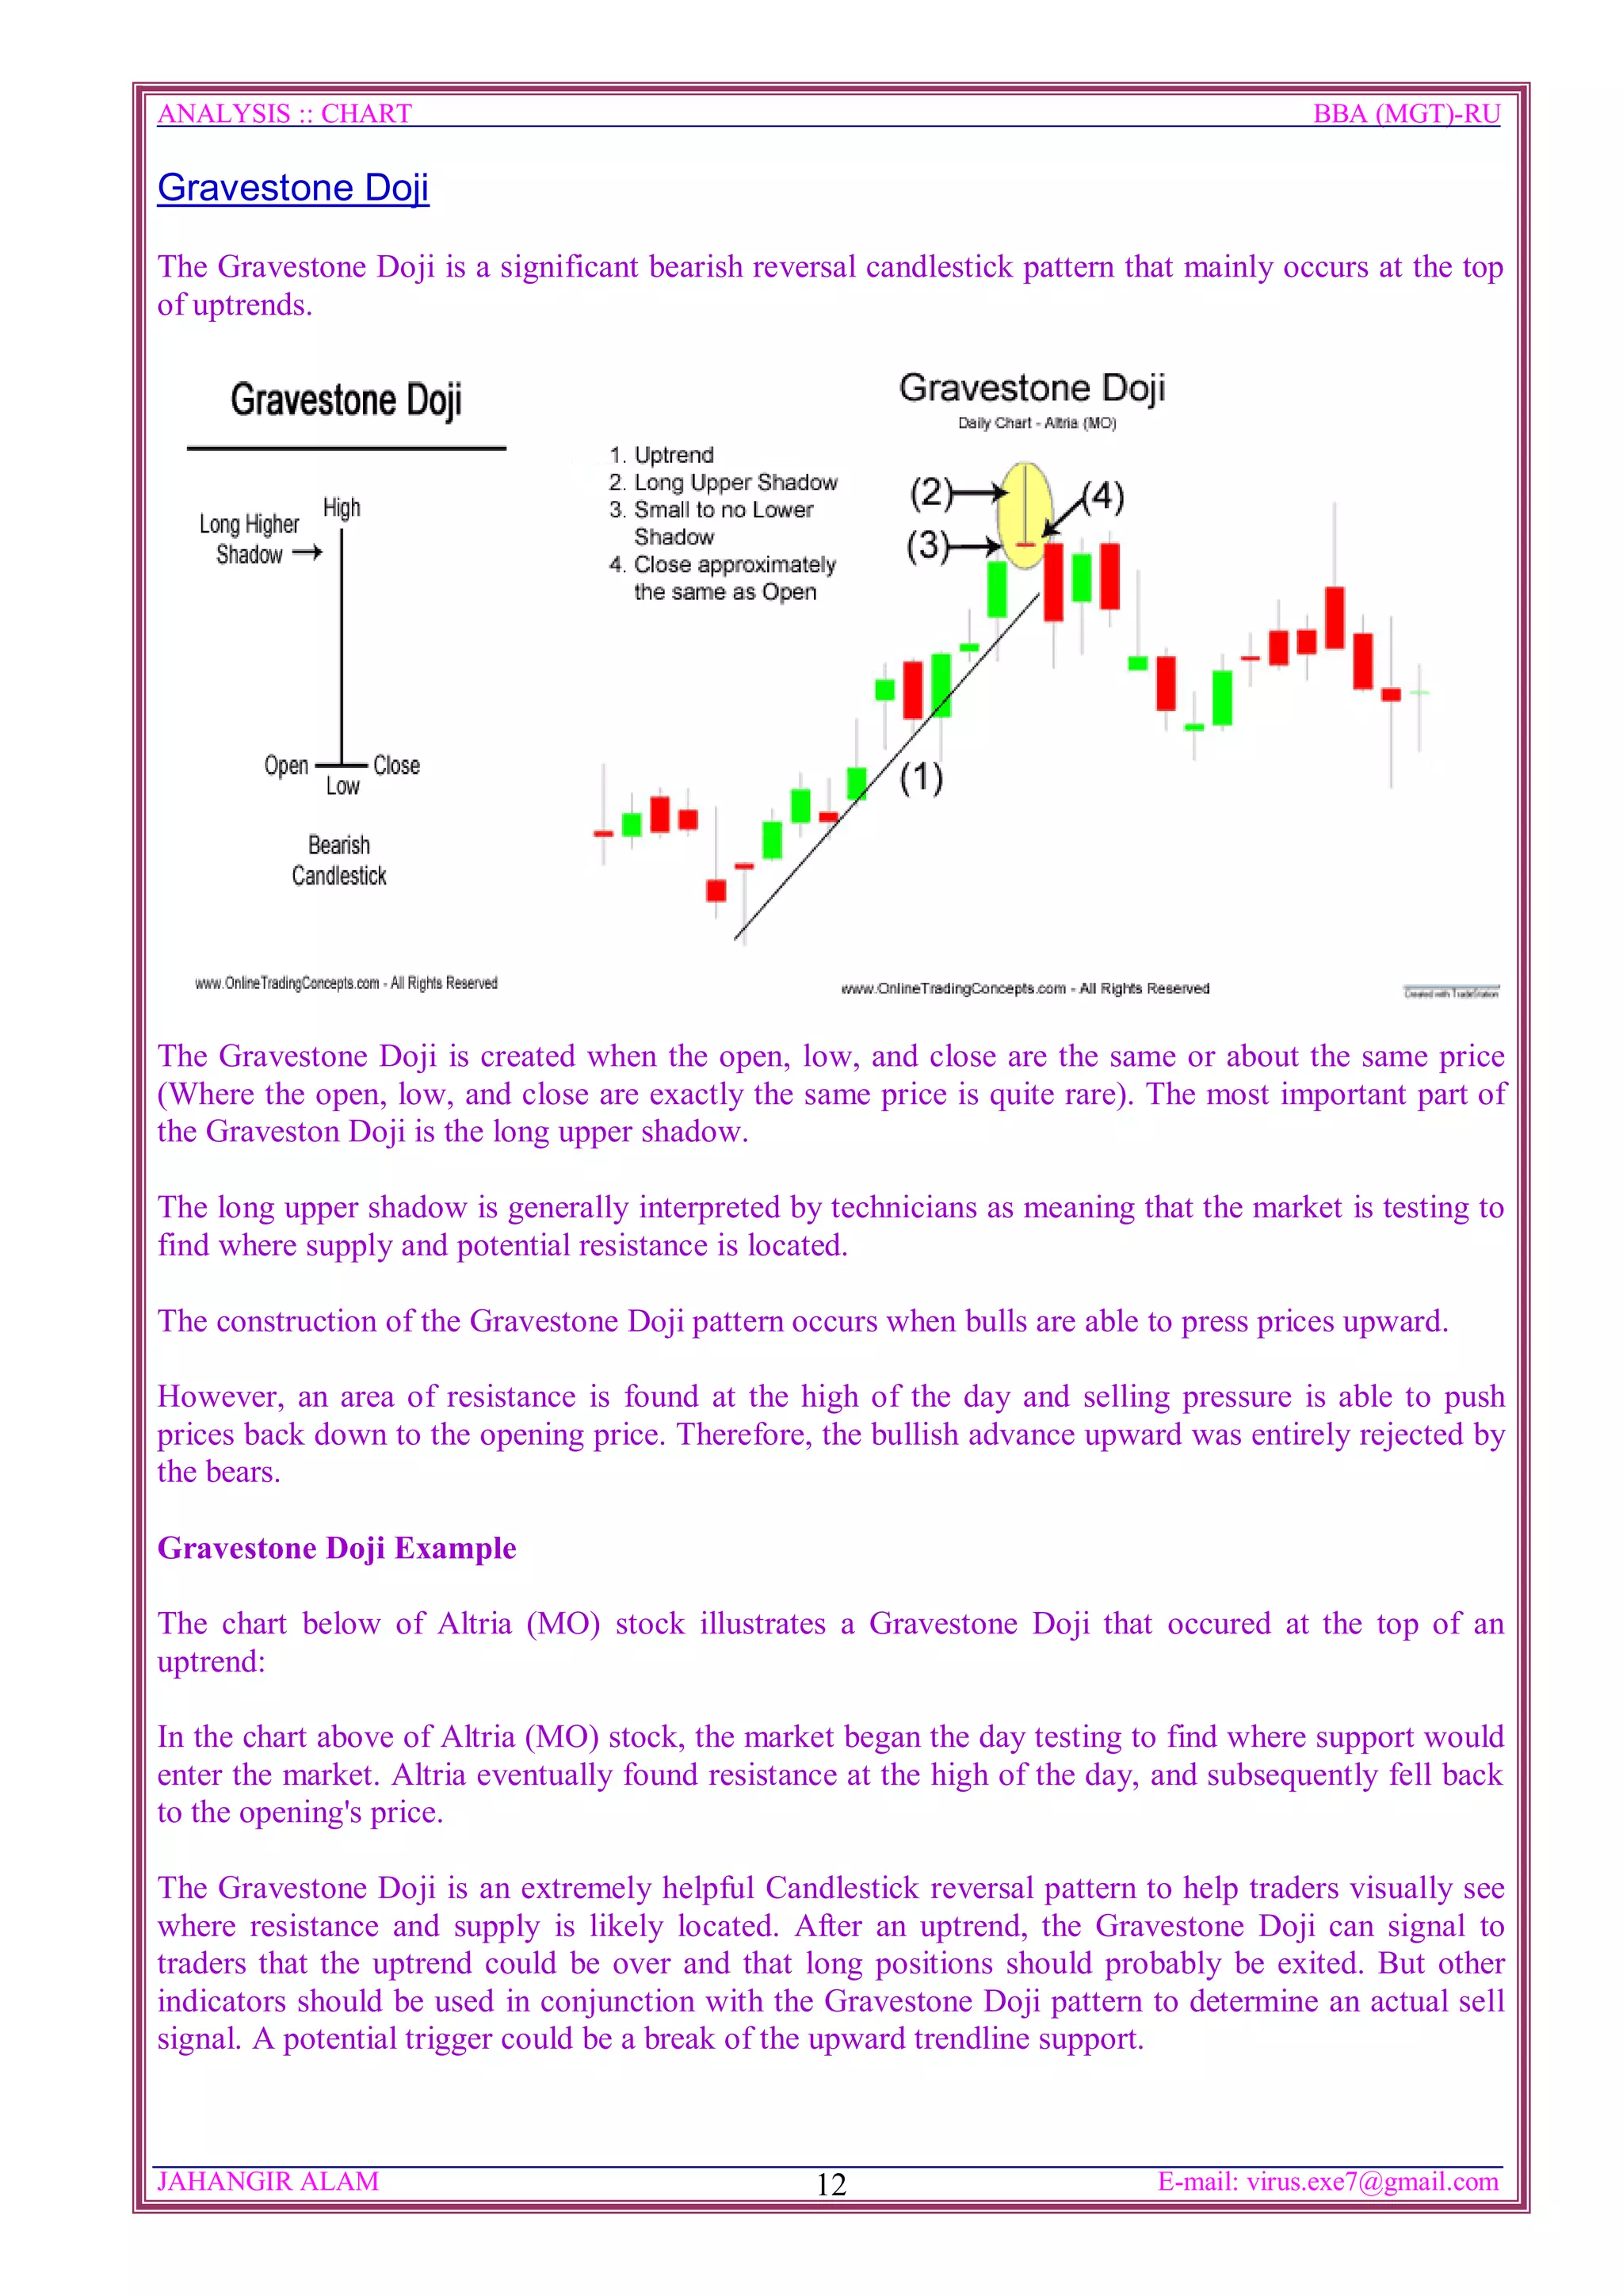
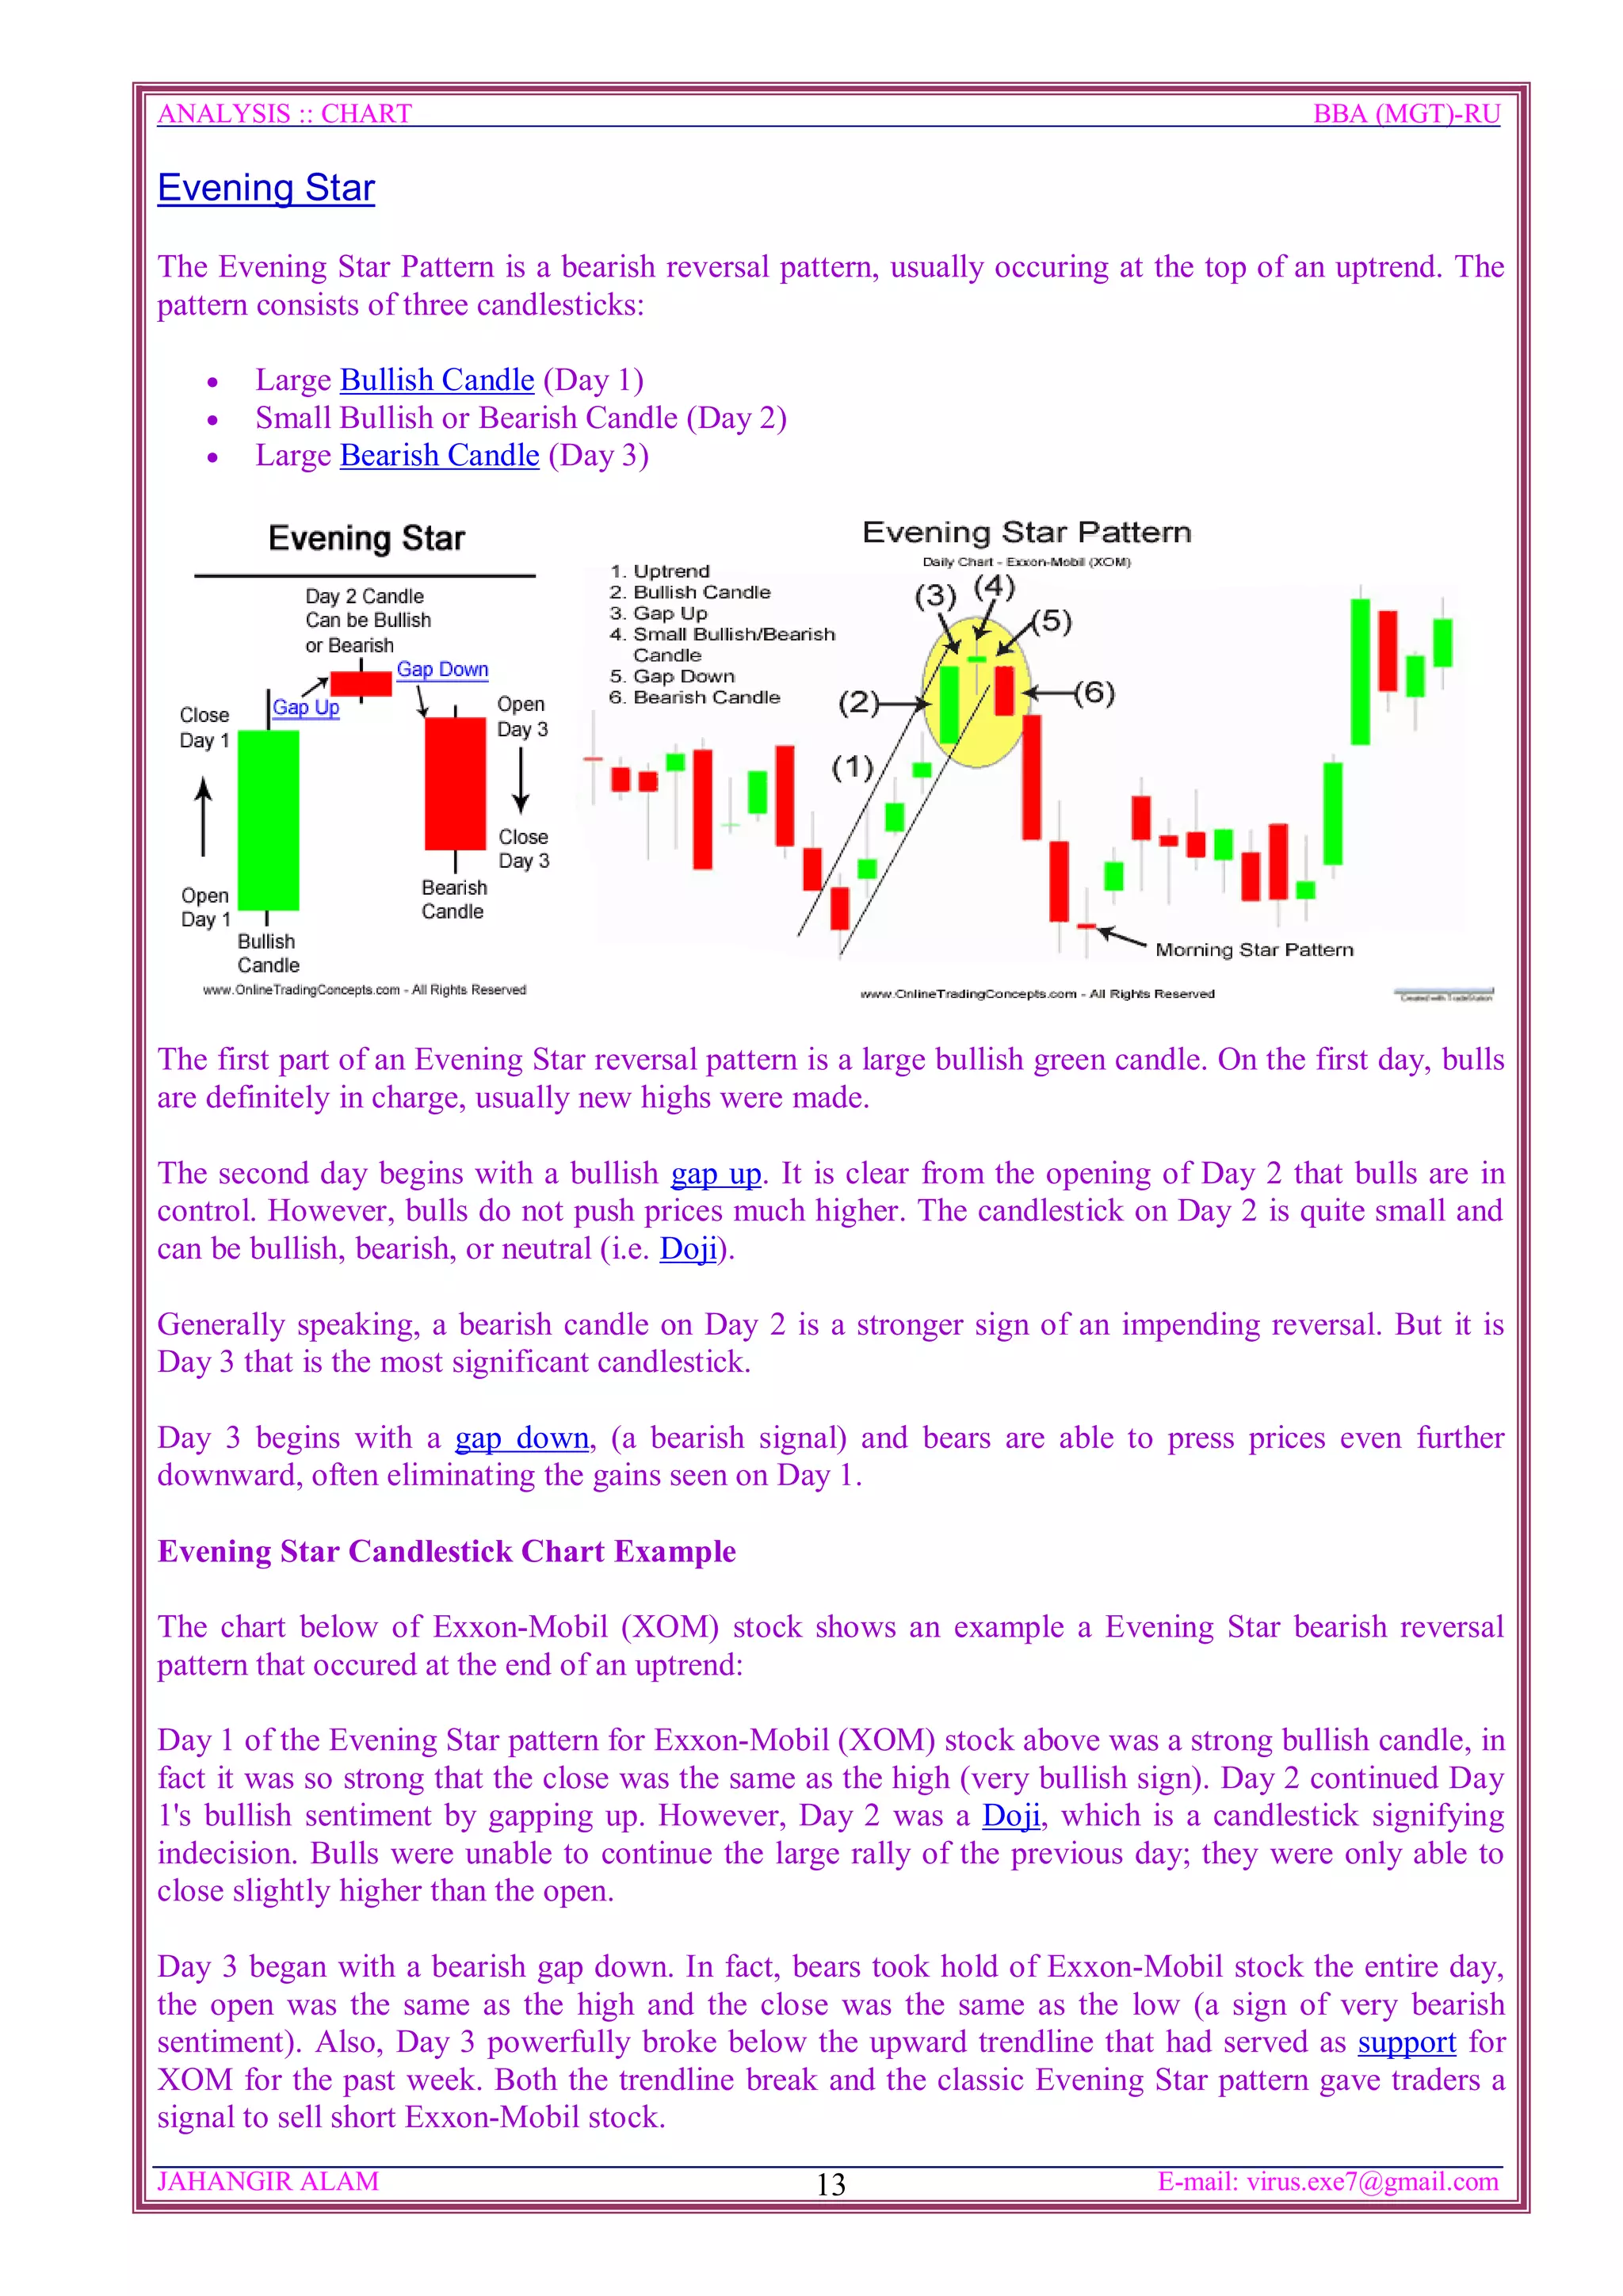
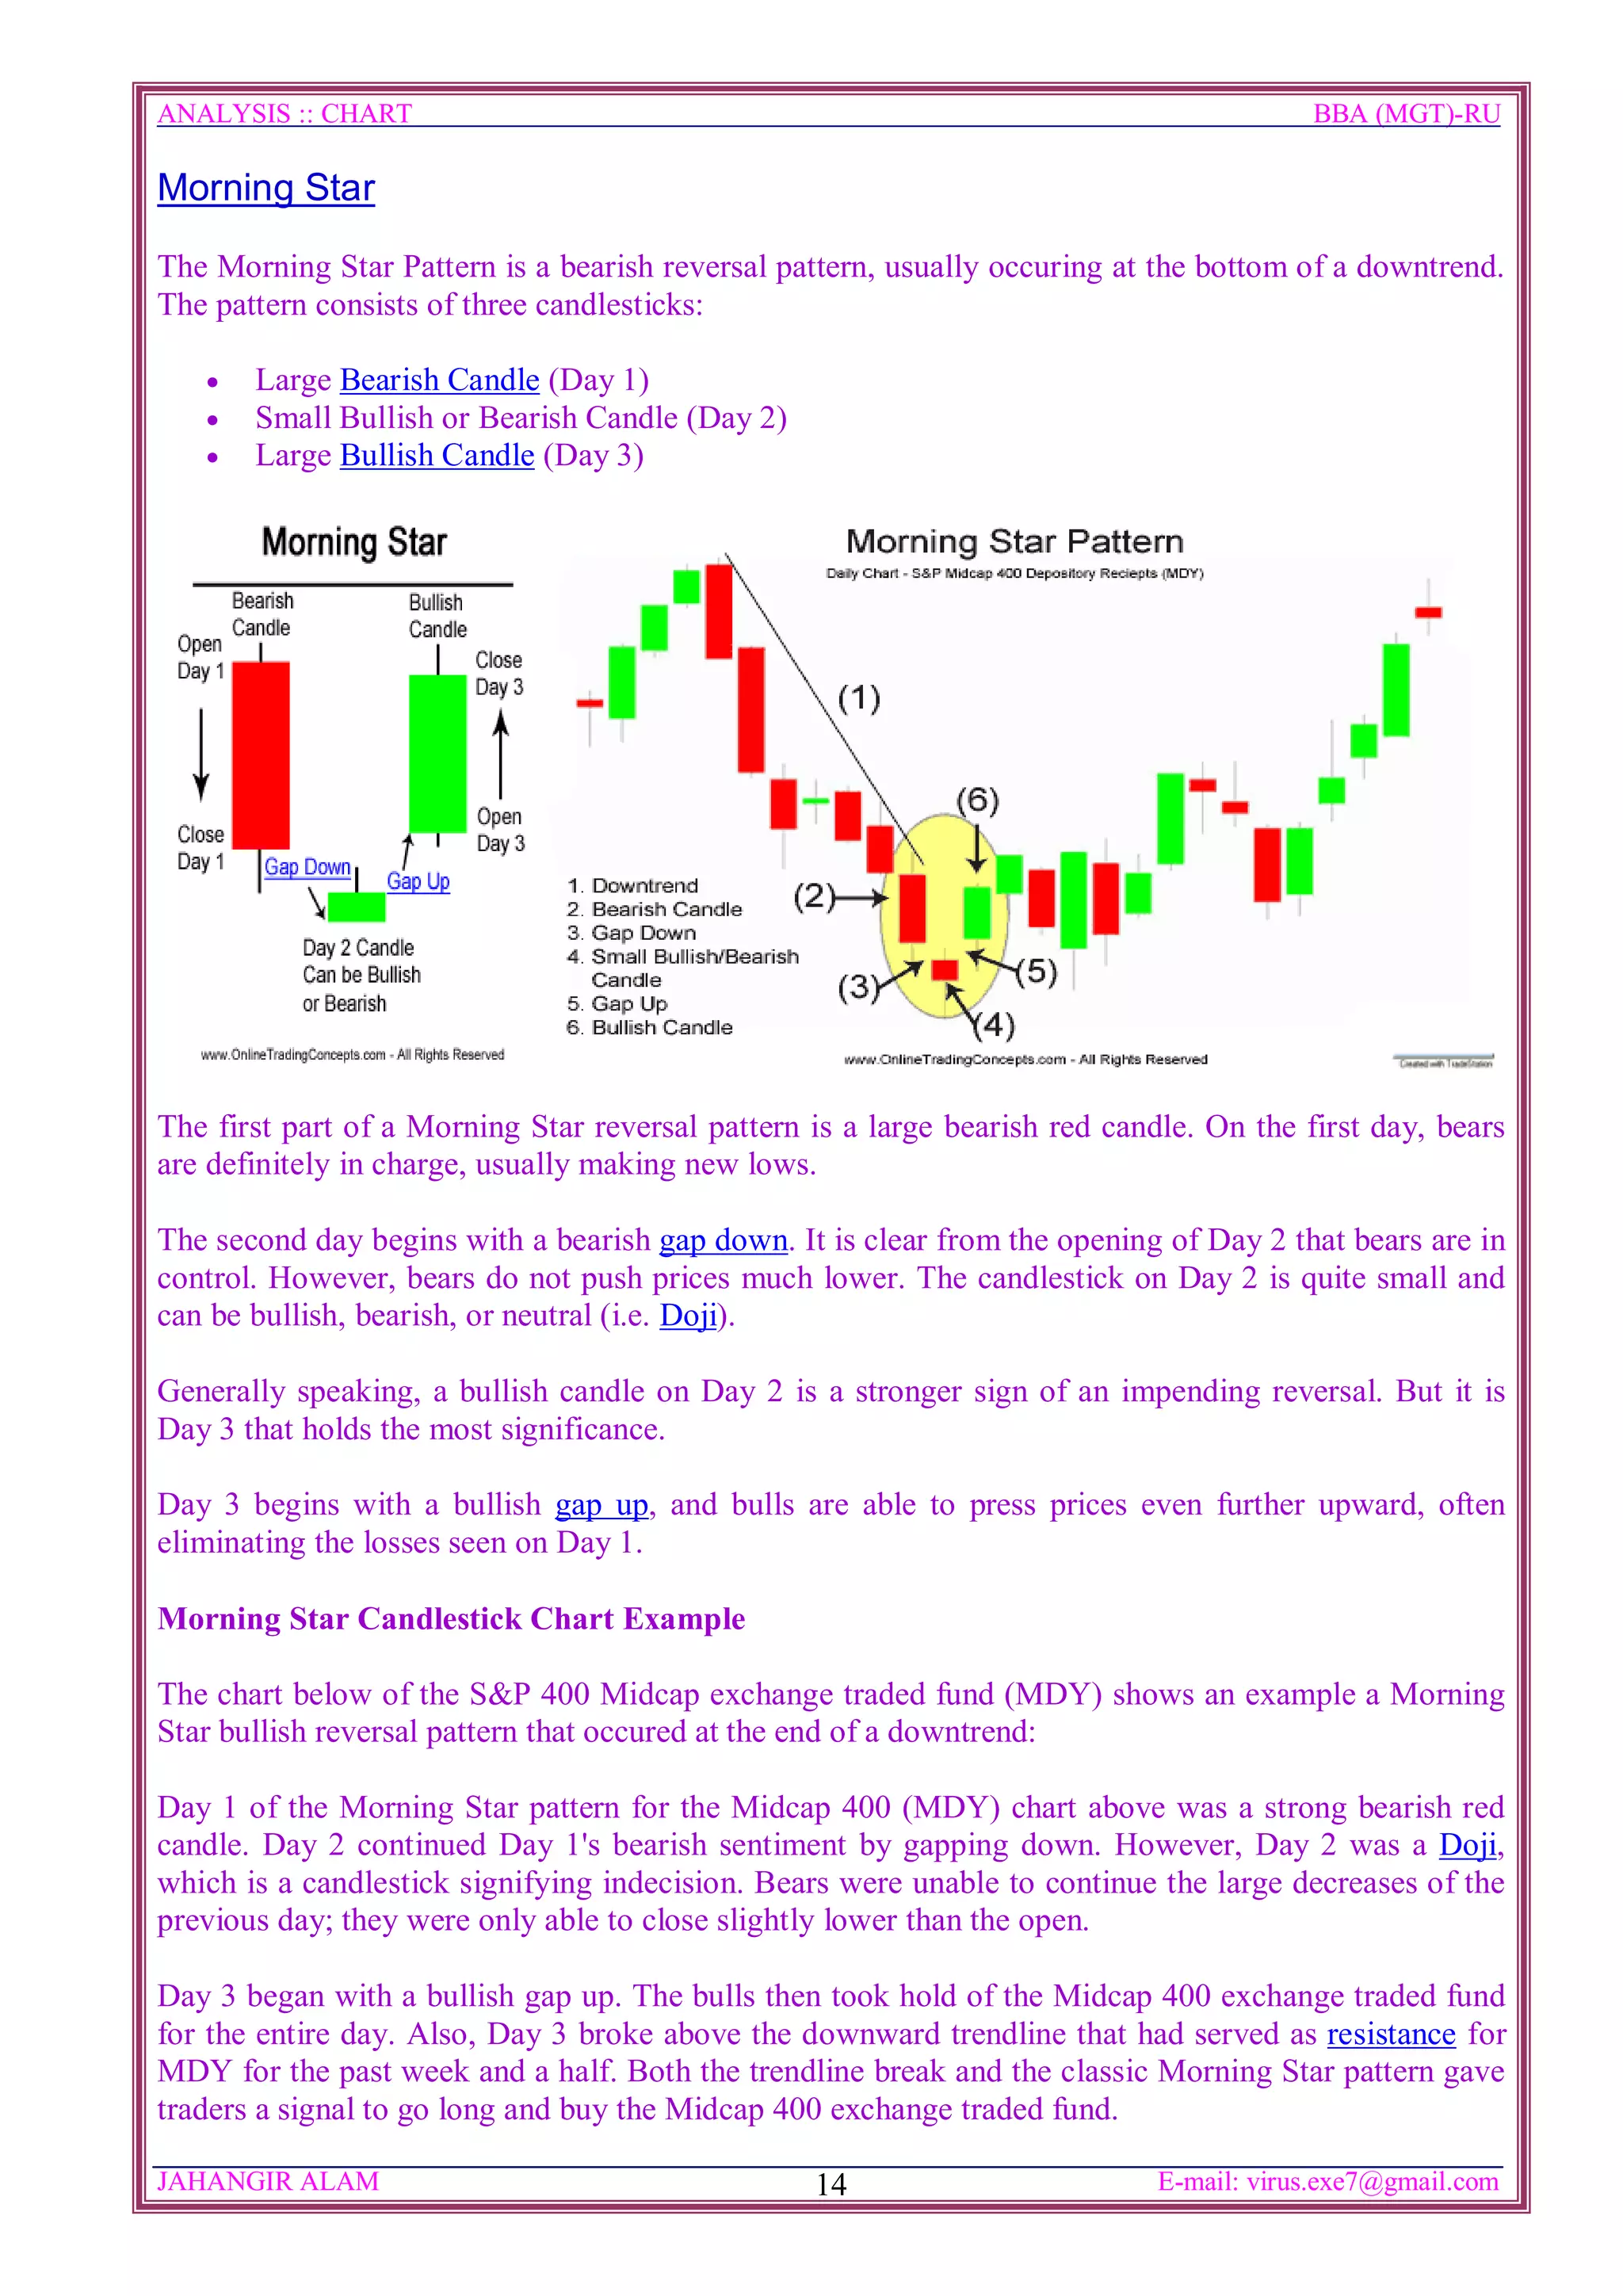
The document provides information about basic candlestick patterns in 3 paragraphs:
1) It defines bullish and bearish candlesticks and describes their basic parts: real body, upper/lower shadows.
2) It introduces common candlestick patterns like bullish/bearish engulfing, dark cloud cover, Doji, and discusses their meanings as reversal or continuation signals.
3) It provides an example of a dragonfly Doji and gravestone Doji, powerful bullish and bearish reversal patterns respectively. The document is intended to educate on basic candlestick analysis.
Would you like to learn secrets of price action trading which is used in every day trading by a 15 years trader? Continue reading on to learn real examples of how price action trading works on Forex, stock futures and gold charts!
An overview of technical analysis and its common techniques (Candlestick , MACD, Parabolic SAR, RSI, Bolinger Bands etc) - given to brokers and managers of Nepal Derivative Exchange (NDEX) by Mr. Sohan Khatri (Resource person - Management Association of Nepal, Adjunct Faculty - Ace Institute of Management, Kathmandu College of Management)
Support/Resistance is one of the techniques that performs very well if done properly. This webinar will focus on all the strategies based on Support/Resistance and show the attendee some tips on using each one and which one gives the best results and the reasons why. It also introduces a new feature in Investar, namely, Risk/Reward Ratio.
- Pivot Levels
- Fibonacci Retracements
- Gap Up/Gap Down
- New High/New Low
- Support/Resistance (Manually drawn or Automatic like Auto-SR)
- Brief intro to factors identifying strong support/resistance.
- Best settings for Auto-Support/Resistance
- Using the Risk/Reward Ratio
- Using Support/Resistance Zones
This is part of the Education Series prepared by StockStream Financial Services. This session looks at some common Candlestick patterns used in trading.
forex trading strategy that you can make money with. Can also be use by using your android and iphone metatrader.
The settings on the indicator are easy to setup. The strategy best time frame is h4 and hourly chart.
http://www.pipsumo.com/2017/04/parabolic-sar-trading-strategy.html
Stock trading tips on hot stocks to buy now, stock market strategy, picking hot stocks, picking penny stocks, and how to buy cheap stocks. From “How to Find a Home Run Stock” and “How to Pick Hot Reverse Merger Penny Stocks” and also “How the Shorts Raid Your Stock, Destroy Your Company and What to Do About It” all by John Lux.
http://www.options-trading-education.com/24043/straddle-options/
Straddle Options
When an options trader is not sure which way prices will go in a volatile market he or she often uses straddle options. Straddle options both long and short let a trader stake out potentially profitable positions for both rising and falling markets. Which route a trader takes in using straddle options will depend on whether he wants to buy or sell options contracts.
Going Long
A long straddle is buying both a call and a put on the same stock with the same expiration date. In a long straddle options strategy the worst a trader can do is lose the cost of the premiums paid for the call and the put if the stock does not change price. These straddle options have potentially unlimited potential if the stock price changes significantly, up or down.
Long Straddle Calls
If the stock price goes up the trader exercises the call option, sells the stock at the spot price and buys at the strike price. The profit is the price of 100 shares per contract at the spot price minus the strike price, minus the cost of premiums on both put and call options.
Long Straddle Puts
If the stock goes down in price the trader exercises the put option and sells the stock at the strike price and buys at the new, lower market price, the spot price. The profit will be the price of 100 shares per contract at the strike price minus the spot price minus the premium cost of both put and call options.
This strategy is useful in a volatile and unpredictable market. It carries twice the overhead of a call or put trade. But, the trader cuts down on the risk of missing out on an unexpected market move by covering both up and down eventualities. The only time when a trader loses with a long straddle is when the stock price does not change and then he is only out the cost of two options contracts.
Going Short
A short straddle strategy is selling both a put and a call on the same stock with the same options expiration dates. If the stock does not go up or down the options trader gains two premiums, one for the call and one for the put. Straddle options like these can be cash cows for a trader who has done his homework and only sells contracts on stocks that have very little likelihood of going up or down.
Volatile Markets and Big Losses
Whereas a long straddle is ideal for a volatile market a short straddle should only be used in a quiet market. As with all selling of options contracts the losses can be enormous if a stock price changes greatly. Which is why selling options contracts is so commonly limited to traders with very deep pockets.
Volatile Markets and Big Gains
Volatile markets bring us back to the long straddle. This is the ideal strategy for a market that is crazy in its volatility.
By www.ProfitableTradingTips.com
Scalping in Day Trading
Traders who engage in rapid momentum trades are often scalping in day trading. These traders make their profit from the difference between bid and ask prices. Even in a flat market traders can profit from scalping in day trading. In order to successfully make a business out of scalping in day trading the trader needs to pay close attention to the market, always be aware of market fundamentals, and keep abreast of technical analysis. Despite the theoretical possibility of trading in an absolutely flat market the price of a stock constantly moves to some degree throughout the trading day. Thus when scalping in day trading one acts as a mini trend trader as well.
In and Out of Positions in a Hurry
There is a rhythm to scalping in day trading and it is fast. Traders seek to profit from the actions of traders to simply take the bid and ask prices of a stock. This strategy guarantees a profit if the trader acts quickly. It can result in losses if the stock price moves too quickly. As an example, Xyz Corporation has a bid price of $10.10 and ask price of $10.15. If the scalper can buy at the bid price and sell at the ask price he gains $0.05 per share, a small amount but a lot if repeated many times throughout the day. However, the market might move lower before he can complete his trade. Let’s say that the stock moves so that the bid price is now $9.90 and the ask price is $9.95. The trader who purchased for $10.10 now needs to sell at $9.95 if he wants to quickly exit his trade. The other choice is to continue the trade in hopes that the market will turn upward and not fall farther. This later course is anathema to scalping in day trading. When scalping a trader is never trying to outguess the market but simply helping to make the market and make repetitive small profits.
The Nature of Bid and Ask Prices
Bid and ask prices are available on markets across the world. By using this price system traders are able to execute trades immediately, so long as there are enough bid prices to match ask prices. The difference between bid and ask prices is called the spread. Gaining the spread on every trade is the goal when scalping in day trading. The ideal scalping trade would be instantaneous. Buy at the low price and sell at the high. Getting in and out in an instant would seem to be the ideal situation if dealing with absolutely static bid and ask prices. However, the market is never static so traders must look to market direction even when scalping in day trading. A successful scalper also engages in trend following in day trading.
Think of the Spread as a Bonus
Scalping in day trading takes advantage of market movement as well as the bid to ask spread. While trend traders use technical analysis to read market sentiment they attempt to ride out a trade to gain the maximum profit.
Click here for more information on range trading
http://www.netpicks.com/simple-range-trading-strategy/
Here is some information on range trading:
It’s been said that a market only trends 30% of the time.
I can’t quantify that figure but having a range trading strategy to take advantage of the other 70% is good business.
Range trading is not difficult however it does require discipline and a method of determining when a trading range is in play.
For more information on range trading click here:
http://www.netpicks.com/simple-range-trading-strategy/
www.CandleStickForums.com
Successful Trading System
What constitutes a successful trading system? Certainly a successful trading system is one that results in profits in trading stocks, trading commodities, trading futures and trading options. A stock trading system at its most basic is a set of rules, an algorithm, for deciding when to buy stock, sell stock, or sell short. A successful trading system can be applied to stocks, options, commodities and futures. A basic stock trading system is based upon technical analysis of stock prices and provides buy or sell signals. There are lots of trading systems. A truly successful trading system such as Candlestick analysis stands the test of time. Japanese Candlestick basics have been around since the days of the Samurai in Japan. Although rice traders in ancient Japan were fully aware of the fundamentals that drove rice prices, such as a good harvest, a drought, war, etc., they also learned that price patterns repeated themselves. By identifying these patterns and learning what the pattern was likely to indicate, traders developed Candlestick signals such as the Doji Candlestick which is a strong indicator of market indecision and predicts the reversal both upward and downward market trends.
A successful trading system must be one that the trader can use effectively in stock trading, commodity trading or trading derivatives. A distinct advantage of Candlestick charts is that they are easy to read. Candlestick stock charts display the same information as other, more difficult to read, charting methods. However, Candlestick signals distill the same essential information into each signal without displaying complicated, statistics that take valuable time to read. No matter how accurate a trading system is the system must be functional in the rapid paced world of day trading stocks, commodities, and derivatives.
how to sell pi coins effectively (from 50 - 100k pi)DOT TECH
Anywhere in the world, including Africa, America, and Europe, you can sell Pi Network Coins online and receive cash through online payment options.
Pi has not yet been launched on any exchange because we are currently using the confined Mainnet. The planned launch date for Pi is June 28, 2026.
Reselling to investors who want to hold until the mainnet launch in 2026 is currently the sole way to sell.
Consequently, right now. All you need to do is select the right pi network provider.
Who is a pi merchant?
An individual who buys coins from miners on the pi network and resells them to investors hoping to hang onto them until the mainnet is launched is known as a pi merchant.
debuts.
I'll provide you the Telegram username
@Pi_vendor_247
how to sell pi coins in all Africa Countries.DOT TECH
Yes. You can sell your pi network for other cryptocurrencies like Bitcoin, usdt , Ethereum and other currencies And this is done easily with the help from a pi merchant.
What is a pi merchant ?
Since pi is not launched yet in any exchange. The only way you can sell right now is through merchants.
A verified Pi merchant is someone who buys pi network coins from miners and resell them to investors looking forward to hold massive quantities of pi coins before mainnet launch in 2026.
I will leave the telegram contact of my personal pi merchant to trade with.
@Pi_vendor_247
Exploring Abhay Bhutada’s Views After Poonawalla Fincorp’s Collaboration With...beulahfernandes8
The financial landscape in India has witnessed a significant development with the recent collaboration between Poonawalla Fincorp and IndusInd Bank.
The launch of the co-branded credit card, the IndusInd Bank Poonawalla Fincorp eLITE RuPay Platinum Credit Card, marks a major milestone for both entities.
This strategic move aims to redefine and elevate the banking experience for customers.
Financial Assets: Debit vs Equity Securities.pptxWrito-Finance
financial assets represent claim for future benefit or cash. Financial assets are formed by establishing contracts between participants. These financial assets are used for collection of huge amounts of money for business purposes.
Two major Types: Debt Securities and Equity Securities.
Debt Securities are Also known as fixed-income securities or instruments. The type of assets is formed by establishing contracts between investor and issuer of the asset.
• The first type of Debit securities is BONDS. Bonds are issued by corporations and government (both local and national government).
• The second important type of Debit security is NOTES. Apart from similarities associated with notes and bonds, notes have shorter term maturity.
• The 3rd important type of Debit security is TRESURY BILLS. These securities have short-term ranging from three months, six months, and one year. Issuer of such securities are governments.
• Above discussed debit securities are mostly issued by governments and corporations. CERTIFICATE OF DEPOSITS CDs are issued by Banks and Financial Institutions. Risk factor associated with CDs gets reduced when issued by reputable institutions or Banks.
Following are the risk attached with debt securities: Credit risk, interest rate risk and currency risk
There are no fixed maturity dates in such securities, and asset’s value is determined by company’s performance. There are two major types of equity securities: common stock and preferred stock.
Common Stock: These are simple equity securities and bear no complexities which the preferred stock bears. Holders of such securities or instrument have the voting rights when it comes to select the company’s board of director or the business decisions to be made.
Preferred Stock: Preferred stocks are sometime referred to as hybrid securities, because it contains elements of both debit security and equity security. Preferred stock confers ownership rights to security holder that is why it is equity instrument
<a href="https://www.writofinance.com/equity-securities-features-types-risk/" >Equity securities </a> as a whole is used for capital funding for companies. Companies have multiple expenses to cover. Potential growth of company is required in competitive market. So, these securities are used for capital generation, and then uses it for company’s growth.
Concluding remarks
Both are employed in business. Businesses are often established through debit securities, then what is the need for equity securities. Companies have to cover multiple expenses and expansion of business. They can also use equity instruments for repayment of debits. So, there are multiple uses for securities. As an investor, you need tools for analysis. Investment decisions are made by carefully analyzing the market. For better analysis of the stock market, investors often employ financial analysis of companies.
The European Unemployment Puzzle: implications from population agingGRAPE
We study the link between the evolving age structure of the working population and unemployment. We build a large new Keynesian OLG model with a realistic age structure, labor market frictions, sticky prices, and aggregate shocks. Once calibrated to the European economy, we quantify the extent to which demographic changes over the last three decades have contributed to the decline of the unemployment rate. Our findings yield important implications for the future evolution of unemployment given the anticipated further aging of the working population in Europe. We also quantify the implications for optimal monetary policy: lowering inflation volatility becomes less costly in terms of GDP and unemployment volatility, which hints that optimal monetary policy may be more hawkish in an aging society. Finally, our results also propose a partial reversal of the European-US unemployment puzzle due to the fact that the share of young workers is expected to remain robust in the US.
If you are looking for a pi coin investor. Then look no further because I have the right one he is a pi vendor (he buy and resell to whales in China). I met him on a crypto conference and ever since I and my friends have sold more than 10k pi coins to him And he bought all and still want more. I will drop his telegram handle below just send him a message.
@Pi_vendor_247
Currently pi network is not tradable on binance or any other exchange because we are still in the enclosed mainnet.
Right now the only way to sell pi coins is by trading with a verified merchant.
What is a pi merchant?
A pi merchant is someone verified by pi network team and allowed to barter pi coins for goods and services.
Since pi network is not doing any pre-sale The only way exchanges like binance/huobi or crypto whales can get pi is by buying from miners. And a merchant stands in between the exchanges and the miners.
I will leave the telegram contact of my personal pi merchant. I and my friends has traded more than 6000pi coins successfully
Tele-gram
@Pi_vendor_247
how to sell pi coins on Bitmart crypto exchangeDOT TECH
Yes. Pi network coins can be exchanged but not on bitmart exchange. Because pi network is still in the enclosed mainnet. The only way pioneers are able to trade pi coins is by reselling the pi coins to pi verified merchants.
A verified merchant is someone who buys pi network coins and resell it to exchanges looking forward to hold till mainnet launch.
I will leave the telegram contact of my personal pi merchant to trade with.
@Pi_vendor_247
Introduction to Indian Financial System ()Avanish Goel
The financial system of a country is an important tool for economic development of the country, as it helps in creation of wealth by linking savings with investments.
It facilitates the flow of funds form the households (savers) to business firms (investors) to aid in wealth creation and development of both the parties
Poonawalla Fincorp and IndusInd Bank Introduce New Co-Branded Credit Cardnickysharmasucks
The unveiling of the IndusInd Bank Poonawalla Fincorp eLITE RuPay Platinum Credit Card marks a notable milestone in the Indian financial landscape, showcasing a successful partnership between two leading institutions, Poonawalla Fincorp and IndusInd Bank. This co-branded credit card not only offers users a plethora of benefits but also reflects a commitment to innovation and adaptation. With a focus on providing value-driven and customer-centric solutions, this launch represents more than just a new product—it signifies a step towards redefining the banking experience for millions. Promising convenience, rewards, and a touch of luxury in everyday financial transactions, this collaboration aims to cater to the evolving needs of customers and set new standards in the industry.
how to swap pi coins to foreign currency withdrawable.DOT TECH
As of my last update, Pi is still in the testing phase and is not tradable on any exchanges.
However, Pi Network has announced plans to launch its Testnet and Mainnet in the future, which may include listing Pi on exchanges.
The current method for selling pi coins involves exchanging them with a pi vendor who purchases pi coins for investment reasons.
If you want to sell your pi coins, reach out to a pi vendor and sell them to anyone looking to sell pi coins from any country around the globe.
Below is the contact information for my personal pi vendor.
Telegram: @Pi_vendor_247
How to get verified on Coinbase Account?_.docxBuy bitget
t's important to note that buying verified Coinbase accounts is not recommended and may violate Coinbase's terms of service. Instead of searching to "buy verified Coinbase accounts," follow the proper steps to verify your own account to ensure compliance and security.
1. BASIC CANDLESTICK PATTERN
JAHANGIR ALAM
BBA (pursuing)
“Brain does
business; not
anything”
JAHANGIR ALAM
BBA (MGT)-RU
THIS HANDOUT IS ONLY FOR PERSONAL USE, NOT FOR USING BUSINESS PURPOSE.
2. ANALYSIS :: CHART BBA (MGT)-RU
BASIC CANDLESTICK PATTERN
This Handout Is Dedicated To My Father-
MD. ASHRAFUL ALAM
SHARE BUSINESS IS MY HOBBY,
MY PROFESSION IS ONLY
STUDENTSHIP.
Md. Jahangir Alam
BBA (pursuing)
Department of Management
University of Rajshahi.
Acknowledgement:
www.onlinetradingconcept.com
www.babypips.com
www.wikipedia.com
JAHANGIR ALAM 2 E-mail: virus.exe7@gmail.com
3. ANALYSIS :: CHART BBA (MGT)-RU
Candlestick Basics
Candlestick charts are an effective way of visualizing price movements. There are two basic
candlesticks:
· Bullish Candle: When the close is higher than the open (usually green or white)
· Bearish Candle: When the close is lower than the open (usually red or black)
Candlestick Parts
There are three main parts to a candlestick:
Upper Shadow: The vertical line between the high of the day and the close (bullish candle) or open
(bearish candle)
Real Body: The difference between the open and close; colored portion of the candlestick
Lower Shadow: The vertical line between the low of the day and the open (bullish candle) or close
(bearish candle)
Candlestick Patterns
The power of Candlestick Charts is with multiple candlesticks forming reversal and continuation
patterns. OnlineTradingConcepts.com has many detailed explanations of these candlestick patterns;
the links are given below:
JAHANGIR ALAM 3 E-mail: virus.exe7@gmail.com
4. ANALYSIS :: CHART BBA (MGT)-RU
Bullish Engulfing Pattern
The Bullish Engulfing Candlestick Pattern is a bullish reversal pattern, usually occurs at the bottom of
a downtrend. The pattern consists of two Candlesticks:
· Smaller Bearish Candle (Day 1) and Larger Bullish Candle (Day 2)
The bearish candle real body of Day 1 is usually contained within the real body of the bullish candle
of Day 2.
On Day 2, the market gaps down; however, the bears do not get very far before bulls take over and
push prices higher, filling in the gap down from the morning's open and pushing prices past the
previous day's open.
The power of the Bullish Engulfing Pattern comes from the incredible change of sentiment from a
bearish gap down in the morning, to a large bullish real body candle that closes at the highs of the day.
Bears have overstayed their welcome and bulls have taken control of the market.
The chart above of the S&P 500 Depository Receipts Exchange Traded Fund (SPY) shows an example
of a Bullish Engulfing Pattern occurring at the end of a downtrend:
Bullish Engulfing Buy Signal
There are three main times to buy using the Bullish Engulfing Pattern; the buy signals that are
presented below are ordered from the most aggressive to most conservative:
1. Buy at the close of Day 2 when prices rallied upwards from the gap down in the morning. A
strong indication that the rally on Day 2 was significant and truly a reversal of market
sentiment, is if there was a substantial increase in volume that accompanied the large move
upward in price.
2. Buy on the day after the Bullish Engulfing Pattern occurs; by waiting until the next day to buy,
a trader is making sure that the bullish reversal and enthusiasm of the prior day is continuing
and was not just a one day occurrence like a short covering rally. In the chart above of the
SPY's, a trader would likely not enter the market long on the day after the Bullish Engulfing
Pattern because the market gapped down significantly and even made new lows. A trader using
methodology #2, would likely wait for a more concrete buy signals such as the one presented
in method #3 next.
3. After a trader sees the Bullish Engulfing Pattern, the trader would wait for another signal,
mainly a price break above the downward resistance line, before entering a buy order.
JAHANGIR ALAM 4 E-mail: virus.exe7@gmail.com
5. ANALYSIS :: CHART BBA (MGT)-RU
Intra-day Bullish Engulfing Pattern
The following 15-minute chart of the S&P 500 exchange traded fund (SPY) is of the 2-day period
comprising the Bullish Engulfing Pattern example on the prior page:
· Day 1: As is seen in the chart above, Day 1 was a down day, even closing the day at the low
(bearish sentiment).
· Day 2: The open was a gap down, very bearish sign; but the bulls appeared to have had enough
because the price of the SPY's went up the rest of the day, closing near the day's highs (bullish
sentiment) and higher than Day 1's high.
The Bullish Engulfing Pattern is one of the strongest candlestick reversal patterns. Its opposite is the
Bearish Engulfing Pattern.
JAHANGIR ALAM 5 E-mail: virus.exe7@gmail.com
6. ANALYSIS :: CHART BBA (MGT)-RU
Bearish Engulfing Pattern
The Bearish Engulfing Candlestick Pattern is a bearish reversal pattern, usually occurs at the top of an
uptrend. The pattern consists of two Candlesticks:
· Smaller Bullish Candle (Day 1) and Larger Bearish Candle (Day 2)
Generally, the bullish candle real body of Day 1 is contained within the real body of the bearish candle
of Day 2.
The market gaps up (bullish sign) on Day 2; but, the bulls do not push very far higher before bears
take over and push prices further down, not only filling in the gap down from the morning's open but
also pushing prices below the previous day's open.
With the Bullish Engulfing Pattern, there is an incredible change of sentiment from the bullish gap up
at the open, to the large bearish real body candle that closed at the lows of the day. Bears have
successfully overtaken bulls for the day and possibly for the next few periods.
The chart below of Verizon (VZ) stock shows an example two Bearish Engulfing Patterns occurs at
the end of uptrend:
Bearish Engulfing Sell Signal
Three methodologies for selling using the Bearish Engulfing Pattern are listed below in order of most
aggressive to most conservative:
1. Sell at the close of Day 2. An even stronger indication to sell is given when there is a
substantial increase in volume that accompanies the large move downward in price.
2. Sell on the day after the Bearish Engulfing Pattern occurs; by waiting until the next day to sell,
a trader is making sure that the bearish reversal pattern is for real and was not just a one day
occurrence. In the chart above of Verizon, a trader would probably entered on the day after the
Bearish Engulfing Pattern because the selling continued.
3. Usually trader's wait for other signals, such as a price break below the upward support line,
before entering a sell order. However, in the case of Verizon above, the Bearish Engulfing
Pattern occured at the same time as the trendline break below support.
JAHANGIR ALAM 6 E-mail: virus.exe7@gmail.com
7. ANALYSIS :: CHART BBA (MGT)-RU
Intra-day Bearish Engulfing Pattern
The following 15-minute chart of Verizon (VZ) is of the 2-day period comprising the Bearish
Engulfing Pattern example on the prior page:
· Day 1: As is seen in the chart above, Day 1 was an up day, closing near the day's high (bullish
sentiment).
· Day 2: The open was a gap up, a very bullish sign; nevertheless, the bulls ran out of buying
pressure and prices fell the rest of the day, closing near the day's lows (bearish sentiment) and
lower than Day 1's lows.
The Bearish Engulfing Pattern is one of the strongest candlestick reversal patterns. Its opposite is the
Bullish Engulfing Pattern.
JAHANGIR ALAM 7 E-mail: virus.exe7@gmail.com
8. ANALYSIS :: CHART BBA (MGT)-RU
Dark Cloud Cover
Dark Cloud Cover is a bearish candlestick reversal pattern, similar to the Bearish Engulfing Pattern
(see: Bearish Engulfing Pattern). There are two components of a Dark Cloud Cover formation:
dark cloud cover candlestick chart pattern
A Dark Cloud Cover Pattern occurs when a bearish candle on Day 2 closes below the middle of Day
1's candle.
In addition, price gaps up on Day 2 only to fill the gap (see: Gaps) and close significantly into the
gains made by Day 1's bullish candlestick.
The rejection of the gap up is a bearish sign in and of itself, but the retracement into the gains of the
previous day's gains adds even more bearish sentiment. Bulls are unable to hold prices higher, demand
is unable to keep up with the building supply.
Dark Cloud Cover Sell Signal
Traders usually suggest not selling exactly when one sees the Dark Cloud Cover Pattern (Day 1 & Day
2) until other confirming signals are given such as a break of an upward trendline or other technical
indicators. One reason for waiting for confirmation is that the Dark Cloud Cover Pattern is a bearish
pattern, but not as bearish as it could be: part of the gains from Day 1 have still been preserved.
A more bearish reversal pattern is the Bearish Engulfing Pattern (see: Bearish Engulfing Pattern) that
completely rejects the gains of Day 1 and usually closes below the lows of Day 1.
Also of interest, the bullish equivalent of the Dark Cloud Cover Pattern is the Piercing Pattern (see:
Piercing Pattern).
JAHANGIR ALAM 8 E-mail: virus.exe7@gmail.com
9. ANALYSIS :: CHART BBA (MGT)-RU
Doji
Doji Candlestick Pattern
The Doji is a powerful Candlestick formation, signifying indecision between bulls and bears. A Doji is
quite often found at the bottom and top of trends and thus is considered as a sign of possible reversal
of price direction, but the Doji can be viewed as a continuation pattern as well.
A Doji is formed when the opening price and the closing price are equal. A long-legged Doji, often
called a "Rickshaw Man" is the same as a Doji, except the upper and lower shadows are much longer
than the regular Doji formation.
The creation of the Doji pattern illustrates why the Doji represents such indecision. After the open,
bulls push prices higher only for prices to be rejected and pushed lower by the bears. However, bears
are unable to keep prices lower, and bulls then push prices back to the opening price.
Of course, a Doji could be formed by prices moving lower first and then higher second, nevertheless,
either way, the market closes back where the day started.
In a Doji pattern, the market explores its options both upward and downward, but cannot commit
either way. After a long uptrend, this indecision manifest by the Doji could be viewed as a time to exit
one's position, or at least scale back. Similarly, after a long downtrend, like the one shown above of
General Electric stock, reducing one's position size or exiting completely could be an intelligent move.
It is important to emphasize that the Doji pattern does not mean reversal, it means indecision. Doji's
are often found during periods of resting after a significant move higher or lower; the market, after
resting, then continues on its way. Nevertheless, a Doji pattern is a great sign that a prior trend is
losing its strength, and taking some profits might be well advised.
JAHANGIR ALAM 9 E-mail: virus.exe7@gmail.com
10. ANALYSIS :: CHART BBA (MGT)-RU
Intra-day Doji Formation
The first Doji outlined on the daily chart of General Electric on the previous page was a high-low
Doji, where prices made the highs for the days first, and the lows for the day second. The intra-day
chart (15-minute) of this occurance is given below:
Doji “A”
At the opening, the bulls were in charge; however, the morning rally did not last long before the bears
took charge. From mid-morning until late-afternoon, General Electric sold off, but by the end of the
day, bulls pushed GE back to the opening price of the day.
The second Doji daily chart on the previous page is shown next. In the intra-day chart below (Doji B),
the Doji was created the exact opposite way as the chart shown above (Doji A) was created; Doji B
made its day's lows first, then highs second.
Doji “B”
At the opening bell, bears took a hold of GE, but by mid-morning, bulls entered into GE's stock,
pushing GE into positive territory for the day. Unfortunately for the bulls, by noon bears took over and
pushed GE lower. By the end of the day, the bears had successfully brought the price of GE back to
the day's opening price.
As was presented above, the Doji formation can be created two different ways, but the interpretation
of the Doji remains the same: the Doji pattern is a sign of indecision, neither bulls nor bears can
successfully take over.
Two powerful versions of the Doji formation are shown below:
· Dragonfly Doji
· Gravestone Doji
JAHANGIR ALAM 10 E-mail: virus.exe7@gmail.com
11. ANALYSIS :: CHART BBA (MGT)-RU
Dragonfly Doji
The Dragonfly Doji is a significant bullish reversal candlestick pattern that mainly occurs at the
bottom of downtrends.
The Dragonfly Doji is created when the open, high, and close are the same or about the same price
(Where the open, high, and close are exactly the same price is quite rare). The most important part of
the Dragonfly Doji is the long lower shadow.
The long lower shadow implies that the market tested to find where demand was located and found it.
Bears were able to press prices downward, but an area of support was found at the low of the day and
buying pressure was able to push prices back up to the opening price. Thus, the bearish advance
downward was entirely rejected by the bulls.
Dragonfly Doji Candlestick Chart Example
The chart below of the mini-Dow Futures contract illustrates a Dragonfly Doji occuring at the bottom
of a downtrend:
In the chart above of the mini-Dow, the market began the day testing to find where demand would
enter the market. The mini-Dow eventually found support at the low of the day, so much support and
subsequent buying pressure, that prices were able to close the day approximately where they started
the day.
The Dragonfly Doji is an extremely helpful Candlestick pattern to help traders visually see where
support and demand is located. After a downtrend, the Dragonfly Doji can signal to traders that the
downtrend could be over and that short positions should probably be covered. Other indicators should
be used in conjunction with the Dragonfly Doji pattern to determine buy signals, for example, a break
of a downward trendline.
JAHANGIR ALAM 11 E-mail: virus.exe7@gmail.com
12. ANALYSIS :: CHART BBA (MGT)-RU
Gravestone Doji
The Gravestone Doji is a significant bearish reversal candlestick pattern that mainly occurs at the top
of uptrends.
The Gravestone Doji is created when the open, low, and close are the same or about the same price
(Where the open, low, and close are exactly the same price is quite rare). The most important part of
the Graveston Doji is the long upper shadow.
The long upper shadow is generally interpreted by technicians as meaning that the market is testing to
find where supply and potential resistance is located.
The construction of the Gravestone Doji pattern occurs when bulls are able to press prices upward.
However, an area of resistance is found at the high of the day and selling pressure is able to push
prices back down to the opening price. Therefore, the bullish advance upward was entirely rejected by
the bears.
Gravestone Doji Example
The chart below of Altria (MO) stock illustrates a Gravestone Doji that occured at the top of an
uptrend:
In the chart above of Altria (MO) stock, the market began the day testing to find where support would
enter the market. Altria eventually found resistance at the high of the day, and subsequently fell back
to the opening's price.
The Gravestone Doji is an extremely helpful Candlestick reversal pattern to help traders visually see
where resistance and supply is likely located. After an uptrend, the Gravestone Doji can signal to
traders that the uptrend could be over and that long positions should probably be exited. But other
indicators should be used in conjunction with the Gravestone Doji pattern to determine an actual sell
signal. A potential trigger could be a break of the upward trendline support.
JAHANGIR ALAM 12 E-mail: virus.exe7@gmail.com
13. ANALYSIS :: CHART BBA (MGT)-RU
Evening Star
The Evening Star Pattern is a bearish reversal pattern, usually occuring at the top of an uptrend. The
pattern consists of three candlesticks:
· Large Bullish Candle (Day 1)
· Small Bullish or Bearish Candle (Day 2)
· Large Bearish Candle (Day 3)
The first part of an Evening Star reversal pattern is a large bullish green candle. On the first day, bulls
are definitely in charge, usually new highs were made.
The second day begins with a bullish gap up. It is clear from the opening of Day 2 that bulls are in
control. However, bulls do not push prices much higher. The candlestick on Day 2 is quite small and
can be bullish, bearish, or neutral (i.e. Doji).
Generally speaking, a bearish candle on Day 2 is a stronger sign of an impending reversal. But it is
Day 3 that is the most significant candlestick.
Day 3 begins with a gap down, (a bearish signal) and bears are able to press prices even further
downward, often eliminating the gains seen on Day 1.
Evening Star Candlestick Chart Example
The chart below of Exxon-Mobil (XOM) stock shows an example a Evening Star bearish reversal
pattern that occured at the end of an uptrend:
Day 1 of the Evening Star pattern for Exxon-Mobil (XOM) stock above was a strong bullish candle, in
fact it was so strong that the close was the same as the high (very bullish sign). Day 2 continued Day
1's bullish sentiment by gapping up. However, Day 2 was a Doji, which is a candlestick signifying
indecision. Bulls were unable to continue the large rally of the previous day; they were only able to
close slightly higher than the open.
Day 3 began with a bearish gap down. In fact, bears took hold of Exxon-Mobil stock the entire day,
the open was the same as the high and the close was the same as the low (a sign of very bearish
sentiment). Also, Day 3 powerfully broke below the upward trendline that had served as support for
XOM for the past week. Both the trendline break and the classic Evening Star pattern gave traders a
signal to sell short Exxon-Mobil stock.
JAHANGIR ALAM 13 E-mail: virus.exe7@gmail.com
14. ANALYSIS :: CHART BBA (MGT)-RU
Morning Star
The Morning Star Pattern is a bearish reversal pattern, usually occuring at the bottom of a downtrend.
The pattern consists of three candlesticks:
· Large Bearish Candle (Day 1)
· Small Bullish or Bearish Candle (Day 2)
· Large Bullish Candle (Day 3)
The first part of a Morning Star reversal pattern is a large bearish red candle. On the first day, bears
are definitely in charge, usually making new lows.
The second day begins with a bearish gap down. It is clear from the opening of Day 2 that bears are in
control. However, bears do not push prices much lower. The candlestick on Day 2 is quite small and
can be bullish, bearish, or neutral (i.e. Doji).
Generally speaking, a bullish candle on Day 2 is a stronger sign of an impending reversal. But it is
Day 3 that holds the most significance.
Day 3 begins with a bullish gap up, and bulls are able to press prices even further upward, often
eliminating the losses seen on Day 1.
Morning Star Candlestick Chart Example
The chart below of the S&P 400 Midcap exchange traded fund (MDY) shows an example a Morning
Star bullish reversal pattern that occured at the end of a downtrend:
Day 1 of the Morning Star pattern for the Midcap 400 (MDY) chart above was a strong bearish red
candle. Day 2 continued Day 1's bearish sentiment by gapping down. However, Day 2 was a Doji,
which is a candlestick signifying indecision. Bears were unable to continue the large decreases of the
previous day; they were only able to close slightly lower than the open.
Day 3 began with a bullish gap up. The bulls then took hold of the Midcap 400 exchange traded fund
for the entire day. Also, Day 3 broke above the downward trendline that had served as resistance for
MDY for the past week and a half. Both the trendline break and the classic Morning Star pattern gave
traders a signal to go long and buy the Midcap 400 exchange traded fund.
JAHANGIR ALAM 14 E-mail: virus.exe7@gmail.com
15. ANALYSIS :: CHART BBA (MGT)-RU
Hammer
The Hammer candlestick formation is a significant bullish reversal candlestick pattern that mainly
occurs at the bottom of downtrends.
The Hammer formation is created when the open, high, and close are roughly the same price. Also,
there is a long lower shadow, twice the length as the real body.
When the high and the close are the same, a bullish Hammer candlestick is formed and it is considered
a stronger formation because the bulls were able to reject the bears completely plus the bulls were able
to push price even more past the opening price.
In contrast, when the open and high are the same, this Hammer formation is considered less bullish,
but nevertheless bullish. The bulls were able to counteract the bears, but were not able to bring the
price back to the price at the open.
The long lower shadow of the Hammer implies that the market tested to find where support and
demand was located. When the market found the area of support, the lows of the day, bulls began to
push prices higher, near the opening price. Thus, the bearish advance downward was rejected by the
bulls.
Hammer Candlestick Chart Example
The chart below of American International Group (AIG) stock illustrates a Hammer reversal pattern
after a downtrend:
In the chart above of AIG, the market began the day testing to find where demand would enter the
market. AIG's stock price eventually found support at the low of the day. In fact, there was so much
support and subsequent buying pressure, that prices were able to close the day even higher than the
open, a very bullish sign.
The Hammer is an extremely helpful candlestick pattern to help traders visually see where support and
demand is located. After a downtrend, the Hammer can signal to traders that the downtrend could be
over and that short positions should probably be covered.
However, other indicators should be used in conjunction with the Hammer candlestick pattern to
determine buy signals, for example, waiting a day to see if a rally off of the Hammer formation
continues or other chart indications such as a break of a downward trendline. But other previous day's
clues could enter into a traders analysis. An example of these clues, in the chart above of AIG, shows
three prior day's Doji's (signs of indecision) that suggested that prices could be reversing trend; in that
case and for an aggressive buyer, the Hammer formation could be the trigger to go long.
JAHANGIR ALAM 15 E-mail: virus.exe7@gmail.com
16. ANALYSIS :: CHART BBA (MGT)-RU
Hanging Man
The Hanging Man candlestick formation, as one could predict from the name, is a bearish sign. This
pattern occurs mainly at the top of uptrends and is a warning of a potential reversal downward. It is
important to emphasize that the Hanging Man pattern is a warning of potential price change, not a
signal, in and of itself, to go short.
The Hanging Man formation, just like the Hammer, is created when the open, high, and close are
roughly the same price. Also, there is a long lower shadow, which should be at least twice the length
of the real body.
When the high and the open are the same, a bearish Hanging Man candlestick is formed and it is
considered a stronger bearish sign than when the high and close are the same, forming a bullish
Hanging Man (the bullish Hanging Man is still bearish, just less so because the day closed with gains).
After a long uptrend, the formation of a Hanging Man is bearish because prices hesitated by dropping
significantly during the day. Granted, buyers came back into the stock, future, or currency and pushed
price back near the open, but the fact that prices were able to fall significantly shows that bears are
testing the resolve of the bulls. What happens on the next day after the Hanging Man pattern is what
gives traders an idea as to whether or not prices will go higher or lower.
Hanging Man Candlestick Chart Example
The chart below of Alcoa (AA) stock illustrates a Hanging Man, and the large red bearish candle after
the Hanging Man strengthens the bears thinking that a downward reversal is coming:
In the chart above of Alcoa, the market began the day testing to find where demand would enter the
market. Alcoa's stock price eventually found support at the low of the day. The bears' excursion
downward was halted and prices ended the day slightly above the close.
Confirmation that the uptrend was in trouble occured when Alcoa gapped down the next day and
continued downward creating a large bearish red candle. To some traders, this confirmation candle,
plus the fact that the upward trendline support was broken, gave the signal to go short.
It is important to repeat, that the Hanging Man formation is not the sign to go short; other indicators
such as a trendline break or confirmation candle should be used to generate sell signals.
The bullish version of the Hanging Man is the Hammer formation (see: Hammer) that occurs after
downtrends.
JAHANGIR ALAM 16 E-mail: virus.exe7@gmail.com
17. ANALYSIS :: CHART BBA (MGT)-RU
Harami
The Harami (meaning "pregnant" in Japanese) Candlestick Pattern is a reversal pattern. The pattern
consists of two Candlesticks:
• Larger Bullish or Bearish Candle (Day 1) • Smaller Bullish or Bearish Candle (Day 2)
The Harami Pattern is considered either bullish or bearish based on the criteria below:
Bearish Harami: A bearish Harami occurs when there is a large bullish green candle on Day 1
followed by a smaller bearish or bullish candle on Day 2. The most important aspect of the bearish
Harami is that prices gapped down on Day 2 and were unable to move higher back to the close of Day
1. This is a sign that uncertainty is entering the market.
Bullish Harami: A bullish Harami occurs when there is a large bearish red candle on Day 1 followed
by a smaller bearish or bullish candle on Day 2. Again, the most important aspect of the bullish
Harami is that prices gapped up on Day 2 and price was held up and unable to move lower back to the
bearish close of Day 1.
Harami Candlestick Chart Example
The chart below of the Nasdaq 100 E-mini Futures contract shows an example of both a bullish and
bearish Harami candlestick pattern:
The first Harami pattern shown above on the chart of the E-mini Nasdaq 100 Future is a bullish
reversal Harami. First there was a long bearish red candle. Second, the market gapped up at the open.
In the case above, Day 2 was a bullish candlestick, which made the bullish Harami even more bullish.
Harami Candlestick Buy Signal
A buy signal could be triggered when the day after the bullish Harami occured, price rose higher,
closing above the downward resistance trendline. A bullish Harami pattern and a trendline break is a
potent combination resulting in a strong buy signal.
The second Harami pattern shown above on the chart of the E-mini Nasdaq 100 Future is a bearish
reversal Harami. The first candle was a long bullish green candle. On the second candle, the market
gapped down at the open. The chart above of the e-mini shows that Day 2 was a bearish candlestick;
this made the bearish Harami even more bearish.
Harami Candlestick Sell Signal
A sell signal could be triggered when the day after the bearish Harami occured, price fell even further
down, closing below the upward support trendline. When combined, a bearish Harami pattern and a
trendline break is a strong indication to sell.
A somewhat opposite two candlestick reversal pattern is the Bearish Engulfing Pattern (see: Bearish
Engulfing Pattern) and the Bullish Engulfing Pattern (see: Bullish Engulfing Pattern).
JAHANGIR ALAM 17 E-mail: virus.exe7@gmail.com
18. ANALYSIS :: CHART BBA (MGT)-RU
Inverted Hammer
The Inverted Hammer candlestick formation occurs mainly at the bottom of downtrends and is a
warning of a potential reversal upward. It is important to note that the Inverted pattern is a warning of
potential price change, not a signal, in and of itself, to buy.
The Inverted Hammer formation, just like the Shooting Star formation, is created when the open, low,
and close are roughly the same price. Also, there is a long upper shadow, which should be at least
twice the length of the real body.
When the low and the open are the same, a bullish Inverted Hammer candlestick is formed and it is
considered a stronger bullish sign than when the low and close are the same, forming a bearish
Hanging Man (the bearish Hanging Man is still considered bullish, just not as much because the day
ended by closing with losses).
After a long downtrend, the formation of an Inverted Hammer is bullish because prices hesitated their
move downward by increasing significantly during the day. Nevertheless, sellers came back into the
stock, future, or currency and pushed prices back near the open, but the fact that prices were able to
increase significantly shows that bulls are testing the power of the bears. What happens on the next
day after the Inverted Hammer pattern is what gives traders an idea as to whether or not prices will go
higher or lower.
Inverted Hammer Candlestick Chart Example
The chart below of the S&P 500 Futures contract shows the Inverted Hammer foreshadowing future
price increases:
In the chart above of e-mini future, the market began the day by gapping down. Prices moved higher,
until resistance and supply was found at the high of the day. The bulls' excursion upward was halted
and prices ended the day below the open.
Confirmation that the dowtrend was in trouble occured the next day when the E-mini S&P 500 Futures
contract gapped up the next day and continued to move upward, creating a bullish green candle. To
some traders, this confirmation candle, plus the fact that the downward trendline resistance was
broken, gave the signal to go long.
It is important to repeat, that the Inverted Hammer formation is not the signal to go long; other
indicators such as a trendline break or confirmation candle should be used to generate the actual buy
signal.
The bearish version of the Inverted Hammer is the Shooting Star formation (see: Shooting Star) that
occurs after an uptrend.
JAHANGIR ALAM 18 E-mail: virus.exe7@gmail.com
19. ANALYSIS :: CHART BBA (MGT)-RU
Piercing Line Pattern
The Piercing Pattern is a bullish candlestick reversal pattern, similar to the Bullish Engulfing Pattern
(see: Bullish Engulfing Pattern). There are two components of a Piercing Pattern formation:
· Bearish Candle (Day 1)
· Bullish Candle (Day 2)
A Piercing Pattern occurs when a bullish candle on Day 2 closes above the middle of Day 1's bearish
candle.
Moreover, price gaps down on Day 2 only for the gap to be filled (see: Gaps) and closes significantly
into the losses made previously in Day 1's bearish candlestick.
The rejection of the gap up by the bulls is a major bullish sign, and the fact that bulls were able to
press further up into the losses of the previous day adds even more bullish sentiment. Bulls were
successful in holding prices higher, absorbing excess supply and increasing the level of demand.
Piercing Pattern Candlestick Chart Example
The chart below of Intel (INTC) stock illustrates an example of the Piercing Pattern:
Piercing Pattern Candlestick Buy Signal
Generally other technical indicators are used to confirm a buy signal given by the Piercing Pattern (i.e.
downward trendline break). Since the Piercing Pattern means that bulls were unable to completely
reverse the losses of Day 1, more bullish movement should be expected before an outright buy signal
is given. Also, more volume than usual on the bullish advance on Day 2 is a stronger indicator that
bulls have taken charge and that the prior downtrend is likely ending.
A more bullish reversal pattern is the Bullish Engulfing Pattern (see: Bullish Engulfing Pattern) that
completely reverses the losses of Day 1 and adds new gains.
For further study, the bearish equivalent of the Piercing Pattern is the Dark Cloud Cover Pattern (see:
Dark Cloud Cover).
JAHANGIR ALAM 19 E-mail: virus.exe7@gmail.com
20. ANALYSIS :: CHART BBA (MGT)-RU
Shooting Star
The Shooting Star candlestick formation is a significant bearish reversal candlestick pattern that
mainly occurs at the top of uptrends.
The Shooting formation is created when the open, low, and close are roughly the same price. Also,
there is a long upper shadow, generally defined as at least twice the length of the real body.
When the low and the close are the same, a bearish Shooting Star candlestick is formed and it is
considered a stronger formation because the bears were able to reject the bears completely plus the
bears were able to push prices even more by closing below the opening price.
The Shooting Star formation is considered less bearish, but nevertheless bearish when the open and
low are roughly the same. The bears were able to counteract the bears, but were not able to bring the
price back to the price at the open.
The long upper shadow of the Shooting Star implies that the market tested to find where resistance and
supply was located. When the market found the area of resistance, the highs of the day, bears began to
push prices lower, ending the day near the opening price. Thus, the bullish advance upward was
rejected by the bears.
Shooting Star Candlestick Chart Example
The chart below of Cisco Systems (CSCO) illustrates a Shooting Star reversal pattern after an uptrend:
In the chart above of CSCO, the market began the day testing to find where supply would enter the
market. CSCO's stock price eventually found resistance at the high of the day. In fact, there was so
much resistance and subsequent selling pressure, that prices were able to close the day significantly
lower than the open, a very bearish sign.
The Shooting Star is an extremely helpful candlestick pattern to help traders visually see where
resistance and supply is located. After an uptrend, the Shooting Star pattern can signal to traders that
the uptrend could be over and that long positions should probably be reduced or completely exited.
However, other indicators should be used in conjunction with the Shooting Star candlestick pattern to
determine sell signals, for example, waiting a day to see if prices continued falling or other chart
indications such as a break of an upward trendline.
For aggressive traders, the Shooting Star pattern illustrated above could be used as the sell signal. The
red portion of the candle (the difference between the open and close) was so large with CSCO, that it
could be considered the same as a bearish candle occuring on the next day. However, caution would
have to be used because the close of the Shooting Star rested right at the uptrend support line for Cisco
Systems.
Generally speaking though, a trader should wait for a confirmation candle before entering.
The bullish version of the Shooting Star formation is the Inverted Hammer formation (see: Inverted
Hammer) that occurs at bottoms. Another similar candlestick pattern in look and interpretation to the
Shooting Star pattern is the Gravestone Doji (see: Gravestone Doji).
JAHANGIR ALAM 20 E-mail: virus.exe7@gmail.com
21. ANALYSIS :: CHART BBA (MGT)-RU
Tweezer Tops and Bottoms
The Tweezer Top formation is a bearish reversal pattern seen at the top of uptrends and the Tweezer
Bottom formation is a bullish reversal pattern seen at the bottom of downtrends.
Tweezer Top formation consists of two candlesticks:
· Bullish Candle (Day 1)
· Bearish Candle (Day 2)
Tweezer Bottom formation consists of two candlesticks:
· Bearish Candle (Day 1)
· Bullish Candle (Day 2)
Sometimes Tweezer Tops or Bottoms have three candlesticks.
A bearish Tweezer Top occurs during an uptrend when bulls take prices higher, often closing the day
off near the highs (a bullish sign). However, on the second day, how traders feel (i.e. their sentiment)
reverses completely. The market opens and goes straight down, often eliminating the entire gains of
Day 1.
The reverse, a bullish Tweezer Bottom occurs during a downtrend when bears continue to take prices
lower, usually closing the day near the lows (a bearish sign). Nevertheless, Day 2 is completely
opposite because prices open and go nowhere but upwards. This bullish advance on Day 2 sometimes
eliminates all losses from the previous day.
Tweezer Bottom Candlestick Chart Example
A Tweezer Bottom is shown below in the chart of Exxon-Mobil (XOM) stock:
The bears pushed the price of Exxon-Mobil (XOM) downwards on Day 1; however, the market on
Day 2 opened where prices closed on Day 1 and went straight up, reversing the losses of Day 2. A buy
signal would generally be given on the day after the Tweezer Bottom, assuming the candlestick was
bullish green.
An interesting chart and explanation of what occurs intra-day during a Tweezer Top and Bottom is
discussed on the next page.
JAHANGIR ALAM 21 E-mail: virus.exe7@gmail.com
22. ANALYSIS :: CHART BBA (MGT)-RU
Windows (Gaps)
Windows as they are called in Japanese Candlestick Charting, or Gaps, as they are called in the west,
are an important concept in technical analysis. Whenever, there is a gap (current open is not the same
as prior closing price), that means that no price and no volume transacted hands between the gap.
A Gap Up occurs when the open of Day 2 is greater than the close of Day 1. Contrastly, a Gap Down
occurs when the open of Day 2 is less than the close of Day 1.
There is much psychology behind gaps. Gaps can act as:
Resistance: Once price gaps downward, the gap can act as long-term or even permanent resistance.
Support: When prices gap upwards, the gap can act as support to prices in the future, either long-term
or permanently.
JAHANGIR ALAM 22 E-mail: virus.exe7@gmail.com
23. ANALYSIS :: CHART BBA (MGT)-RU
Windows Example - Gaps as Support & Resistance
The chart below of eBay (EBAY) stock shows the gap up acting as support for prices.
Often after a gap, prices will do what is referred to as "fill the gap". This occurs quite often. Think of
a gap as a hole in the price chart that needs to be filled back in. Another common occurance with gaps
is that once gaps are filled, the gap tends to reverse direction and continue its way in the direction of
the gap (for example, in the chart above of eBay, back upwards).
The example of eBay (EBAY) above shows the gap acting as support. Traders and investors see
anything below the gap as an area of no return, after all, there was probably some positive news that
sparked the gap up and is still in play for the company.
The chart below of Wal-Mart (WMT) stock shows many instances of gaps up and gaps down. Notice
how gaps down act as areas of resistance and gaps up as areas of support:
Gaps are important areas on a chart that can help a technical analysis trader better find areas of support
or resistance. For more information on how support and resistance work and how they can be used for
trading, (see: Support & Resistance). Also, Gaps are an important part of most Candlestick Charting
patterns; (see: Candlestick Basics) for a list of candlestick pattern charts and descriptions.
JAHANGIR ALAM 23 E-mail: virus.exe7@gmail.com