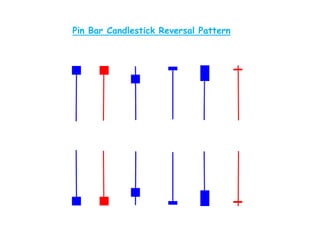
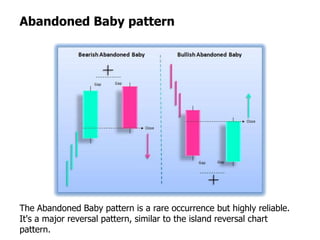
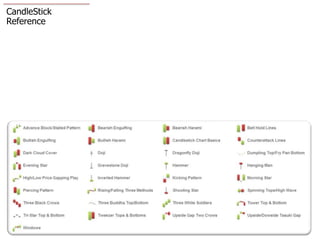
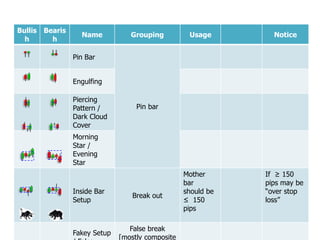
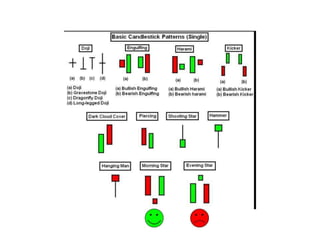
Candlestick patterns provide technical traders with visual clues about investor sentiment and can signal potential reversals in trend. Some key reversal patterns include the hammer, hanging man, morning star, and evening star formations. Traders watch for these patterns to form at support/resistance levels or trendlines as potential entry signals. While candlesticks don't provide price targets, confirming patterns with technical analysis helps traders identify high probability trade setups. Proper risk management using stop losses is also important when trading candlestick reversal signals.

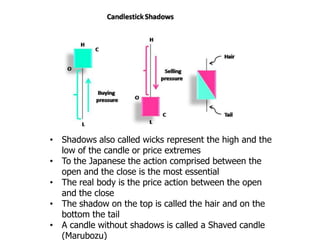
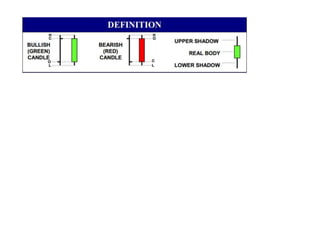
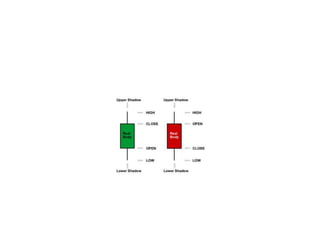
![[Anatomy of
a Candlestick]
Basic Candlestick
:
Upper Shadow
Upper Shadow
Real Body
Lower Shadow
Real Body
“Technical Analysis ”
Download from http://www.mediafire.com/view/?l0tppaop5jhl0as Lower Shadow](https://image.slidesharecdn.com/priceactiontrading-130312010407-phpapp02/85/Price-action-trading1-3-320.jpg)
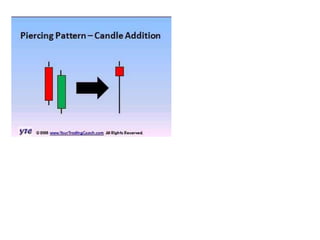
![Green hammer
Red hammer [Hanging man]](https://image.slidesharecdn.com/priceactiontrading-130312010407-phpapp02/85/Price-action-trading1-12-320.jpg)