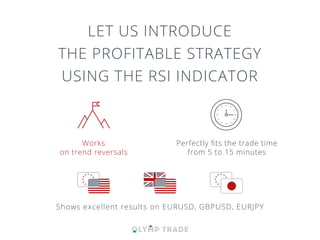
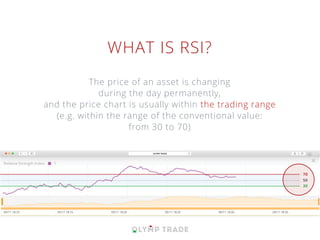
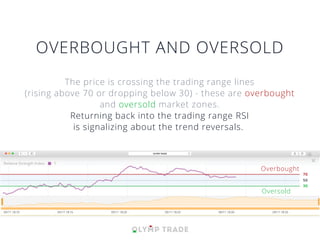
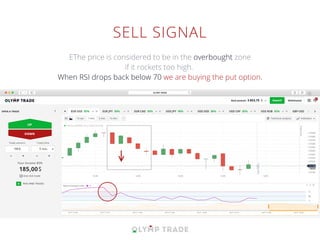
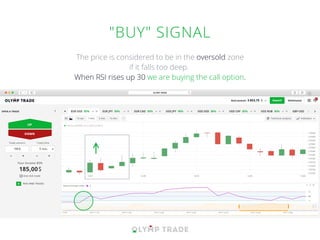

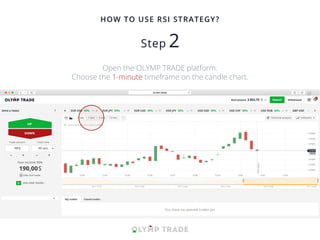
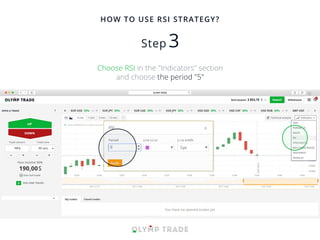
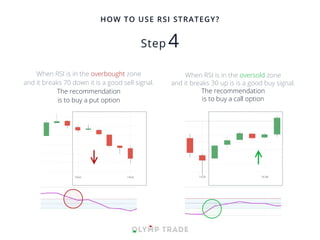


The document introduces the RSI indicator strategy for trend reversals on timeframes of 5-15 minutes for currency pairs like EURUSD and GBPUSD. It explains that RSI shows when the price is overbought or oversold, signaling trend reversals back within its 30-70 trading range. It provides instructions on how to set up the RSI indicator on a 1-minute candle chart using a period of 5, and describes buying put options when RSI drops below 70 from overbought conditions or call options when RSI rises above 30 from oversold conditions.