
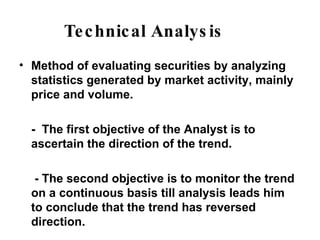
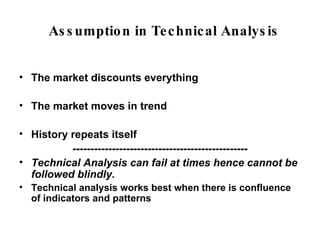
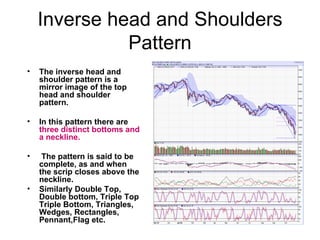
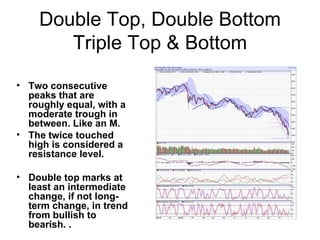


This document provides an overview of technical analysis in 3 paragraphs or less: Technical analysis uses historical market data, particularly price and volume, to identify trends and predict future market movements. Charts like bar charts and candlestick charts are used to identify patterns indicating trends are strengthening or reversing. Technical indicators like moving averages, MACD, and ADX are analyzed to determine whether the market is trending or consolidating. Common chart patterns like head and shoulders and double tops/bottoms provide additional signals on the strength and direction of trends. Volume analysis is also important, with increasing volume confirming trends and decreasing volume indicating potential reversals.