1) The team presented strategies, mission, vision, research and development, marketing, production, finance, and lessons learned for innovative company Chester Inc. over multiple rounds of the business simulation.
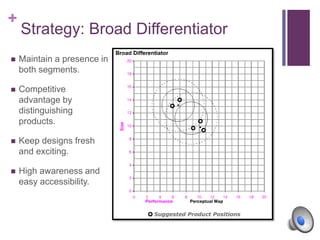
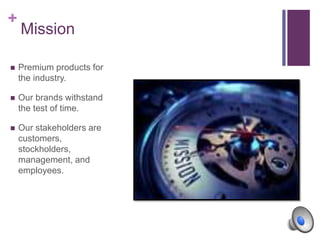
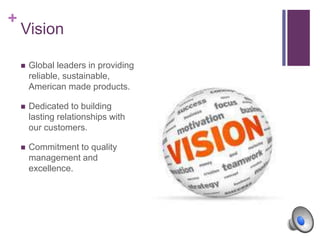
2) Chester aimed to differentiate its premium products, build customer relationships globally, and commit to quality and excellence.
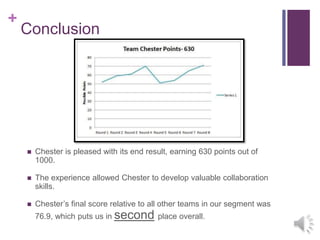
3) Though Chester struggled initially with forecasting and TQM, it improved its techniques, maintained profitability and positive cash flow, and earned 630 out of 1000 points in the simulation, placing second in its segment.
![Baldwin[2][1]](https://cdn.slidesharecdn.com/ss_thumbnails/baldwin21-120806215951-phpapp02-thumbnail.jpg?width=640&height=640&fit=bounds)


