Download to read offline

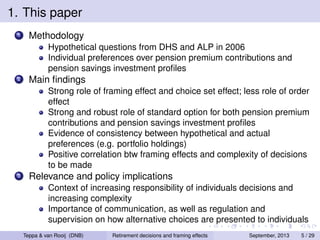

![3. Results
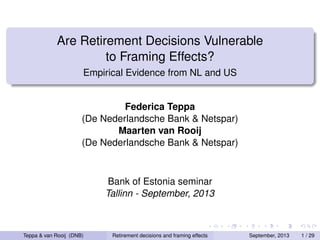
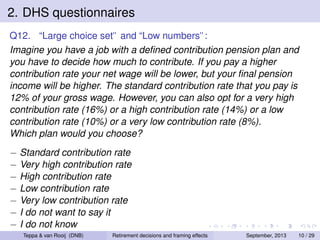
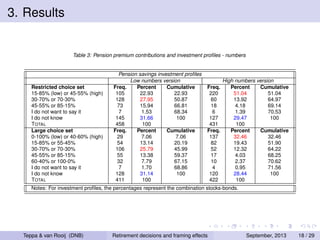
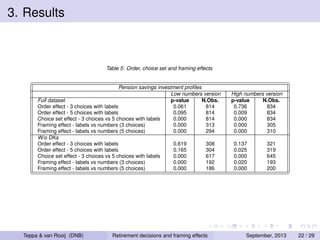
Table 6a: Role of standard option - Pension premium contributions - probit estimates
Variable
14 percent
16 percent
Coefficient
Coefficient
[Marg.eff.]
[Marg.eff.]
(Std. Err.)
(Std. Err.)
Labeled standard
1.027 ***
-0.177 *
[0.311]
[-0.069]
(0.125)
(0.099)
SAS financial literacy
0.114
0.025
[0.043]
[0.010]
(0.091)
(0.088)
Female
-0.153 *
0.082
[-0.056]
[0.032]
(0.080)
(0.077)
Age less than 40 years
0.346 **
-0.020
[0.132]
[-0.008]
(0.127)
(0.121)
Age between 40 and 64 years
0.224 **
-0.170 *
[0.083]
[-0.067]
(0.107)
(0.102)
Gross household income (in logs)
0.010
-0.183 **
[0.003]
[-0.072]
(0.088)
(0.086)
Total fin. assets (in logs)
-0.010
-0.016
[-0.003]
[-0.006]
(0.028)
(0.027)
Constant
-0.978
1.422 **
(0.721)
(0.705)
Log-likelihood
-749.708
-816.210
Pseudo R2
0.066
0.028
N.Obs.
1215
1215
Teppa & van Rooij (DNB)
Retirement decisions and framing effects
18 percent
Coefficient
[Marg.eff.]
(Std. Err.)
0.208 **
[0.082]
(0.098)
-0.184 **
[-0.073]
(0.088)
-0.066
[-0.026]
(0.076)
-0.334 **
[-0.132]
(0.121)
-0.196 *
[-0.077]
(0.102)
0.006
[0.002]
(0.085)
0.045 *
[0.018]
(0.027)
-0.428
(0.701)
-817.545
0.024
1215
September, 2013
23 / 29](https://image.slidesharecdn.com/tallinnlabels-131119052235-phpapp01/85/Federica-Teppa-Maarten-van-Rooij-Are-Retirement-Decisions-Vulnerable-to-Framing-Effects-23-320.jpg)
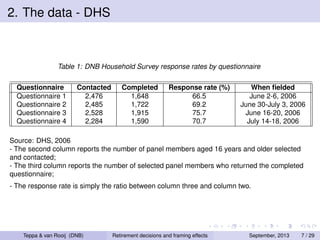
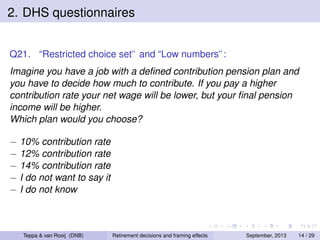
![3. Results
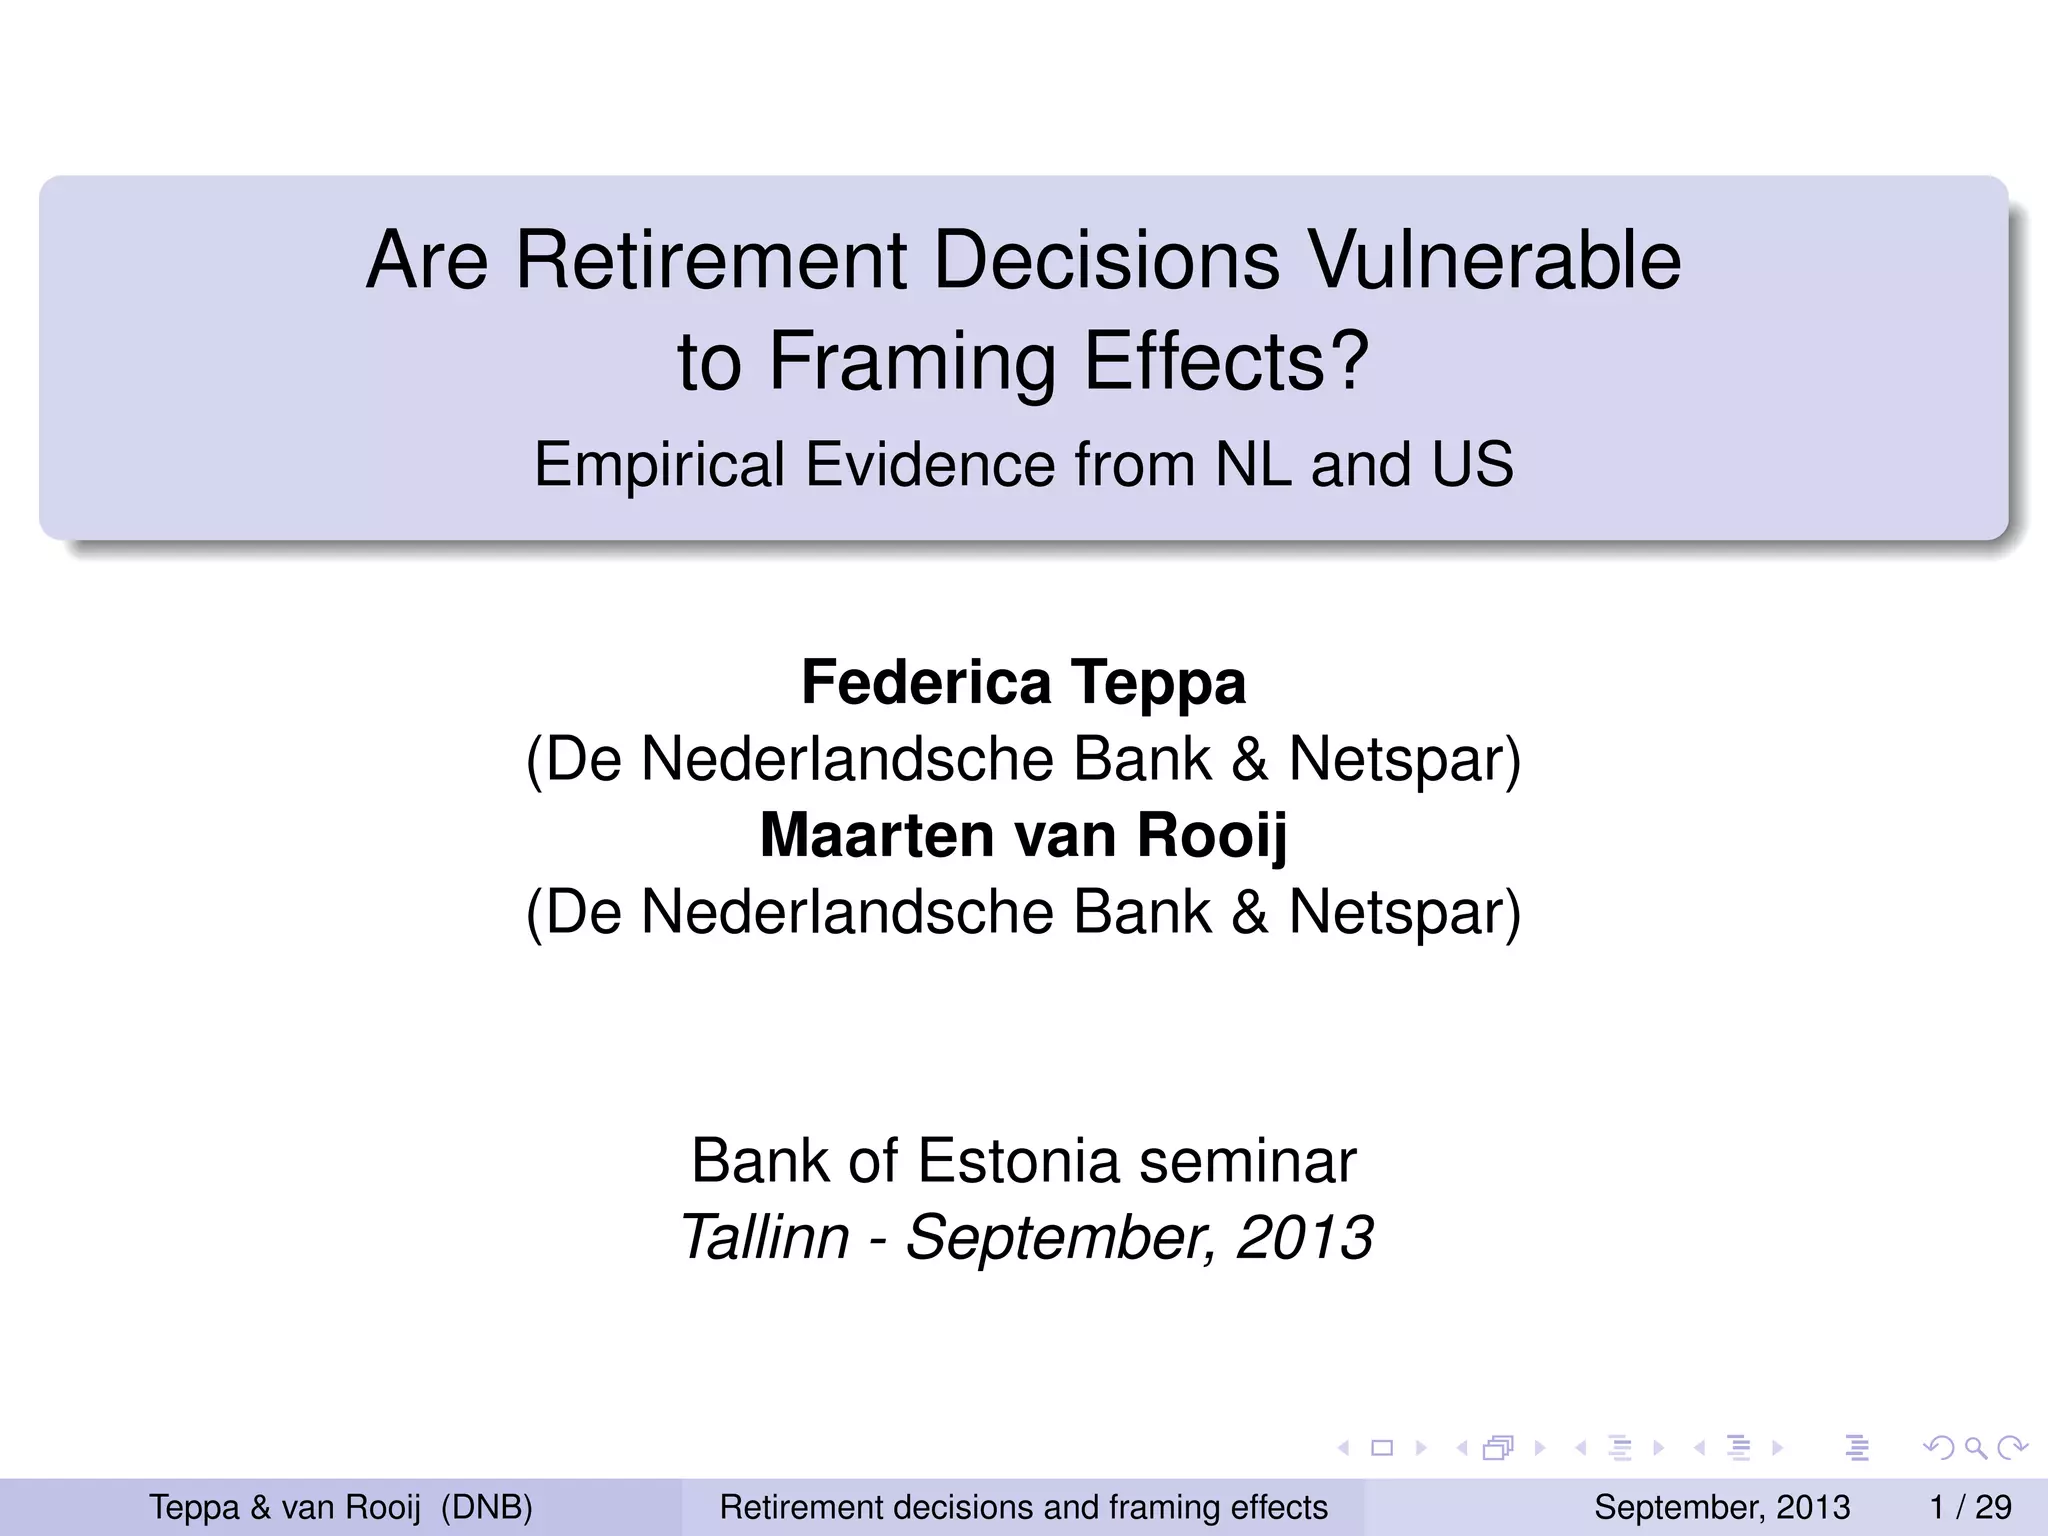
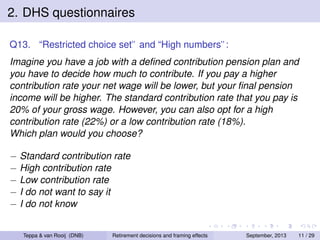
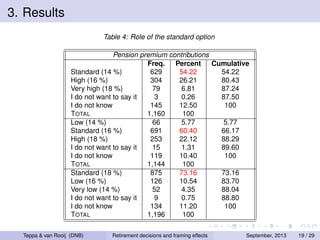
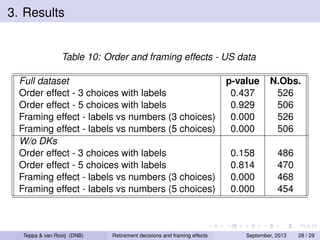
Table 6b: Role of standard option - Pension savings investment profile - probit estimates
Variable
45-55 percent
30-70 percent
Coefficient
Coefficient
[Marg.eff.]
[Marg.eff.]
(Std. Err.)
(Std. Err.)
Labeled standard
0.712 ***
-0.115
[0.158]
[-0.046]
(0.112)
(0.081)
SAS financial literacy
0.339 ***
-0.187 **
[0.094]
[-0.074]
(0.102)
(0.090)
Female
-0.209 **
-0.159 **
[-0.053]
[-0.063]
(0.094)
(0.078)
Age less than 40 years
0.263 *
0.020
[0.072]
[0.008]
(0.147)
(0.122)
Age between 40 and 64 years
0.191
0.024
[0.049]
[0.009]
(0.124)
(0.009)
Gross hh income (in logs)
0.032
0.063
[0.008]
[0.025]
(0.104)
(0.087)
Total fin. assets (in logs)
0.082 **
-0.038
[0.021]
[-0.015]
(0.033)
(0.028)
Constant
-2.118 **
0.205
(0.842)
(0.704)
Log-likelihood
-538.100
-801.155
Pseudo R2
0.092
0.023
N.Obs.
1184
1184
Teppa & van Rooij (DNB)
Retirement decisions and framing effects
15-85 percent
Coefficient
[Marg.eff.]
(Std. Err.)
0.182 **
[0.069]
(0.084)
-0.163 *
[-0.061]
(0.091)
0.262 ***
[0.096]
(0.081)
-0.204
[-0.007]
(0.127)
-0.170
[-0.063]
(0.108)
-0.141
[-0.052]
(0.090)
0.012
[0.004]
(0.028)
1.087
(0.734)
-736.706
0.051
1184
September, 2013
24 / 29](https://image.slidesharecdn.com/tallinnlabels-131119052235-phpapp01/85/Federica-Teppa-Maarten-van-Rooij-Are-Retirement-Decisions-Vulnerable-to-Framing-Effects-24-320.jpg)
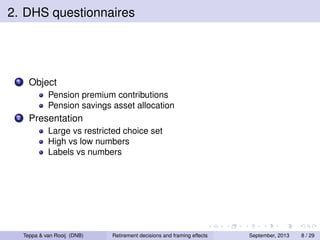
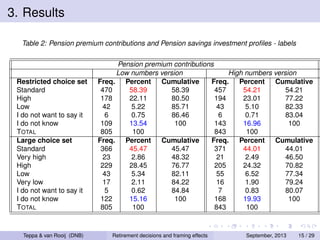
![3. Results
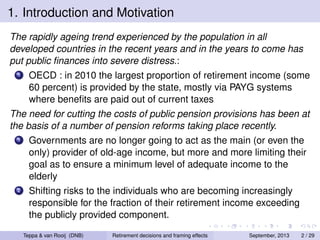
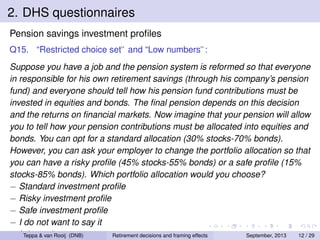
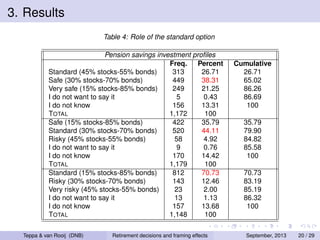
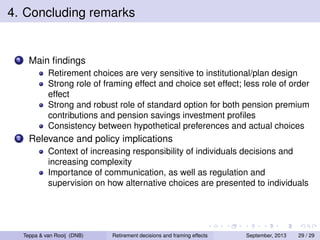
Table 7: Role of risk attitudes - Pension savings investment profiles - probit estimates
Variable
Labeled standard
Saving1
Saving2
Saving3
Saving4
Saving5
Saving6
Joint significance test
Log-likelihood
Pseudo R2
N.Obs.
Teppa & van Rooij (DNB)
45-55 percent
Coefficient
[Marg.eff.]
(Std. Err.)
0.720 ***
[0.155]
(0.120)
-0.253 **
[-0.067]
(0.117)
-0.346 ***
[-0.086]
(0.102)
-0.130
[-0.031]
(0.151)
0.056
[0.013]
(0.124)
0.309 **
[0.085]
(0.121)
0.187
[0.050]
(0.141)
0.000
-494.184
0.127
1122
30-70 percent
Coefficient
[Marg.eff.]
(Std. Err.)
-0.125
[-0.050]
(0.085)
0.069
[0.027]
(0.101)
-0.284 ***
[-0.113]
(0.084)
0.259 **
[0.102]
(0.132)
-0.007
[-0.003]
(0.105)
0.065
[0.025]
(0.110)
0.225 *
[0.089]
(0.131)
0.000
-744.214
0.043
1122
Retirement decisions and framing effects
15-85 percent
Coefficient
[Marg.eff.]
(Std. Err.)
0.218 **
[0.082]
(0.089)
0.083
[0.031]
(0.104)
0.440 ***
[0.162]
(0.087)
0.082
[0.030]
(0.135)
0.004
[0.001]
(0.109)
-0.163
[-0.061]
(0.113)
-0.319 **
[-0.122]
(0.132)
0.000
-673.521
0.086
1122
September, 2013
25 / 29](https://image.slidesharecdn.com/tallinnlabels-131119052235-phpapp01/85/Federica-Teppa-Maarten-van-Rooij-Are-Retirement-Decisions-Vulnerable-to-Framing-Effects-25-320.jpg)
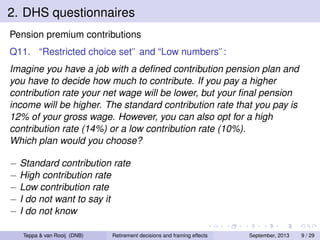
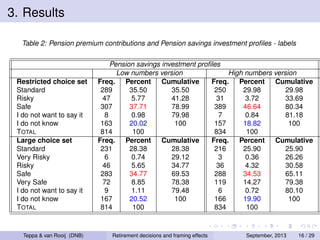
![3. Results
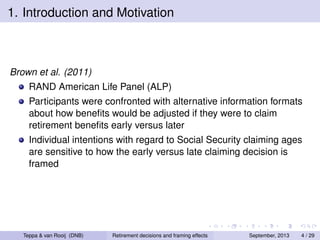
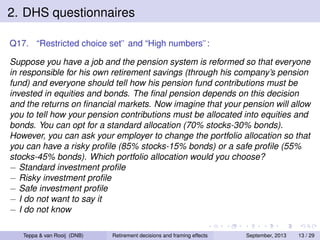
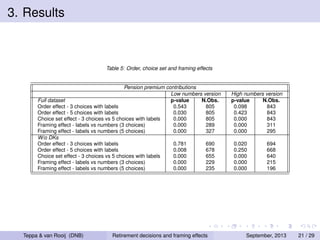
Table 8: Pension savings investment profiles and household wealth - probit estimates
Variable
45-55 percent
Coefficient
[Marg.eff.]
(Std. Err.)
0.611 ***
[0.143]
(0.085)
0.040 **
[0.010]
(0.013)
-0.430 ***
(0.083)
-814.520
0.037
1733
Labeled standard
Total hh wealth
Constant
Log-likelihood
Pseudo R2
N.Obs.
Labeled standard
Financial hh wealth
Constant
Log-likelihood
Pseudo R2
N.Obs.
Teppa & van Rooij (DNB)
30-70 percent
Coefficient
[Marg.eff.]
(Std. Err.)
-0.063
[-0.025]
(0.064)
0.008
[0.003]
(0.012)
0.008
(0.061)
-1200.407
0.001
1733
15-85 percent
Coefficient
[Marg.eff.]
(Std. Err.)
0.220 ***
[0.085]
(0.089)
-0.032 *
[-0.012]
(0.012)
0.219 ***
(0.061)
-1147.166
0.001
1733
0.610 ***
[0.143]
(0.085)
0.121 ***
[0.031]
(0.031)
-1.391 ***
(0.077)
-811.476
0.041
1733
-0.062
[-0.024]
(0.085)
-0.005
[-0.002]
(0.101)
0.069
(0.101)
-1200.614
0.001
1733
0.219 ***
[0.084]
(0.065)
-0.066 **
[-0.025]
(0.029)
0.172 **
(0.055)
-1148.061
0.006
1733
Retirement decisions and framing effects
September, 2013
26 / 29](https://image.slidesharecdn.com/tallinnlabels-131119052235-phpapp01/85/Federica-Teppa-Maarten-van-Rooij-Are-Retirement-Decisions-Vulnerable-to-Framing-Effects-26-320.jpg)
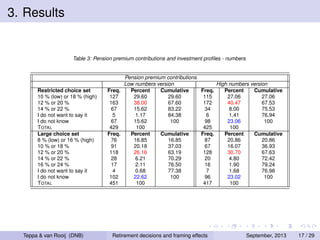
![3. Results
Table 9: Pension savings investment profiles and portfolio choice - probit estimates
Variable
45-55 percent
30-70 percent
Coefficient
Coefficient
[Marg.eff.]
[Marg.eff.]
(Std. Err.)
(Std. Err.)
Labeled standard
0.599 ***
-0.069
[0.140]
[-0.027]
(0.086)
(0.065)
No risky assets
0.027
0.012
[0.007]
[0.005]
(0.063)
(0.054)
Bonds and money lent out
0.052
-0.175
[0.013]
[-0.070]
(0.114)
(0.115)
Options, mutual funds and stocks
0.299 ***
0.022
[0.078]
[0.008]
(0.074)
(0.066)
Real estate
-0.007
0.001
[-0.002]
[0.001]
(0.022)
(0.019)
Business equity
0.144
0.133
[0.037]
[0.053]
(0.179)
(0.156)
Mortgages
-0.063
-0.059
[-0.016]
[-0.023]
(0.047)
(0.041)
Financial debt
-0.322
0.115
[-0.084]
[0.046]
(0.256)
(0.248)
Log-likelihood
-805.364
-1197.307
Pseudo R2
0.048
0.003
Teppa & van Rooij (DNB)
Retirement decisions and framing effects
N.Obs.
1733
1733
15-85 percent
Coefficient
[Marg.eff.]
(Std. Err.)
0.237 ***
[0.091]
(0.066)
-0.025
[-0.009]
(0.054)
0.146
[0.056]
(0.112)
-0.262 ***
[-0.100]
(0.080)
-0.008
[-0.003]
(0.019)
0.076
[0.029]
(0.167)
0.078 *
[0.029]
(0.248)
0.072
[0.027]
(0.248)
-1139.747
0.013
September, 2013
1733
27 / 29](https://image.slidesharecdn.com/tallinnlabels-131119052235-phpapp01/85/Federica-Teppa-Maarten-van-Rooij-Are-Retirement-Decisions-Vulnerable-to-Framing-Effects-27-320.jpg)

This document summarizes the results of a study on how framing effects influence retirement decisions. The study used hypothetical questions from surveys in the Netherlands and US to examine how individuals' preferences for pension contributions and investment profiles are affected by how the choices are framed or presented. The results show strong evidence that framing effects, choice set effects, and the standard option presented influence individuals' decisions. Preferences were also found to be more vulnerable to framing for more complex decisions. The findings suggest communication around retirement choices needs to properly frame options to avoid unintended influences on individuals' decisions.


