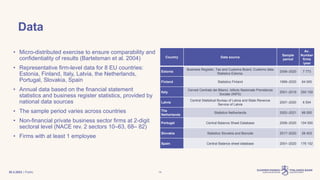
Download to read offline


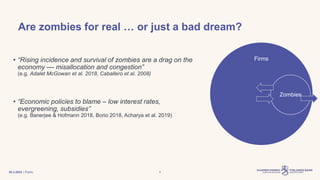
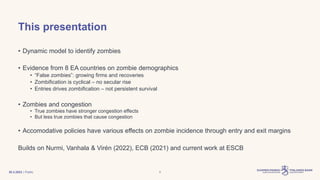
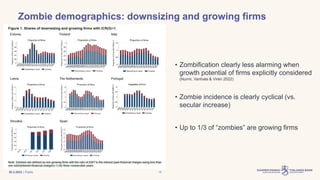
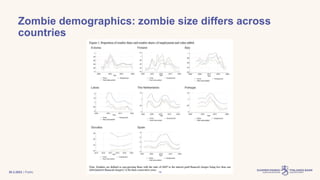
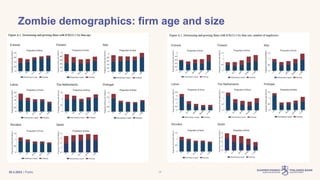
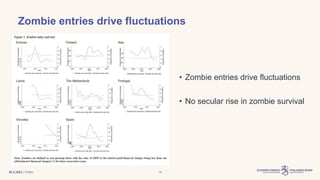
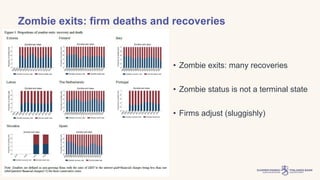
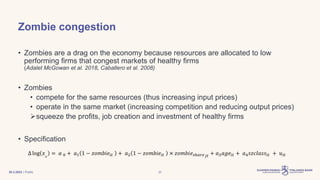

The document examines the issue of 'zombie firms' – companies that survive despite poor economic performance – within European countries, arguing that their prevalence may be cyclical rather than a long-term trend. It presents a dynamic model to differentiate true zombies from temporarily struggling firms and highlights the cyclical nature of zombification driven by firm entry and exit. The findings suggest that while zombies can congest the economy by competing for resources, many 'zombie' firms are actually growing, indicating a more complex relationship between firm health and economic policy.


