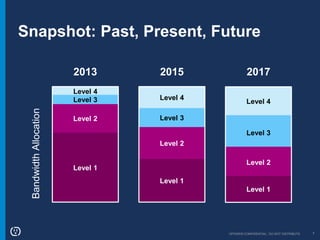
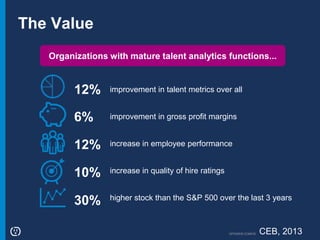
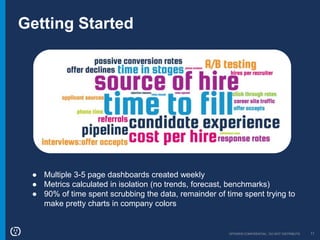
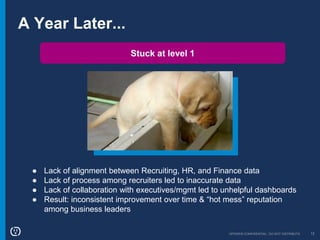
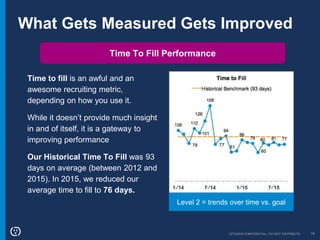
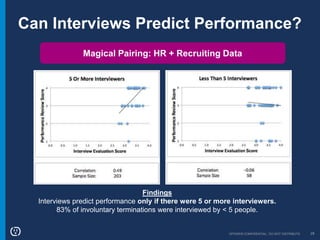
Talent Analytics
The Opower Story
1
OPOWER CONFIDENTIAL: DO NOT DISTRIBUTE 2
Hello!
Dawn Mitchell
Director, Talent
Acquisition
@DawnJGMitchell
Alan Henshaw
Manager, Technical
Recruiting
@henshawsburgh
Scott Walker
Senior People
Analyst
@scottwalker521
OPOWER CONFIDENTIAL: DO NOT DISTRIBUTE 3
About Opower
What is Opower?
Opower is the leading provider of cloud-based software to
the utility industry. Our purpose is to accelerate the
transition to a clean energy future.
What do we do?
We combine big data and behavioral science to motivate
people to save energy. We also transform the way utilities
relate to customers by improving customer engagement.
Our Results
We’ve saved 8 terawatt hours of energy, over 20 million lbs
of CO2, and over $1 billion in utility bills (….and we’ve only
penetrated 1% of the market).
@Opower
OPOWER CONFIDENTIAL: DO NOT DISTRIBUTE 4
What We’re Covering
Our Journey
● Inspiration
● Analytics past and present
● Team performance
● Forecasting & budget
Analytics Insights
● Integrated HR & TA data
● Wrap up
OPOWER CONFIDENTIAL: DO NOT DISTRIBUTE 5
What Inspired Us?
OPOWER CONFIDENTIAL: DO NOT DISTRIBUTE 6
Talent Analytics Maturity Model
Level 1: Reporting Monkey
Ad hoc, operational reports only
“Can I get this data for tomorrow’s all-hands?”
Level 2: Advanced Reporting
Reports focus on benchmarks/trends
“How has our time to fill changed over time?”
Level 3: Proactive Analytics
Solving talent challenges through data/statistical analyses
“How do we staff our team for constantly shifting hiring needs?”
Level 4: Predictive Analytics
Using data to forecast future talent outcomes
“How much attrition will we experience next year and how
much $ do we need to eliminate time in empty seats?”
10% of
orgs
4% of
orgs
30% of
orgs
56% of
orgs
Goal: develop a mature talent analytics function
Bersin, 2013
OPOWER CONFIDENTIAL: DO NOT DISTRIBUTE 7
Snapshot: Past, Present, Future
2013 2015 2017
BandwidthAllocation
Level 4
Level 2
Level 1
Level 4
Level 3
Level 2
Level 1
Level 4
Level 3
Level 2
Level 1
Level 3
OPOWER CONFIDENTIAL: DO NOT DISTRIBUTE 8
The Value
Organizations with mature talent analytics functions...
12%
6%
12%
10%
30%
improvement in talent metrics over all
improvement in gross profit margins
increase in employee performance
increase in quality of hire ratings
higher stock than the S&P 500 over the last 3 years
CEB, 2013
OPOWER CONFIDENTIAL: DO NOT DISTRIBUTE 9
We Were Warned
2
Advanced
Reports
3
Proactive
Analytics
4
Predictive
Analytics
1
Operational
Reports
Level of Value
Level of
Effort/Skills
Choke point for
most
Organizations
Finally seeing ROI
Bersin’s Maturity Model
OPOWER CONFIDENTIAL: DO NOT DISTRIBUTE 10
Getting Started
First Year
OPOWER CONFIDENTIAL: DO NOT DISTRIBUTE 11
Getting Started
● Multiple 3-5 page dashboards created weekly
● Metrics calculated in isolation (no trends, forecast, benchmarks)
● 90% of time spent scrubbing the data, remainder of time spent trying to
make pretty charts in company colors
OPOWER CONFIDENTIAL: DO NOT DISTRIBUTE 12
A Year Later...
Stuck at level 1
● Lack of alignment between Recruiting, HR, and Finance data
● Lack of process among recruiters led to inaccurate data
● Lack of collaboration with executives/mgmt led to unhelpful dashboards
● Result: inconsistent improvement over time & “hot mess” reputation
among business leaders
OPOWER CONFIDENTIAL: DO NOT DISTRIBUTE 13
Pivot Point
Second Year
OPOWER CONFIDENTIAL: DO NOT DISTRIBUTE 14
Company Reactions
When people see recruiting data…
OPOWER CONFIDENTIAL: DO NOT DISTRIBUTE 15
Focusing On Our Biggest Challenges
How do we staff our team for constantly shifting needs?
● Baby
● IPO = C U Later
● Changing company direction +
fickle hiring managers who don’t
know what they need
● Do we need generalists, SMEs, or
flex recruiters?
● Capacity = “hey, can you take
another req?”, and goals =
“ASAP”
“The Situation”
OPOWER CONFIDENTIAL: DO NOT DISTRIBUTE 16
“Trystorming” A New Framework
Quadrant Model
2
Goal: 70 days
3 capacity pts
3
Goal: 80 days
4 capacity pts
1
Goal: 60 days
2 capacity pts
4
Goal: 120 days
6 capacity pts
FrequencyofHire
Uniqueness of Skillset
Project Mgr
Receptionist
Sales Exec
SVP
Quadrant model: We categorize
roles into 4 levels of difficulty, based
on frequency and uniqueness of skill
set. This allows us to evaluate
recruiter capacity and set goals.
Recruiting goals: based on avg.
time to fill by quadrant.
Capacity: 25-30 quadrant points
Example of “Level 3 analytic” (using
data to solve problems
OPOWER CONFIDENTIAL: DO NOT DISTRIBUTE 17
Using Our New Framework:
Team Performance
OPOWER CONFIDENTIAL: DO NOT DISTRIBUTE 18
What Gets Measured Gets Improved
Time To Fill Performance
Time to fill is an awful and an
awesome recruiting metric,
depending on how you use it.
While it doesn’t provide much insight
in and of itself, it is a gateway to
improving performance
Our Historical Time To Fill was 93
days on average (between 2012 and
2015). In 2015, we reduced our
average time to fill to 76 days.
Level 2 = trends over time vs. goal
OPOWER CONFIDENTIAL: DO NOT DISTRIBUTE 19
What Gets Measured Gets Improved
Level 2: Recruiter Scorecards
Avg. Days In Stage - Tech Recruiting
Eng
Recruiter
Resume
Review
Screen Hiring Mgr
Int
Onsite Offer Time to fill Time to fill
last quarter
Time to FIll
vs.. Goal
Rick 12 14 38 14 5 108 104 80%
Maggie 4 7 8 13 2 71 93 112%
Eng Avg. 11 10 13 16 3 90 102 93%
Quality of Candidates - Tech Recruiting
Eng
Recruiter
Total
Applicants
Screened # Hiring Mgr
Int
# Onsite # Offer Candidate
quality
Quality: last
quarter
Rick 192 119 16 8 3 24% 21%
Maggie 176 53 47 36 12 43% 35%
Eng Avg. 184 84 39 26 6 35% 27%
OPOWER CONFIDENTIAL: DO NOT DISTRIBUTE 20
cRaZy QuArTeR bOnUs (Q2 2015)
Level 3: Bonus Program Based On Quadrant Model
What we did
Hiring plan spiked drastically in Q2 2015
Data showed salaries increased in
proportion to difficulty of roles.
Recruiters were awarded 0.5% of all
new hire salaries for Q2
“Equal opportunity” since capacity points
were spread evenly (~30K per Q, ~3K
per recruiter).
So, what happened?
OPOWER CONFIDENTIAL: DO NOT DISTRIBUTE 21
cRaZy QuArTeR bOnUs (Q2 2015)
Level 3: Bonus Program Based On Quadrant Model
21
27
Q1 (no bonus) Q2 (bonus)
QuadrantPoints
Capacity Points
5.2
7.1
Q1 (no bonus) Q2 (bonus)
OfferAccepts
Hires Per Recruiter
78 74
Q1 (no bonus) Q2 (bonus)
Days
Time to Fill
Bonus Program Results
28% increase in capacity
pts
~2 more hires on average
per recruiter
4 day reduction in time to fill
OPOWER CONFIDENTIAL: DO NOT DISTRIBUTE 22
Using Our New Framework:
Forecasting & Budget
OPOWER CONFIDENTIAL: DO NOT DISTRIBUTE 23
Forecasting & Getting $
Expecting the Unexpected (Our Best Ex. Of Level 4)
Previous forecasts: ask leaders what they want to hire for the year, add in
expected attrition rate, and voila!
Problem: has no resemblance to what actually happens.
Why: Need to factor in rate of mid-year adds, transfer backfills, possibility of
re-orgs, and new business, and attrition trends rather than historical avg.
OPOWER CONFIDENTIAL: DO NOT DISTRIBUTE 24
Forecasting & Getting $
Making a business case for resources
80% capacity
7 recruiters
30% of roles filled 2-3 months
late (not able to support new
business deals)
Additional $700K
Heavy use of agencies required
for an “Immediate fix”, since hiring
new recruiters and ramping them
up would take 3-4 months.
5-10% of roles hired late if
agencies are effective
Forecasting ~250 hires to fill by EOY...
Current resources Expensive Fix
OPOWER CONFIDENTIAL: DO NOT DISTRIBUTE 25
Forecasting & Getting $
Making a business case for resources
Forecasting ~250 hires to fill by EOY...
Additional $350K to spend in 2015 required
Subscription for Hired.com – engage active tech candidates
1 contractor for Q2/Q3 to focus on quadrant 1/2
2 new recruiters
Recruiter bonus program
Referral bonus program
De-prioritize non-critical roles and accept that
10-15% roles will be hired 2-3 months late.
What We Proposed: Cost-Effective Fix
OPOWER CONFIDENTIAL: DO NOT DISTRIBUTE 26
Forecasting & Getting $
What Happened?
On track to meet 100% of goal by
EOY of year (hired 235 out of 250)!
What didn’t work:
$10K referral bonus program didn’t
yield any increase in referral hires
What worked
Hired.com yielded ~2 hard-to-fill
tech hires per month
New resources/incentives increased
capacity by ~20 roles per Q
Recruiter bonus program effectively
increased capacity during Q2
OPOWER CONFIDENTIAL: DO NOT DISTRIBUTE 27
Integrating HR & Recruiting Data
OPOWER CONFIDENTIAL: DO NOT DISTRIBUTE 28
Can Interviews Predict Performance?
Magical Pairing: HR + Recruiting Data
Findings
Interviews predict performance only if there were 5 or more interviewers.
83% of involuntary terminations were interviewed by < 5 people.
OPOWER CONFIDENTIAL: DO NOT DISTRIBUTE 29
Quality of Hire by Source
Magical Pairing: HR + Recruiting Data
No significant relationship between
source of hire and performance found.
Inconsistent with the notion that “our
best hires come from referrals”.
Referrals and intern converts are 2x likely
to stay past 2 years than agency/ passive
candidates. Hypothesis: they get the most
realistic job preview.
OPOWER CONFIDENTIAL: DO NOT DISTRIBUTE 30
Switch to Interactive Dashes
Example: Tableau
OPOWER CONFIDENTIAL: DO NOT DISTRIBUTE 31
Glassdoor Reviews
Comparing ourselves to talent competitors
Company A B C Us D E E F Avg G
Overall Ratings 4.5 4.4 4.1 4.0 4 3.9 3.4 3.4 3.2 3.2
Career Ops 4.3 3.9 3.9 3.7 3.7 3.9 3.4 3.3 3 3
Comp/Ben 4.5 4.3 4.2 3.5 3.8 3.8 3.5 3 3.2 3.3
Culture & Values 4.5 4.4 4.2 4.2 4.1 4.1 3.3 3.3 3.2 3.4
Leadership 4.2 3.9 3.8 3.8 3.5 3.8 3 3.1 2.9 2.8
Work/Life
Balance
3.9 4 4 3.5 3.6 3.1 2.7 3.5 3.3 3.9
Recommend? 91% 93% 79% 79% 72% 77% 64% 64% 58% 51%
Outlook (% Pos) 88% 76% 80% 60% 71% 77% 63% 64% 39% 34%
CEO Approval 96% 97% 88% 86% 93% 96% 82% 65% 69% 37%
OPOWER CONFIDENTIAL: DO NOT DISTRIBUTE 32
Wrap-Up
OPOWER CONFIDENTIAL: DO NOT DISTRIBUTE 33
Do...
Live in the
system &
consolidate
Always be
goaling
Analyst as an
insider
Construct
narratives &
ask “why?”
Beg, borrow,
& steal
100% adoption of ATS. 1 hiring plan spreadsheet, 1
system of record, 1 main dashboard.
Define success, set realistic goals, and track them. What
gets measured gets improved.
Empower your analyst; include in mgmt and strategy
meetings. The more they know the more they can help.
Summarize take-aways, caveats, and relevance. Don’t
accept data as is: dig, segment, and identify causes.
Lack expertise and budget? Borrow from Finance, Sales,
Ops, IT. Bare minimum: get their opinion.
OPOWER CONFIDENTIAL: DO NOT DISTRIBUTE 34
Don’t...
Waste time on
things that
don’t matter
Let perfect be
the enemy
of good
Get
comfortable
No “so what?” metrics or excessive dashboards, teach
entire team to pull basic reports.
Ask, “What is the impact of data being 95% vs. 100%
correct?” (some metrics need to be perfect, others don’t).
Keep on iterating; re-evaluate which metrics are still
valuable. Switch up what you show to keep engagement.
Overlook
Quick Wins
Start by using data you already have. Difficult and
expensive isn’t always better than simple and cheap.
Get
discouraged
Analytics = delayed gratification. It gets better.
OPOWER CONFIDENTIAL: DO NOT DISTRIBUTE 35
Recommended Reading
Author: former head of Google’s
People Analytics team
All about how to get your point
across with data – almost entirely
within Excel
Guide for what makes a good vs.
bad graph
Her blog:
www.storytellingwithdata.com
OPOWER CONFIDENTIAL: DO NOT DISTRIBUTE 36
Q&A

Talent Analytics - Opower

  • 1.
  • 2.
    OPOWER CONFIDENTIAL: DONOT DISTRIBUTE 2 Hello! Dawn Mitchell Director, Talent Acquisition @DawnJGMitchell Alan Henshaw Manager, Technical Recruiting @henshawsburgh Scott Walker Senior People Analyst @scottwalker521
  • 3.
    OPOWER CONFIDENTIAL: DONOT DISTRIBUTE 3 About Opower What is Opower? Opower is the leading provider of cloud-based software to the utility industry. Our purpose is to accelerate the transition to a clean energy future. What do we do? We combine big data and behavioral science to motivate people to save energy. We also transform the way utilities relate to customers by improving customer engagement. Our Results We’ve saved 8 terawatt hours of energy, over 20 million lbs of CO2, and over $1 billion in utility bills (….and we’ve only penetrated 1% of the market). @Opower
  • 4.
    OPOWER CONFIDENTIAL: DONOT DISTRIBUTE 4 What We’re Covering Our Journey ● Inspiration ● Analytics past and present ● Team performance ● Forecasting & budget Analytics Insights ● Integrated HR & TA data ● Wrap up
  • 5.
    OPOWER CONFIDENTIAL: DONOT DISTRIBUTE 5 What Inspired Us?
  • 6.
    OPOWER CONFIDENTIAL: DONOT DISTRIBUTE 6 Talent Analytics Maturity Model Level 1: Reporting Monkey Ad hoc, operational reports only “Can I get this data for tomorrow’s all-hands?” Level 2: Advanced Reporting Reports focus on benchmarks/trends “How has our time to fill changed over time?” Level 3: Proactive Analytics Solving talent challenges through data/statistical analyses “How do we staff our team for constantly shifting hiring needs?” Level 4: Predictive Analytics Using data to forecast future talent outcomes “How much attrition will we experience next year and how much $ do we need to eliminate time in empty seats?” 10% of orgs 4% of orgs 30% of orgs 56% of orgs Goal: develop a mature talent analytics function Bersin, 2013
  • 7.
    OPOWER CONFIDENTIAL: DONOT DISTRIBUTE 7 Snapshot: Past, Present, Future 2013 2015 2017 BandwidthAllocation Level 4 Level 2 Level 1 Level 4 Level 3 Level 2 Level 1 Level 4 Level 3 Level 2 Level 1 Level 3
  • 8.
    OPOWER CONFIDENTIAL: DONOT DISTRIBUTE 8 The Value Organizations with mature talent analytics functions... 12% 6% 12% 10% 30% improvement in talent metrics over all improvement in gross profit margins increase in employee performance increase in quality of hire ratings higher stock than the S&P 500 over the last 3 years CEB, 2013
  • 9.
    OPOWER CONFIDENTIAL: DONOT DISTRIBUTE 9 We Were Warned 2 Advanced Reports 3 Proactive Analytics 4 Predictive Analytics 1 Operational Reports Level of Value Level of Effort/Skills Choke point for most Organizations Finally seeing ROI Bersin’s Maturity Model
  • 10.
    OPOWER CONFIDENTIAL: DONOT DISTRIBUTE 10 Getting Started First Year
  • 11.
    OPOWER CONFIDENTIAL: DONOT DISTRIBUTE 11 Getting Started ● Multiple 3-5 page dashboards created weekly ● Metrics calculated in isolation (no trends, forecast, benchmarks) ● 90% of time spent scrubbing the data, remainder of time spent trying to make pretty charts in company colors
  • 12.
    OPOWER CONFIDENTIAL: DONOT DISTRIBUTE 12 A Year Later... Stuck at level 1 ● Lack of alignment between Recruiting, HR, and Finance data ● Lack of process among recruiters led to inaccurate data ● Lack of collaboration with executives/mgmt led to unhelpful dashboards ● Result: inconsistent improvement over time & “hot mess” reputation among business leaders
  • 13.
    OPOWER CONFIDENTIAL: DONOT DISTRIBUTE 13 Pivot Point Second Year
  • 14.
    OPOWER CONFIDENTIAL: DONOT DISTRIBUTE 14 Company Reactions When people see recruiting data…
  • 15.
    OPOWER CONFIDENTIAL: DONOT DISTRIBUTE 15 Focusing On Our Biggest Challenges How do we staff our team for constantly shifting needs? ● Baby ● IPO = C U Later ● Changing company direction + fickle hiring managers who don’t know what they need ● Do we need generalists, SMEs, or flex recruiters? ● Capacity = “hey, can you take another req?”, and goals = “ASAP” “The Situation”
  • 16.
    OPOWER CONFIDENTIAL: DONOT DISTRIBUTE 16 “Trystorming” A New Framework Quadrant Model 2 Goal: 70 days 3 capacity pts 3 Goal: 80 days 4 capacity pts 1 Goal: 60 days 2 capacity pts 4 Goal: 120 days 6 capacity pts FrequencyofHire Uniqueness of Skillset Project Mgr Receptionist Sales Exec SVP Quadrant model: We categorize roles into 4 levels of difficulty, based on frequency and uniqueness of skill set. This allows us to evaluate recruiter capacity and set goals. Recruiting goals: based on avg. time to fill by quadrant. Capacity: 25-30 quadrant points Example of “Level 3 analytic” (using data to solve problems
  • 17.
    OPOWER CONFIDENTIAL: DONOT DISTRIBUTE 17 Using Our New Framework: Team Performance
  • 18.
    OPOWER CONFIDENTIAL: DONOT DISTRIBUTE 18 What Gets Measured Gets Improved Time To Fill Performance Time to fill is an awful and an awesome recruiting metric, depending on how you use it. While it doesn’t provide much insight in and of itself, it is a gateway to improving performance Our Historical Time To Fill was 93 days on average (between 2012 and 2015). In 2015, we reduced our average time to fill to 76 days. Level 2 = trends over time vs. goal
  • 19.
    OPOWER CONFIDENTIAL: DONOT DISTRIBUTE 19 What Gets Measured Gets Improved Level 2: Recruiter Scorecards Avg. Days In Stage - Tech Recruiting Eng Recruiter Resume Review Screen Hiring Mgr Int Onsite Offer Time to fill Time to fill last quarter Time to FIll vs.. Goal Rick 12 14 38 14 5 108 104 80% Maggie 4 7 8 13 2 71 93 112% Eng Avg. 11 10 13 16 3 90 102 93% Quality of Candidates - Tech Recruiting Eng Recruiter Total Applicants Screened # Hiring Mgr Int # Onsite # Offer Candidate quality Quality: last quarter Rick 192 119 16 8 3 24% 21% Maggie 176 53 47 36 12 43% 35% Eng Avg. 184 84 39 26 6 35% 27%
  • 20.
    OPOWER CONFIDENTIAL: DONOT DISTRIBUTE 20 cRaZy QuArTeR bOnUs (Q2 2015) Level 3: Bonus Program Based On Quadrant Model What we did Hiring plan spiked drastically in Q2 2015 Data showed salaries increased in proportion to difficulty of roles. Recruiters were awarded 0.5% of all new hire salaries for Q2 “Equal opportunity” since capacity points were spread evenly (~30K per Q, ~3K per recruiter). So, what happened?
  • 21.
    OPOWER CONFIDENTIAL: DONOT DISTRIBUTE 21 cRaZy QuArTeR bOnUs (Q2 2015) Level 3: Bonus Program Based On Quadrant Model 21 27 Q1 (no bonus) Q2 (bonus) QuadrantPoints Capacity Points 5.2 7.1 Q1 (no bonus) Q2 (bonus) OfferAccepts Hires Per Recruiter 78 74 Q1 (no bonus) Q2 (bonus) Days Time to Fill Bonus Program Results 28% increase in capacity pts ~2 more hires on average per recruiter 4 day reduction in time to fill
  • 22.
    OPOWER CONFIDENTIAL: DONOT DISTRIBUTE 22 Using Our New Framework: Forecasting & Budget
  • 23.
    OPOWER CONFIDENTIAL: DONOT DISTRIBUTE 23 Forecasting & Getting $ Expecting the Unexpected (Our Best Ex. Of Level 4) Previous forecasts: ask leaders what they want to hire for the year, add in expected attrition rate, and voila! Problem: has no resemblance to what actually happens. Why: Need to factor in rate of mid-year adds, transfer backfills, possibility of re-orgs, and new business, and attrition trends rather than historical avg.
  • 24.
    OPOWER CONFIDENTIAL: DONOT DISTRIBUTE 24 Forecasting & Getting $ Making a business case for resources 80% capacity 7 recruiters 30% of roles filled 2-3 months late (not able to support new business deals) Additional $700K Heavy use of agencies required for an “Immediate fix”, since hiring new recruiters and ramping them up would take 3-4 months. 5-10% of roles hired late if agencies are effective Forecasting ~250 hires to fill by EOY... Current resources Expensive Fix
  • 25.
    OPOWER CONFIDENTIAL: DONOT DISTRIBUTE 25 Forecasting & Getting $ Making a business case for resources Forecasting ~250 hires to fill by EOY... Additional $350K to spend in 2015 required Subscription for Hired.com – engage active tech candidates 1 contractor for Q2/Q3 to focus on quadrant 1/2 2 new recruiters Recruiter bonus program Referral bonus program De-prioritize non-critical roles and accept that 10-15% roles will be hired 2-3 months late. What We Proposed: Cost-Effective Fix
  • 26.
    OPOWER CONFIDENTIAL: DONOT DISTRIBUTE 26 Forecasting & Getting $ What Happened? On track to meet 100% of goal by EOY of year (hired 235 out of 250)! What didn’t work: $10K referral bonus program didn’t yield any increase in referral hires What worked Hired.com yielded ~2 hard-to-fill tech hires per month New resources/incentives increased capacity by ~20 roles per Q Recruiter bonus program effectively increased capacity during Q2
  • 27.
    OPOWER CONFIDENTIAL: DONOT DISTRIBUTE 27 Integrating HR & Recruiting Data
  • 28.
    OPOWER CONFIDENTIAL: DONOT DISTRIBUTE 28 Can Interviews Predict Performance? Magical Pairing: HR + Recruiting Data Findings Interviews predict performance only if there were 5 or more interviewers. 83% of involuntary terminations were interviewed by < 5 people.
  • 29.
    OPOWER CONFIDENTIAL: DONOT DISTRIBUTE 29 Quality of Hire by Source Magical Pairing: HR + Recruiting Data No significant relationship between source of hire and performance found. Inconsistent with the notion that “our best hires come from referrals”. Referrals and intern converts are 2x likely to stay past 2 years than agency/ passive candidates. Hypothesis: they get the most realistic job preview.
  • 30.
    OPOWER CONFIDENTIAL: DONOT DISTRIBUTE 30 Switch to Interactive Dashes Example: Tableau
  • 31.
    OPOWER CONFIDENTIAL: DONOT DISTRIBUTE 31 Glassdoor Reviews Comparing ourselves to talent competitors Company A B C Us D E E F Avg G Overall Ratings 4.5 4.4 4.1 4.0 4 3.9 3.4 3.4 3.2 3.2 Career Ops 4.3 3.9 3.9 3.7 3.7 3.9 3.4 3.3 3 3 Comp/Ben 4.5 4.3 4.2 3.5 3.8 3.8 3.5 3 3.2 3.3 Culture & Values 4.5 4.4 4.2 4.2 4.1 4.1 3.3 3.3 3.2 3.4 Leadership 4.2 3.9 3.8 3.8 3.5 3.8 3 3.1 2.9 2.8 Work/Life Balance 3.9 4 4 3.5 3.6 3.1 2.7 3.5 3.3 3.9 Recommend? 91% 93% 79% 79% 72% 77% 64% 64% 58% 51% Outlook (% Pos) 88% 76% 80% 60% 71% 77% 63% 64% 39% 34% CEO Approval 96% 97% 88% 86% 93% 96% 82% 65% 69% 37%
  • 32.
    OPOWER CONFIDENTIAL: DONOT DISTRIBUTE 32 Wrap-Up
  • 33.
    OPOWER CONFIDENTIAL: DONOT DISTRIBUTE 33 Do... Live in the system & consolidate Always be goaling Analyst as an insider Construct narratives & ask “why?” Beg, borrow, & steal 100% adoption of ATS. 1 hiring plan spreadsheet, 1 system of record, 1 main dashboard. Define success, set realistic goals, and track them. What gets measured gets improved. Empower your analyst; include in mgmt and strategy meetings. The more they know the more they can help. Summarize take-aways, caveats, and relevance. Don’t accept data as is: dig, segment, and identify causes. Lack expertise and budget? Borrow from Finance, Sales, Ops, IT. Bare minimum: get their opinion.
  • 34.
    OPOWER CONFIDENTIAL: DONOT DISTRIBUTE 34 Don’t... Waste time on things that don’t matter Let perfect be the enemy of good Get comfortable No “so what?” metrics or excessive dashboards, teach entire team to pull basic reports. Ask, “What is the impact of data being 95% vs. 100% correct?” (some metrics need to be perfect, others don’t). Keep on iterating; re-evaluate which metrics are still valuable. Switch up what you show to keep engagement. Overlook Quick Wins Start by using data you already have. Difficult and expensive isn’t always better than simple and cheap. Get discouraged Analytics = delayed gratification. It gets better.
  • 35.
    OPOWER CONFIDENTIAL: DONOT DISTRIBUTE 35 Recommended Reading Author: former head of Google’s People Analytics team All about how to get your point across with data – almost entirely within Excel Guide for what makes a good vs. bad graph Her blog: www.storytellingwithdata.com
  • 36.
    OPOWER CONFIDENTIAL: DONOT DISTRIBUTE 36 Q&A