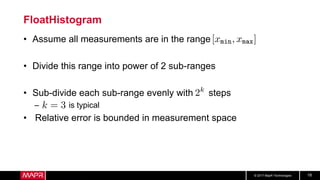
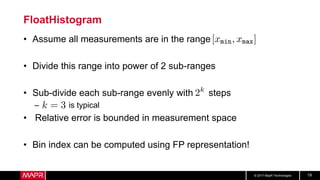
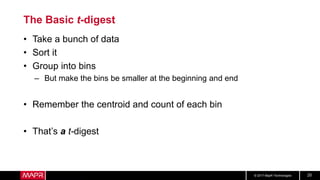
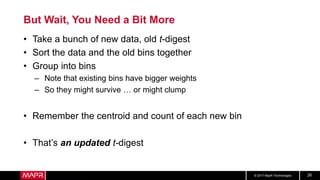
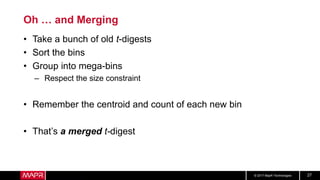
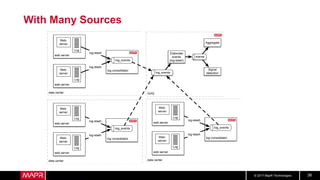
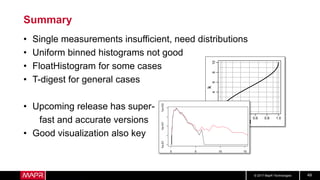
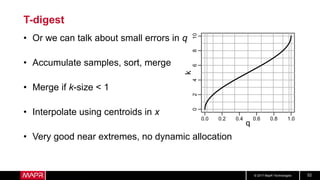
This document discusses t-digest, which provides a compact way to represent a distribution of values. T-digest uses adaptive bins that are smaller near the edges, allowing it to accurately track quantiles even with a limited number of bins. It works by taking data samples, sorting them, and grouping them into bins while respecting a maximum size. The bins can then be merged across samples or time periods. T-digest is useful for applications that need to track distributions over many variables or time periods with limited space.


![© 2017 MapR Technologies 9
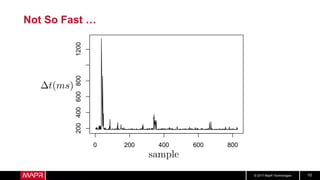
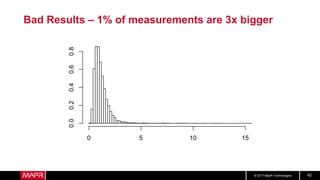
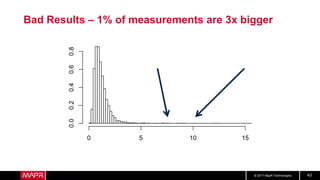
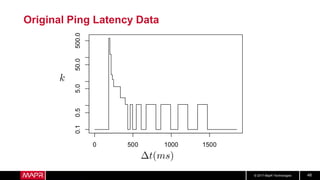
Last Night’s Latencies
• These are ping latencies from my hotel
• Looks pretty good, right?
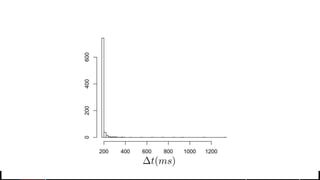
• But what about longer term?
208.302
198.571
185.099
191.258
201.392
214.738
197.389
187.749
201.693
186.762
185.296
186.390
183.960
188.060
190.763
> mean(y$t[i])
[1] 198.6047
> sd(y$t[i])
[1] 71.43965](https://image.slidesharecdn.com/t-digest-update-170619145337/85/T-digest-update-9-320.jpg)