Downloaded 56 times


![© 2017 MapR Technologies 31
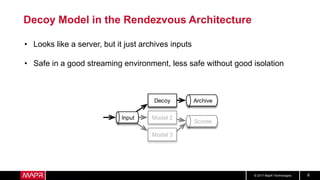
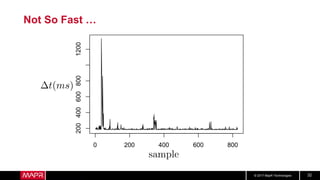
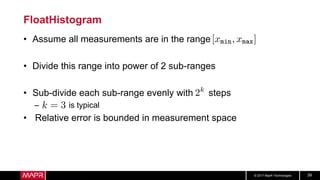
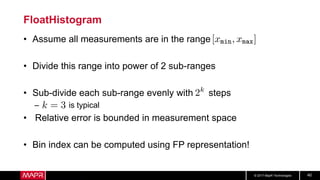
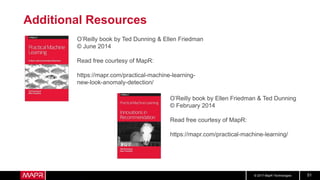
Hotel Room Latencies
• These are ping latencies from my hotel
• Looks pretty good, right?
• But what about longer term?
208.302
198.571
185.099
191.258
201.392
214.738
197.389
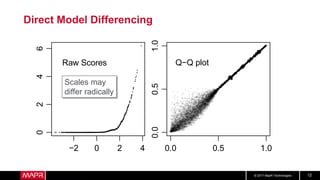
187.749
201.693
186.762
185.296
186.390
183.960
188.060
190.763
> mean(y$t[i])
[1] 198.6047
> sd(y$t[i])
[1] 71.43965](https://image.slidesharecdn.com/webinar-2-model-evaluation-171128225342/85/ML-Workshop-2-Machine-Learning-Model-Comparison-Evaluation-31-320.jpg)


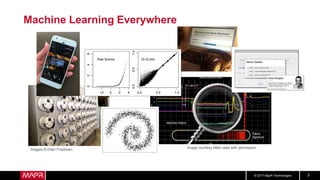
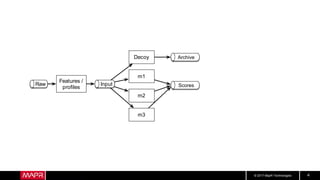
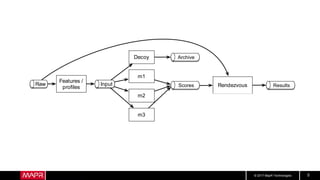
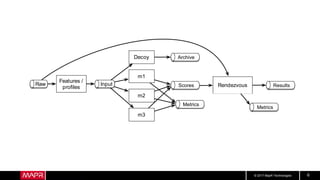
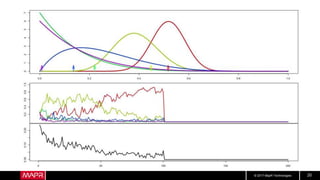
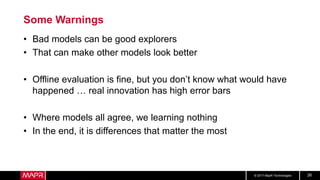
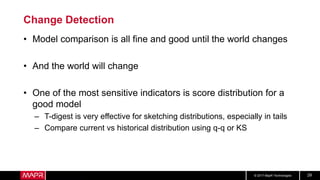
This document discusses machine learning model comparison and evaluation. It describes how the rendezvous architecture in MapR makes evaluation easier by collecting metrics on model performance and allowing direct comparison of models. It also discusses challenges like reject inferencing and the need to balance exploration of new models with exploitation of existing models. The document provides recommendations for change detection and analyzing latency distributions to better evaluate models over time.


![[DSC Europe 25] Ekaterina Bubenko - Behind the Curtain: How Data Roles Collab...](https://cdn.slidesharecdn.com/ss_thumbnails/anmv6x8dstqbbzchoklr-ekaterina-bubenko-behind-the-curtain-how-data-roles-collaborate-in-the-ai-era-a-260123083019-4b252ec7-thumbnail.jpg?width=640&height=640&fit=bounds)


![[DSC Europe 25] Milos Belcevic - Product Professional's Journey to Full-Stack...](https://cdn.slidesharecdn.com/ss_thumbnails/1zovd6fgsycdg4wvgvls-milos-belcevic-product-professionals-journey-to-full-stack-product-developer-260123083019-d993120d-thumbnail.jpg?width=640&height=640&fit=bounds)


