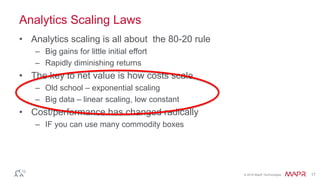
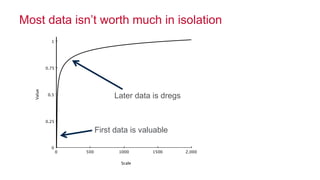
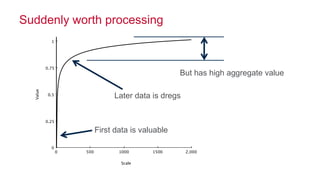
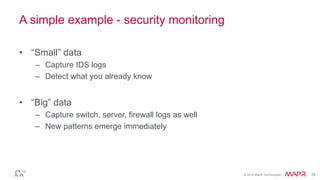
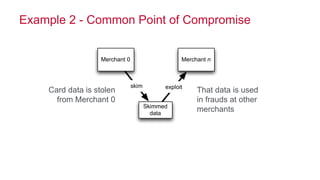
© 2016 MapR Technologies 1© 2014 MapR Technologies
© 2016 MapR Technologies 2© 2014 MapR Technologies
© 2016 MapR Technologies 3
Me, Us
• Ted Dunning, MapR Chief Application Architect, Apache Member
– Committer PMC member Zookeeper, Drill, others
– Mentor for Flink, Beam (nee Dataflow), Drill, Storm, Zeppelin
– VP Incubator
– Bought the beer at the first HUG
• MapR
– Produces first converged platform for big and fast data
– Includes data platform (files, streams, tables) + open source
– Adds major technology for performance, HA, industry standard API’s
• Contact
@ted_dunning, ted.dunning@gmail.com, tdunning@mapr.com
© 2016 MapR Technologies 4
Agenda
• Rationale
• Why cheap isn't the same as simple-minded
• Some techniques
• Examples
© 2016 MapR Technologies 5
Outline
• We have a revolution on our hands
• This leads to a green-field situation
• That implies that many important problems are easy to solve
• The limiting factor is fielding good enough solutions
– Quickly
– With available workforce
• Examples
© 2016 MapR Technologies 6
Is this really a
revolutionary moment?
© 2016 MapR Technologies 7
Big is the next big thing
• Data scale is exploding
• Companies are being funded
• Books are being written
• Applications sprouting up everywhere
© 2016 MapR Technologies 8
Why Now?
• But Moore’s law has applied for a long time
• Why is data exploding now?
• Why not 10 years ago?
• Why not 20?
© 2016 MapR Technologies 9
Size Matters, but …
• If it were just availability of data then existing big companies
would adopt big data technology first
© 2016 MapR Technologies 10
Size Matters, but …
• If it were just availability of data then existing big companies
would adopt big data technology first
They didn’t
© 2016 MapR Technologies 11
Or Maybe Cost
• If it were just a net positive value then finance companies should
adopt first because they have higher opportunity value / byte
© 2016 MapR Technologies 12
Or Maybe Cost
• If it were just a net positive value then finance companies should
adopt first because they have higher opportunity value / byte
They didn’t
© 2016 MapR Technologies 13
Backwards adoption
• Under almost any threshold argument startups would not adopt
big data technology first
© 2016 MapR Technologies 14
Backwards adoption
• Under almost any threshold argument startups would not adopt
big data technology first
They did
© 2016 MapR Technologies 15
Everywhere at Once?
• Something very strange is happening
– Big data is being applied at many different scales
– At many value scales
– By large companies and small
© 2016 MapR Technologies 16
Everywhere at Once?
• Something very strange is happening
– Big data is being applied at many different scales
– At many value scales
– By large companies and small
Why?
© 2016 MapR Technologies 17
Analytics Scaling Laws
• Analytics scaling is all about the 80-20 rule
– Big gains for little initial effort
– Rapidly diminishing returns
• The key to net value is how costs scale
– Old school – exponential scaling
– Big data – linear scaling, low constant
• Cost/performance has changed radically
– IF you can use many commodity boxes
© 2016 MapR Technologies 18
Most data isn’t worth much in isolation
First data is valuable
Later data is dregs
© 2016 MapR Technologies 19
Suddenly worth processing
First data is valuable
Later data is dregs
But has high aggregate value
© 2016 MapR Technologies 20
If we can handle the scale
It’s really big
© 2016 MapR Technologies 21
So what makes
that possible?
© 2016 MapR Technologies 22
2,0000 500 1000 1500
1
0
0.25
0.5
0.75
Scale
Value
© 2016 MapR Technologies 23
2,0000 500 1000 1500
1
0
0.25
0.5
0.75
Scale
Value
2,0000 500 1000 1500
1
0
0.25
0.5
0.75
Scale
Value
Net value optimum has
a sharp peak well
before maximum effort
© 2016 MapR Technologies 24
But scaling laws are
changing both slope and
shape
© 2016 MapR Technologies 25
2,0000 500 1000 1500
1
0
0.25
0.5
0.75
Scale
Value
More than just a
little
© 2016 MapR Technologies 26
2,0000 500 1000 1500
1
0
0.25
0.5
0.75
Scale
Value
They are changing a
LOT!
© 2016 MapR Technologies 27
© 2016 MapR Technologies 28
© 2016 MapR Technologies 29
2,0000 500 1000 1500
1
0
0.25
0.5
0.75
Scale
Value
© 2016 MapR Technologies 30
2,0000 500 1000 1500
1
0
0.25
0.5
0.75
Scale
Value
© 2016 MapR Technologies 31
2,0000 500 1000 1500
1
0
0.25
0.5
0.75
Scale
Value
Initially, linear cost scaling
actually makes things
worse
Then a tipping point is
reached and things change
radically …
© 2016 MapR Technologies 32
Pre-requisites for Tipping
• To reach the tipping point,
• Algorithms must scale out horizontally
– On commodity hardware
– That can and will fail
• Data practice must change
– Denormalized is the new black
– Flexible data dictionaries are the rule
– Structured data becomes rare
© 2016 MapR Technologies 33
With great scale comes great opportunity
• Increasing scale by 1000x changes the game
• We essentially have green fields opening up all around
• Most of the opportunities don’t require advanced learning
© 2016 MapR Technologies 34
OK.
We have a
bona fide revolution
© 2016 MapR Technologies 35
Greenfield Problem Landscape
© 2016 MapR Technologies 36
Mature Problem Landscape
© 2016 MapR Technologies 37
Why is cheap better than deep (sometimes)?
When we have a greenfield, problems can be
– Easy (large number of these)
– Impossible (large number of these)
– Hard but possible (right on the boundary)
In a mature field, problems can be
– Easy (these are already done)
– Impossible (still a large number of these)
– Hard but possible (now the majority of the effort)
© 2016 MapR Technologies 38
Some examples
© 2016 MapR Technologies 39
A simple example - security monitoring
• “Small” data
– Capture IDS logs
– Detect what you already know
• “Big” data
– Capture switch, server, firewall logs as well
– New patterns emerge immediately
© 2016 MapR Technologies 40
Another example – fraud detection
• “Small” data
– Maintain card profiles
– Segment models
– Evaluate all transactions
• “Big” Data
– Maintain card profiles, full 90 day transaction history
– Evaluate all transactions
© 2016 MapR Technologies 41
Another example – indicator-based recommendation
• “Advanced” approach
– Use matrix completion techniques (LDA, NNM, ALS)
– Tune meta-parameters
– Ensembles galore
• “Simple” approach
– Count cooccurrences and cross-occurrences
– Finding “interesting” pairs
– Use standard search engine to recommend
© 2016 MapR Technologies 42
Easy != Stupid
• You still have to do things reasonably well
– Techniques that are not well founded are still problems
• Heuristic frequency ratios still fail
– Coincidences still dominate the data
– Accidental 100% correlations abound
• Related techniques still broken for coincidence
– Pearson’s χ2
– Simple correlations
© 2016 MapR Technologies 43
Scale does not cure wrong
It just makes easy more common
© 2016 MapR Technologies 44
A core technique
• Many of these easy problems reduce to finding interesting
coincidences
• This can be summarized as a 2 x 2 table
• Actually, many of these tables
A Other
B k11 k12
Other k21 k22
© 2016 MapR Technologies 45
How do you do that?
• This is well handled using G2-test
– See wikipedia
– See http://bit.ly/surprise-and-coincidence
• Original application in linguistics now cited > 2000 times
• Available in ElasticSearch, in Solr, in Mahout
• Available in R, C, Java, Python
© 2016 MapR Technologies 46
Which one is the anomalous co-occurrence?
A not A
B 13 1000
not B 1000 100,000
A not A
B 1 0
not B 0 10,000
A not A
B 10 0
not B 0 100,000
A not A
B 1 0
not B 0 2
© 2016 MapR Technologies 47
Which one is the anomalous co-occurrence?
A not A
B 13 1000
not B 1000 100,000
A not A
B 1 0
not B 0 10,000
A not A
B 10 0
not B 0 100,000
A not A
B 1 0
not B 0 2
0.90 1.95
4.52 14.3
Dunning Ted, Accurate Methods for the Statistics of Surprise and Coincidence,
Computational Linguistics vol 19 no. 1 (1993)
© 2016 MapR Technologies 48
So we can find
interesting coincidences.
That gets us exactly what?
© 2016 MapR Technologies 49
Operation Ababil – Brobots on Parade
• Dork attack to find unpatched default Joomla sites
– Especially web servers with high bandwidth connections
– Basically just Google searches for default strings
– Joomla compromised into attack Brobot
• C&C network checks in occasionally
– Note C&C is incoming request and looks like normal web requests
• Later, on command, multiple Brobots direct 50-75 Gb/s of attack
– Attacks come from white-listed sites
© 2016 MapR Technologies 50
Attack Sequence
Source
First level
C&C
Second
level C&C
© 2016 MapR Technologies 51
Google
Attack Sequence
Source
First level
C&C
Second
level C&C
© 2016 MapR Technologies 52
Brobot
Brobot
Brobot
Attack Sequence
Source
First level
C&C
Second
level C&C
© 2016 MapR Technologies 53
Target
Brobot
Brobot
Brobot
Attack Sequence
Source
First level
C&C
Second
level C&C
© 2016 MapR Technologies 54
Outline of an Advanced Persistent Threat
• Advanced
– Common use of zero-day for preliminary attacks
– Often attributed to state-level actors
– Modern privateers blur the line
• Persistent
– Result of first attack is heavily muffled, no immediate exploit
– Remote access toolset installed (RAT)
• Threat
– On command, data is exfiltrated covertly or en masse
– Or the compromised host is used for other nefarious purpose
© 2016 MapR Technologies 55
APT in Summary
• Attack, penetrate, pivot, exfiltrate or exploit
• If you are a high-value target, attack is likely and stealthy
– High-value = telecom, banks, utilities, retail targets, web100
– … and all their vendors
– Conventional multi-factor auth is easily breached
• Penetration and pivot are critical counter-measure opportunities
– In 2010, RAT would contact command and control (C&C)
– In 2016, C&C looks like normal traffic
• Once exfiltration or exploit starts, you may no longer have a
business
© 2016 MapR Technologies 56
Target
Brobot
Brobot
Brobot
Example 1 - Ababil
Source
First level
C&C
Second
level C&C
Defense has to
happen here
© 2016 MapR Technologies 57
Spot the Important Difference?
GET /personal/comparison-table.jsp?iODg2OQ=51a90 HTTP/1.1
Host: www.sometarget.com
User-Agent: Mozilla/4.0 (compatible; MSIE 6.0; Windows NT 5.1;)
Accept-Encoding: deflate
Accept-Charset: UTF-8
Accept-Language: fr
Cache-Control: no-cache
Pragma: no-cache
Connection: Keep-Alive
GET /photo.jpg HTTP/1.1
Host: lh4.googleusercontent.com
User-Agent: Mozilla/5.0 (Macint
Accept: image/png,image/*;q=0.8
Accept-Language: en-US,en;q=0.5
Accept-Encoding: gzip, deflate,
Referer: https://www.google.com
Connection: keep-alive
If-None-Match: "v9”
Cache-Control: max-age=0
Attacker request Real request
© 2016 MapR Technologies 58
Spot the Important Difference?
GET /personal/comparison-table.jsp?iODg2OQ=51a90 HTTP/1.1
Host: www.sometarget.com
User-Agent: Mozilla/4.0 (compatible; MSIE 6.0; Windows NT 5.1;)
Accept-Encoding: deflate
Accept-Charset: UTF-8
Accept-Language: fr
Cache-Control: no-cache
Pragma: no-cache
Connection: Keep-Alive
GET /photo.jpg HTTP/1.1
Host: lh4.googleusercontent.com
User-Agent: Mozilla/5.0 (Macint
Accept: image/png,image/*;q=0.8
Accept-Language: en-US,en;q=0.5
Accept-Encoding: gzip, deflate,
Referer: https://www.google.com
Connection: keep-alive
If-None-Match: "v9”
Cache-Control: max-age=0
Attacker request Real request
© 2016 MapR Technologies 59
This could only be found at scale
© 2016 MapR Technologies 60
This could only be found at scale
But at scale, it is stupidly simple
to find
© 2016 MapR Technologies 61
Target
Brobot
Brobot
Brobot
Overall Outline Again
Source
First level
C&C
Second
level C&C
Tradecraft error!
© 2016 MapR Technologies 62
Large corpus analysis of source
IP’s wins big
© 2016 MapR Technologies 63
© 2016 MapR Technologies 64
Example 2 - Common Point of Compromise
• Scenario:
– Merchant 0 is compromised, leaks account data during compromise
– Fraud committed elsewhere during exploit
– High background level of fraud
– Limited detection rate for exploits
• Goal:
– Find merchant 0
• Meta-goal:
– Screen algorithms for this task without leaking sensitive data
© 2016 MapR Technologies 65
Example 2 - Common Point of Compromise
skim exploit
Merchant 0
Skimmed
data
Merchant n
Card data is stolen
from Merchant 0
That data is used
in frauds at other
merchants
© 2016 MapR Technologies 66
Simulation Setup
0 20 40 60 80 100
0100300500
day
count
Compromise period
Exploit period
compromises
frauds
© 2016 MapR Technologies 67
Detection Strategy
• Select histories that precede non-fraud
• And histories that precede fraud detection
• Analyze 2x2 cooccurrence of merchant n versus fraud detection
© 2016 MapR Technologies 68
© 2016 MapR Technologies 69
What about the
real world?
© 2016 MapR Technologies 70
●●●●●●●●●●●●●●●●●●●● ● ●● ●●● ●●● ●●●●● ●●●●● ●●● ●●● ●● ● ●● ●● ●● ● ●●●● ●●●● ●● ●●●● ●●●● ●●● ●● ●● ● ●● ● ●●●● ●● ● ●●●● ●●●●●● ●● ●● ●●● ●●● ●●●●● ● ●●● ●● ●●● ●●● ●● ●●●● ●
●● ●●● ●●● ●
●
● ●●
●
●
●
●●
020406080
LLR score for real data
Number of Merchants
BreachScore(LLR)
Real truly bad guys
100
101
102
103
104
105
106
Really truly bad guys
© 2016 MapR Technologies 71
Historical cooccurrence gives high
S/N
© 2016 MapR Technologies 72
Historical cooccurrence gives high
S/N
(we win)
© 2016 MapR Technologies 73
Cooccurrence AnalysisCooccurrence Analysis
© 2016 MapR Technologies 74
Real-life example
• Query: “Paco de Lucia”
• Conventional meta-data search results:
– “hombres de paco” times 400
– not much else
• Recommendation based search:
– Flamenco guitar and dancers
– Spanish and classical guitar
– Van Halen doing a classical/flamenco riff
© 2016 MapR Technologies 75
Real-life example
© 2016 MapR Technologies 76
So …
• There are suddenly lots of these problems
• Simple techniques have surprising power at scale
– Cooccurrence via G2 / LLR
– Distributional anomaly detection via t-digest
• These simple techniques are largely unsuitable for academic
research
• But they are highly applicable in resource constrained industrial
settings
© 2016 MapR Technologies 77
●●●●●●●●●●●●●●●●●●●● ● ●● ●●● ●●● ●●●●● ●●●●● ●●● ●●● ●● ● ●● ●● ●● ● ●●●● ●●●● ●● ●●●● ●●●● ●●● ●● ●● ● ●● ● ●●●● ●● ● ●●●● ●●●●●● ●● ●● ●●● ●●● ●●●●● ● ●●● ●● ●●● ●●● ●● ●●●● ●
●● ●●● ●●● ●
●
● ●●
●
●
●
●●
020406080
LLR score for real data
Number of Merchants
BreachScore(LLR)
Real truly bad guys
100
101
102
103
104
105
106
Cooccurrence An
Summary
• We live in a golden age of newly achieved scale
• That scale has lowered the tree
– Hard problems are much easier
– Lots of low-hanging fruit all around us
• Cheap learning has huge value
• Code available at
http://github.com/tdunning 0 20 40 60 80 100
0100300500
day
count
Compromise period
Exploit period
compromises
frauds
© 2016 MapR Technologies 78
Me, Us
• Ted Dunning, MapR Chief Application Architect, Apache Member
– Committer PMC member Zookeeper, Drill, others
– Mentor for Flink, Beam (nee Dataflow), Drill, Storm, Zeppelin
– VP Incubator
– Bought the beer at the first HUG
• MapR
– Produces a converged platform for big and fast data
– Includes data platform (files, streams, tables) + open source
– Adds major technology for performance, HA, industry standard API’s
• Contact
@ted_dunning, ted.dunning@gmail.com, tdunning@mapr.com
© 2016 MapR Technologies 79
Q & A

Deep Learning vs. Cheap Learning

  • 1.
    © 2016 MapRTechnologies 1© 2014 MapR Technologies
  • 2.
    © 2016 MapRTechnologies 2© 2014 MapR Technologies
  • 3.
    © 2016 MapRTechnologies 3 Me, Us • Ted Dunning, MapR Chief Application Architect, Apache Member – Committer PMC member Zookeeper, Drill, others – Mentor for Flink, Beam (nee Dataflow), Drill, Storm, Zeppelin – VP Incubator – Bought the beer at the first HUG • MapR – Produces first converged platform for big and fast data – Includes data platform (files, streams, tables) + open source – Adds major technology for performance, HA, industry standard API’s • Contact @ted_dunning, ted.dunning@gmail.com, tdunning@mapr.com
  • 4.
    © 2016 MapRTechnologies 4 Agenda • Rationale • Why cheap isn't the same as simple-minded • Some techniques • Examples
  • 5.
    © 2016 MapRTechnologies 5 Outline • We have a revolution on our hands • This leads to a green-field situation • That implies that many important problems are easy to solve • The limiting factor is fielding good enough solutions – Quickly – With available workforce • Examples
  • 6.
    © 2016 MapRTechnologies 6 Is this really a revolutionary moment?
  • 7.
    © 2016 MapRTechnologies 7 Big is the next big thing • Data scale is exploding • Companies are being funded • Books are being written • Applications sprouting up everywhere
  • 8.
    © 2016 MapRTechnologies 8 Why Now? • But Moore’s law has applied for a long time • Why is data exploding now? • Why not 10 years ago? • Why not 20?
  • 9.
    © 2016 MapRTechnologies 9 Size Matters, but … • If it were just availability of data then existing big companies would adopt big data technology first
  • 10.
    © 2016 MapRTechnologies 10 Size Matters, but … • If it were just availability of data then existing big companies would adopt big data technology first They didn’t
  • 11.
    © 2016 MapRTechnologies 11 Or Maybe Cost • If it were just a net positive value then finance companies should adopt first because they have higher opportunity value / byte
  • 12.
    © 2016 MapRTechnologies 12 Or Maybe Cost • If it were just a net positive value then finance companies should adopt first because they have higher opportunity value / byte They didn’t
  • 13.
    © 2016 MapRTechnologies 13 Backwards adoption • Under almost any threshold argument startups would not adopt big data technology first
  • 14.
    © 2016 MapRTechnologies 14 Backwards adoption • Under almost any threshold argument startups would not adopt big data technology first They did
  • 15.
    © 2016 MapRTechnologies 15 Everywhere at Once? • Something very strange is happening – Big data is being applied at many different scales – At many value scales – By large companies and small
  • 16.
    © 2016 MapRTechnologies 16 Everywhere at Once? • Something very strange is happening – Big data is being applied at many different scales – At many value scales – By large companies and small Why?
  • 17.
    © 2016 MapRTechnologies 17 Analytics Scaling Laws • Analytics scaling is all about the 80-20 rule – Big gains for little initial effort – Rapidly diminishing returns • The key to net value is how costs scale – Old school – exponential scaling – Big data – linear scaling, low constant • Cost/performance has changed radically – IF you can use many commodity boxes
  • 18.
    © 2016 MapRTechnologies 18 Most data isn’t worth much in isolation First data is valuable Later data is dregs
  • 19.
    © 2016 MapRTechnologies 19 Suddenly worth processing First data is valuable Later data is dregs But has high aggregate value
  • 20.
    © 2016 MapRTechnologies 20 If we can handle the scale It’s really big
  • 21.
    © 2016 MapRTechnologies 21 So what makes that possible?
  • 22.
    © 2016 MapRTechnologies 22 2,0000 500 1000 1500 1 0 0.25 0.5 0.75 Scale Value
  • 23.
    © 2016 MapRTechnologies 23 2,0000 500 1000 1500 1 0 0.25 0.5 0.75 Scale Value 2,0000 500 1000 1500 1 0 0.25 0.5 0.75 Scale Value Net value optimum has a sharp peak well before maximum effort
  • 24.
    © 2016 MapRTechnologies 24 But scaling laws are changing both slope and shape
  • 25.
    © 2016 MapRTechnologies 25 2,0000 500 1000 1500 1 0 0.25 0.5 0.75 Scale Value More than just a little
  • 26.
    © 2016 MapRTechnologies 26 2,0000 500 1000 1500 1 0 0.25 0.5 0.75 Scale Value They are changing a LOT!
  • 27.
    © 2016 MapRTechnologies 27
  • 28.
    © 2016 MapRTechnologies 28
  • 29.
    © 2016 MapRTechnologies 29 2,0000 500 1000 1500 1 0 0.25 0.5 0.75 Scale Value
  • 30.
    © 2016 MapRTechnologies 30 2,0000 500 1000 1500 1 0 0.25 0.5 0.75 Scale Value
  • 31.
    © 2016 MapRTechnologies 31 2,0000 500 1000 1500 1 0 0.25 0.5 0.75 Scale Value Initially, linear cost scaling actually makes things worse Then a tipping point is reached and things change radically …
  • 32.
    © 2016 MapRTechnologies 32 Pre-requisites for Tipping • To reach the tipping point, • Algorithms must scale out horizontally – On commodity hardware – That can and will fail • Data practice must change – Denormalized is the new black – Flexible data dictionaries are the rule – Structured data becomes rare
  • 33.
    © 2016 MapRTechnologies 33 With great scale comes great opportunity • Increasing scale by 1000x changes the game • We essentially have green fields opening up all around • Most of the opportunities don’t require advanced learning
  • 34.
    © 2016 MapRTechnologies 34 OK. We have a bona fide revolution
  • 35.
    © 2016 MapRTechnologies 35 Greenfield Problem Landscape
  • 36.
    © 2016 MapRTechnologies 36 Mature Problem Landscape
  • 37.
    © 2016 MapRTechnologies 37 Why is cheap better than deep (sometimes)? When we have a greenfield, problems can be – Easy (large number of these) – Impossible (large number of these) – Hard but possible (right on the boundary) In a mature field, problems can be – Easy (these are already done) – Impossible (still a large number of these) – Hard but possible (now the majority of the effort)
  • 38.
    © 2016 MapRTechnologies 38 Some examples
  • 39.
    © 2016 MapRTechnologies 39 A simple example - security monitoring • “Small” data – Capture IDS logs – Detect what you already know • “Big” data – Capture switch, server, firewall logs as well – New patterns emerge immediately
  • 40.
    © 2016 MapRTechnologies 40 Another example – fraud detection • “Small” data – Maintain card profiles – Segment models – Evaluate all transactions • “Big” Data – Maintain card profiles, full 90 day transaction history – Evaluate all transactions
  • 41.
    © 2016 MapRTechnologies 41 Another example – indicator-based recommendation • “Advanced” approach – Use matrix completion techniques (LDA, NNM, ALS) – Tune meta-parameters – Ensembles galore • “Simple” approach – Count cooccurrences and cross-occurrences – Finding “interesting” pairs – Use standard search engine to recommend
  • 42.
    © 2016 MapRTechnologies 42 Easy != Stupid • You still have to do things reasonably well – Techniques that are not well founded are still problems • Heuristic frequency ratios still fail – Coincidences still dominate the data – Accidental 100% correlations abound • Related techniques still broken for coincidence – Pearson’s χ2 – Simple correlations
  • 43.
    © 2016 MapRTechnologies 43 Scale does not cure wrong It just makes easy more common
  • 44.
    © 2016 MapRTechnologies 44 A core technique • Many of these easy problems reduce to finding interesting coincidences • This can be summarized as a 2 x 2 table • Actually, many of these tables A Other B k11 k12 Other k21 k22
  • 45.
    © 2016 MapRTechnologies 45 How do you do that? • This is well handled using G2-test – See wikipedia – See http://bit.ly/surprise-and-coincidence • Original application in linguistics now cited > 2000 times • Available in ElasticSearch, in Solr, in Mahout • Available in R, C, Java, Python
  • 46.
    © 2016 MapRTechnologies 46 Which one is the anomalous co-occurrence? A not A B 13 1000 not B 1000 100,000 A not A B 1 0 not B 0 10,000 A not A B 10 0 not B 0 100,000 A not A B 1 0 not B 0 2
  • 47.
    © 2016 MapRTechnologies 47 Which one is the anomalous co-occurrence? A not A B 13 1000 not B 1000 100,000 A not A B 1 0 not B 0 10,000 A not A B 10 0 not B 0 100,000 A not A B 1 0 not B 0 2 0.90 1.95 4.52 14.3 Dunning Ted, Accurate Methods for the Statistics of Surprise and Coincidence, Computational Linguistics vol 19 no. 1 (1993)
  • 48.
    © 2016 MapRTechnologies 48 So we can find interesting coincidences. That gets us exactly what?
  • 49.
    © 2016 MapRTechnologies 49 Operation Ababil – Brobots on Parade • Dork attack to find unpatched default Joomla sites – Especially web servers with high bandwidth connections – Basically just Google searches for default strings – Joomla compromised into attack Brobot • C&C network checks in occasionally – Note C&C is incoming request and looks like normal web requests • Later, on command, multiple Brobots direct 50-75 Gb/s of attack – Attacks come from white-listed sites
  • 50.
    © 2016 MapRTechnologies 50 Attack Sequence Source First level C&C Second level C&C
  • 51.
    © 2016 MapRTechnologies 51 Google Attack Sequence Source First level C&C Second level C&C
  • 52.
    © 2016 MapRTechnologies 52 Brobot Brobot Brobot Attack Sequence Source First level C&C Second level C&C
  • 53.
    © 2016 MapRTechnologies 53 Target Brobot Brobot Brobot Attack Sequence Source First level C&C Second level C&C
  • 54.
    © 2016 MapRTechnologies 54 Outline of an Advanced Persistent Threat • Advanced – Common use of zero-day for preliminary attacks – Often attributed to state-level actors – Modern privateers blur the line • Persistent – Result of first attack is heavily muffled, no immediate exploit – Remote access toolset installed (RAT) • Threat – On command, data is exfiltrated covertly or en masse – Or the compromised host is used for other nefarious purpose
  • 55.
    © 2016 MapRTechnologies 55 APT in Summary • Attack, penetrate, pivot, exfiltrate or exploit • If you are a high-value target, attack is likely and stealthy – High-value = telecom, banks, utilities, retail targets, web100 – … and all their vendors – Conventional multi-factor auth is easily breached • Penetration and pivot are critical counter-measure opportunities – In 2010, RAT would contact command and control (C&C) – In 2016, C&C looks like normal traffic • Once exfiltration or exploit starts, you may no longer have a business
  • 56.
    © 2016 MapRTechnologies 56 Target Brobot Brobot Brobot Example 1 - Ababil Source First level C&C Second level C&C Defense has to happen here
  • 57.
    © 2016 MapRTechnologies 57 Spot the Important Difference? GET /personal/comparison-table.jsp?iODg2OQ=51a90 HTTP/1.1 Host: www.sometarget.com User-Agent: Mozilla/4.0 (compatible; MSIE 6.0; Windows NT 5.1;) Accept-Encoding: deflate Accept-Charset: UTF-8 Accept-Language: fr Cache-Control: no-cache Pragma: no-cache Connection: Keep-Alive GET /photo.jpg HTTP/1.1 Host: lh4.googleusercontent.com User-Agent: Mozilla/5.0 (Macint Accept: image/png,image/*;q=0.8 Accept-Language: en-US,en;q=0.5 Accept-Encoding: gzip, deflate, Referer: https://www.google.com Connection: keep-alive If-None-Match: "v9” Cache-Control: max-age=0 Attacker request Real request
  • 58.
    © 2016 MapRTechnologies 58 Spot the Important Difference? GET /personal/comparison-table.jsp?iODg2OQ=51a90 HTTP/1.1 Host: www.sometarget.com User-Agent: Mozilla/4.0 (compatible; MSIE 6.0; Windows NT 5.1;) Accept-Encoding: deflate Accept-Charset: UTF-8 Accept-Language: fr Cache-Control: no-cache Pragma: no-cache Connection: Keep-Alive GET /photo.jpg HTTP/1.1 Host: lh4.googleusercontent.com User-Agent: Mozilla/5.0 (Macint Accept: image/png,image/*;q=0.8 Accept-Language: en-US,en;q=0.5 Accept-Encoding: gzip, deflate, Referer: https://www.google.com Connection: keep-alive If-None-Match: "v9” Cache-Control: max-age=0 Attacker request Real request
  • 59.
    © 2016 MapRTechnologies 59 This could only be found at scale
  • 60.
    © 2016 MapRTechnologies 60 This could only be found at scale But at scale, it is stupidly simple to find
  • 61.
    © 2016 MapRTechnologies 61 Target Brobot Brobot Brobot Overall Outline Again Source First level C&C Second level C&C Tradecraft error!
  • 62.
    © 2016 MapRTechnologies 62 Large corpus analysis of source IP’s wins big
  • 63.
    © 2016 MapRTechnologies 63
  • 64.
    © 2016 MapRTechnologies 64 Example 2 - Common Point of Compromise • Scenario: – Merchant 0 is compromised, leaks account data during compromise – Fraud committed elsewhere during exploit – High background level of fraud – Limited detection rate for exploits • Goal: – Find merchant 0 • Meta-goal: – Screen algorithms for this task without leaking sensitive data
  • 65.
    © 2016 MapRTechnologies 65 Example 2 - Common Point of Compromise skim exploit Merchant 0 Skimmed data Merchant n Card data is stolen from Merchant 0 That data is used in frauds at other merchants
  • 66.
    © 2016 MapRTechnologies 66 Simulation Setup 0 20 40 60 80 100 0100300500 day count Compromise period Exploit period compromises frauds
  • 67.
    © 2016 MapRTechnologies 67 Detection Strategy • Select histories that precede non-fraud • And histories that precede fraud detection • Analyze 2x2 cooccurrence of merchant n versus fraud detection
  • 68.
    © 2016 MapRTechnologies 68
  • 69.
    © 2016 MapRTechnologies 69 What about the real world?
  • 70.
    © 2016 MapRTechnologies 70 ●●●●●●●●●●●●●●●●●●●● ● ●● ●●● ●●● ●●●●● ●●●●● ●●● ●●● ●● ● ●● ●● ●● ● ●●●● ●●●● ●● ●●●● ●●●● ●●● ●● ●● ● ●● ● ●●●● ●● ● ●●●● ●●●●●● ●● ●● ●●● ●●● ●●●●● ● ●●● ●● ●●● ●●● ●● ●●●● ● ●● ●●● ●●● ● ● ● ●● ● ● ● ●● 020406080 LLR score for real data Number of Merchants BreachScore(LLR) Real truly bad guys 100 101 102 103 104 105 106 Really truly bad guys
  • 71.
    © 2016 MapRTechnologies 71 Historical cooccurrence gives high S/N
  • 72.
    © 2016 MapRTechnologies 72 Historical cooccurrence gives high S/N (we win)
  • 73.
    © 2016 MapRTechnologies 73 Cooccurrence AnalysisCooccurrence Analysis
  • 74.
    © 2016 MapRTechnologies 74 Real-life example • Query: “Paco de Lucia” • Conventional meta-data search results: – “hombres de paco” times 400 – not much else • Recommendation based search: – Flamenco guitar and dancers – Spanish and classical guitar – Van Halen doing a classical/flamenco riff
  • 75.
    © 2016 MapRTechnologies 75 Real-life example
  • 76.
    © 2016 MapRTechnologies 76 So … • There are suddenly lots of these problems • Simple techniques have surprising power at scale – Cooccurrence via G2 / LLR – Distributional anomaly detection via t-digest • These simple techniques are largely unsuitable for academic research • But they are highly applicable in resource constrained industrial settings
  • 77.
    © 2016 MapRTechnologies 77 ●●●●●●●●●●●●●●●●●●●● ● ●● ●●● ●●● ●●●●● ●●●●● ●●● ●●● ●● ● ●● ●● ●● ● ●●●● ●●●● ●● ●●●● ●●●● ●●● ●● ●● ● ●● ● ●●●● ●● ● ●●●● ●●●●●● ●● ●● ●●● ●●● ●●●●● ● ●●● ●● ●●● ●●● ●● ●●●● ● ●● ●●● ●●● ● ● ● ●● ● ● ● ●● 020406080 LLR score for real data Number of Merchants BreachScore(LLR) Real truly bad guys 100 101 102 103 104 105 106 Cooccurrence An Summary • We live in a golden age of newly achieved scale • That scale has lowered the tree – Hard problems are much easier – Lots of low-hanging fruit all around us • Cheap learning has huge value • Code available at http://github.com/tdunning 0 20 40 60 80 100 0100300500 day count Compromise period Exploit period compromises frauds
  • 78.
    © 2016 MapRTechnologies 78 Me, Us • Ted Dunning, MapR Chief Application Architect, Apache Member – Committer PMC member Zookeeper, Drill, others – Mentor for Flink, Beam (nee Dataflow), Drill, Storm, Zeppelin – VP Incubator – Bought the beer at the first HUG • MapR – Produces a converged platform for big and fast data – Includes data platform (files, streams, tables) + open source – Adds major technology for performance, HA, industry standard API’s • Contact @ted_dunning, ted.dunning@gmail.com, tdunning@mapr.com
  • 79.
    © 2016 MapRTechnologies 79 Q & A

Editor's Notes

  • #8 Why is big data sooo fashionable with big and small companies from different industries? What has suddenly changed?
  • #9 But we have seen constant growth for a long time. And simple growth would only explain some kinds of companies starting with big data (probably big ones) and then slow adoption. Databases started with big companies and took 20 years or more to reach everywhere because the need exceeded cost at different times for different companies. The internet, on the other hand, largely happened to everybody at the same time so it changed things in nearly all industries at all scales nearly simultaneously. Why is big data exploding right now and why is it exploding at all?
  • #18 The different kinds of scaling laws have different shape and I think that shape is the key.
  • #19 The value of analytics always increases with more data, but the rate of increase drops dramatically after an initial quick increase.
  • #20 The value of analytics always increases with more data, but the rate of increase drops dramatically after an initial quick increase.
  • #21 The value of analytics always increases with more data, but the rate of increase drops dramatically after an initial quick increase.
  • #23 In classical analytics, the cost of doing analytics increases sharply.
  • #24 The result is a net value that has a sharp optimum in the area where value is increasing rapidly and cost is not yet increasing so rapidly.
  • #25 New techniques such as Hadoop result in linear scaling of cost. This is a change in shape and it causes a qualitative change in the way that costs trade off against value to give net value. As technology improves, the slope of this cost line is also changing rapidly over time.
  • #28 This next sequence shows how the net value changes with different slope linear cost models.
  • #30 Notice how the best net value has jumped up significantly
  • #31 And as the line approaches horizontal, the highest net value occurs at dramatically larger data scale.
  • #76 Laugh on tech term in American English = garbage 10:38