This document discusses methods for determining the order of a chemical reaction. It defines key terms like rate of reaction, order of reaction, molecularity, and half-life. It describes several methods to determine the order of a reaction:
1) The substitution method involves substituting concentration data into integrated rate equations for zero, first, and second order reactions to determine which gives a constant rate constant.
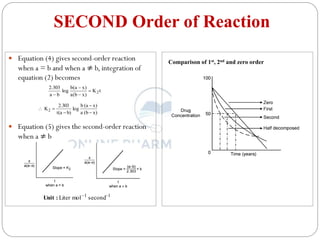
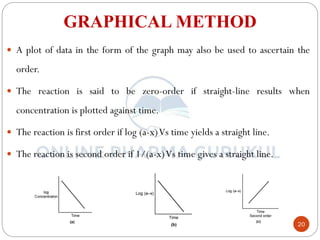
2) The graphical method plots concentration data versus time in different ways depending on the suspected order to identify linear relationships.
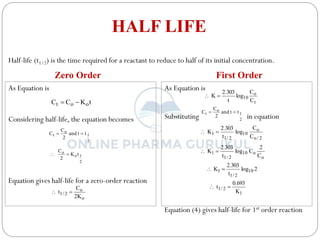
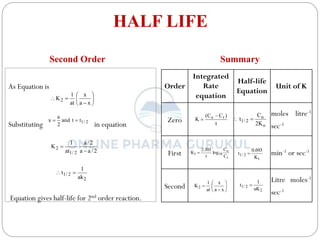
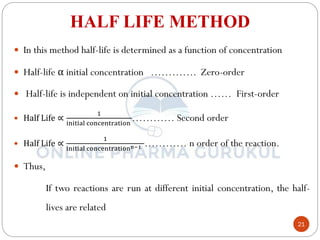
3) The half-life method examines how half-life depends on initial concentration to infer order.
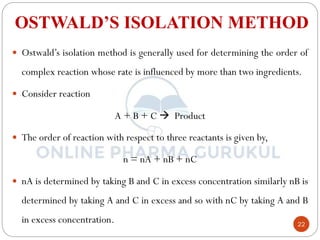
4) Ostwald's isolation method determines partial orders with respect to each reactant by

![5
ii) Rate of reaction:
Law of Mass action states that the rate of a chemical reaction is
directly proportional to the active mass of reacting substances.
OR
The rate of a chemical reaction is proportional to the product of the
molar concentration of reactant each raised to a power equal to the
number of molecules of a substance undergoing reaction.
i.e. xA + yB product
where, K is proportionality constant called as the rate constant and
equation is called as Rate law or Rate equation.
y
x
]
B
[
]
A
[
Rate
y
x
]
B
[
]
A
[
K
Rate
](https://image.slidesharecdn.com/sy-ppii-drugstability-240204064108-da150604/85/SY-PP-II-Drug-Stability-pdf-5-320.jpg)
![6
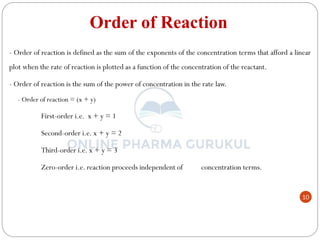
iii) Order of reaction:
- Order of reaction is defined as the sum of the exponents of the
concentration terms that afford a linear plot when the rate of reaction
is plotted as a function of the concentration of the reactant.
- Order of reaction is the sum of the power of concentration in the
rate law.
- Order of reaction = (x + y)
First-order i.e. x + y = 1
Second-order i.e. x + y = 2
Third-order i.e. x + y = 3
Zero-order i.e. reaction proceeds independent of
concentration terms.
y
x
]
B
[
]
A
[
K
Rate
When ](https://image.slidesharecdn.com/sy-ppii-drugstability-240204064108-da150604/85/SY-PP-II-Drug-Stability-pdf-6-320.jpg)
![SECOND Order of Reaction
In the simplest case when a = b, then equation
(2) can be written as
Integrating the above equation,
In the second-order reaction, the rate of
reaction depends on the concentration terms
of reactant raised to power one.
Suppose in reaction A + B Product
where K2 is Second-order rate constant
If 'a' and 'b' are the initial concentration of A and
B when t = 0 and if ‘x’ is the concentration of
each species when t = t then
]
B
[
]
A
[
dt
]
B
[
d
dt
]
A
[
d
]
B
[
]
A
[
K
dt
]
B
[
d
dt
]
A
[
d
2
)
x
b
(
)
x
a
(
K
dt
dx
2
2
2 )
x
a
(
K
dt
dx
dt
K
)
x
a
(
dx
2
2
dt
K
)
x
a
(
dx
t
0
2
2
x
0
t
K
0
a
1
x
a
1
2
t
K
)
x
a
(
a
x
2
x
a
x
at
1
K2](https://image.slidesharecdn.com/sy-ppii-drugstability-240204064108-da150604/85/SY-PP-II-Drug-Stability-pdf-13-320.jpg)