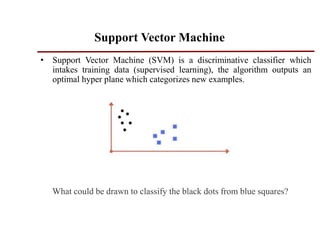
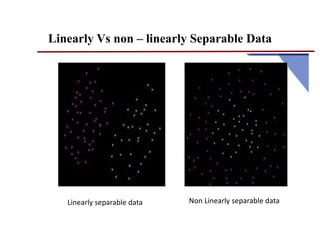
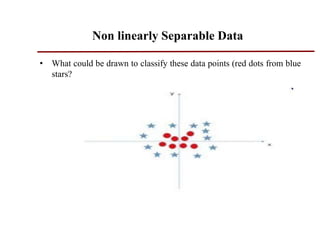
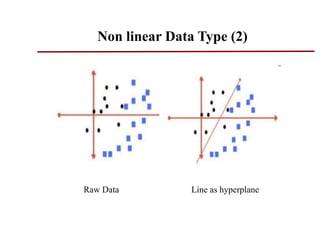
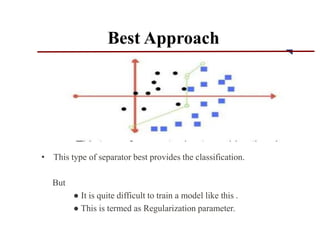
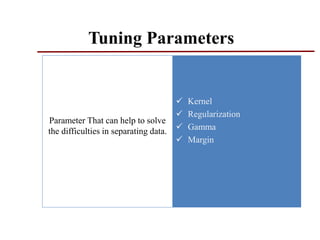
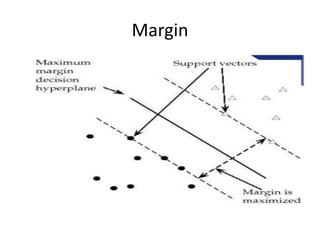
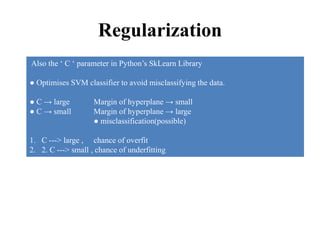
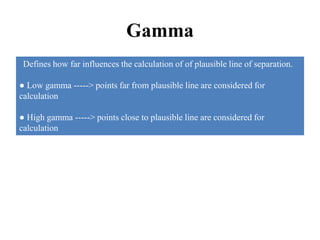
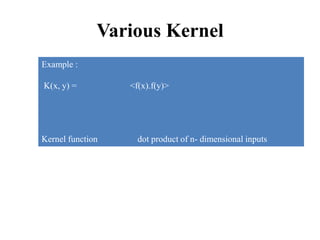
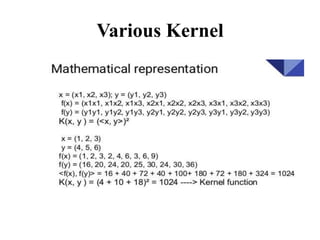
Support Vector Machine
• Support Vector Machine (SVM) is a discriminative classifier which
intakes training data (supervised learning), the algorithm outputs an
optimal hyper plane which categorizes new examples.
What could be drawn to classify the black dots from blue squares?
Support Vector Machine
• Linearly Separable Data
A Line drawn between these data point classify the black dots
and blue squares.
Linearly Vs non – linearly Separable Data
Linearly separable data Non Linearly separable data
Non linearly Separable Data
• What could be drawn to classify these data points (red dots from blue
stars?
Non linearly Separable Data
• Here the hyperplane is a 2d plane drawn parallel to x-axis that is the
separator.
Non linear Data Type (2)
Raw Data Line as hyperplane
For the previous data the line , if used as a Hyperplane
 Two black dots also fall in category of blue squares
 Data separation is not perfect
 It tolerates some outliers in the classification
Non linear Data Type (2)
• This type of separator best provides the classification.
But
● It is quite difficult to train a model like this .
● This is termed as Regularization parameter.
Best Approach
 Kernel
 Regularization
 Gamma
 Margin
Tuning Parameters
Parameter That can help to solve
the difficulties in separating data.
Margin
 Margin is the perpendicular distance between the closest data points and
the Hyperplane ( on both sides )
 The best optimised line ( hyperplane ) with maximum margin is termed as
Margin Maximal Hyperplane.
 The closest points where the margin distance is calculated are considered
as the support vectors.
Margin
Regularization
Also the ‘ C ‘ parameter in Python’s SkLearn Library
● Optimises SVM classifier to avoid misclassifying the data.
● C → large Margin of hyperplane → small
● C → small Margin of hyperplane → large
● misclassification(possible)
1. C ---> large , chance of overfit
2. 2. C ---> small , chance of underfitting
Regularization
Gamma
Defines how far influences the calculation of of plausible line of separation.
● Low gamma -----> points far from plausible line are considered for
calculation
● High gamma -----> points close to plausible line are considered for
calculation
Gamma
Kernel
Mathematical functions for transforming data
● using some linear algebra
● Different SVM algorithms use different types of kernel functions
Various Kernel
• 1. Linear kernel
• 2. Non - linear kernel
• 3. Radial basis function ( RBF )
• 4. Sigmoid
• 5. Polynomial
• 6. Exponential
Various Kernel
Example :
K(x, y) = <f(x).f(y)>
Kernel function dot product of n- dimensional inputs
Various Kernel
Pros
Cons
● It doesn’t perform well, when we have large data set because the
required training time is higher
● It also doesn’t perform very well, when the data set has more noise i.e.
target classes are overlapping
● SVM doesn’t directly provide probability estimates, these are
calculated using an expensive five-fold cross-validation. It is related
SVC method of Python scikit-learn library.
Support vector machine learning.pptx

Support vector machine learning.pptx

  • 1.
    Support Vector Machine •Support Vector Machine (SVM) is a discriminative classifier which intakes training data (supervised learning), the algorithm outputs an optimal hyper plane which categorizes new examples. What could be drawn to classify the black dots from blue squares?
  • 2.
    Support Vector Machine •Linearly Separable Data A Line drawn between these data point classify the black dots and blue squares.
  • 3.
    Linearly Vs non– linearly Separable Data Linearly separable data Non Linearly separable data
  • 4.
    Non linearly SeparableData • What could be drawn to classify these data points (red dots from blue stars?
  • 5.
    Non linearly SeparableData • Here the hyperplane is a 2d plane drawn parallel to x-axis that is the separator.
  • 6.
    Non linear DataType (2) Raw Data Line as hyperplane
  • 7.
    For the previousdata the line , if used as a Hyperplane  Two black dots also fall in category of blue squares  Data separation is not perfect  It tolerates some outliers in the classification Non linear Data Type (2)
  • 8.
    • This typeof separator best provides the classification. But ● It is quite difficult to train a model like this . ● This is termed as Regularization parameter. Best Approach
  • 9.
     Kernel  Regularization Gamma  Margin Tuning Parameters Parameter That can help to solve the difficulties in separating data.
  • 10.
    Margin  Margin isthe perpendicular distance between the closest data points and the Hyperplane ( on both sides )  The best optimised line ( hyperplane ) with maximum margin is termed as Margin Maximal Hyperplane.  The closest points where the margin distance is calculated are considered as the support vectors.
  • 11.
  • 12.
    Regularization Also the ‘C ‘ parameter in Python’s SkLearn Library ● Optimises SVM classifier to avoid misclassifying the data. ● C → large Margin of hyperplane → small ● C → small Margin of hyperplane → large ● misclassification(possible) 1. C ---> large , chance of overfit 2. 2. C ---> small , chance of underfitting
  • 13.
  • 14.
    Gamma Defines how farinfluences the calculation of of plausible line of separation. ● Low gamma -----> points far from plausible line are considered for calculation ● High gamma -----> points close to plausible line are considered for calculation
  • 15.
  • 16.
    Kernel Mathematical functions fortransforming data ● using some linear algebra ● Different SVM algorithms use different types of kernel functions
  • 17.
    Various Kernel • 1.Linear kernel • 2. Non - linear kernel • 3. Radial basis function ( RBF ) • 4. Sigmoid • 5. Polynomial • 6. Exponential
  • 18.
    Various Kernel Example : K(x,y) = <f(x).f(y)> Kernel function dot product of n- dimensional inputs
  • 19.
  • 20.
  • 21.
    Cons ● It doesn’tperform well, when we have large data set because the required training time is higher ● It also doesn’t perform very well, when the data set has more noise i.e. target classes are overlapping ● SVM doesn’t directly provide probability estimates, these are calculated using an expensive five-fold cross-validation. It is related SVC method of Python scikit-learn library.