Downloaded 3,611 times


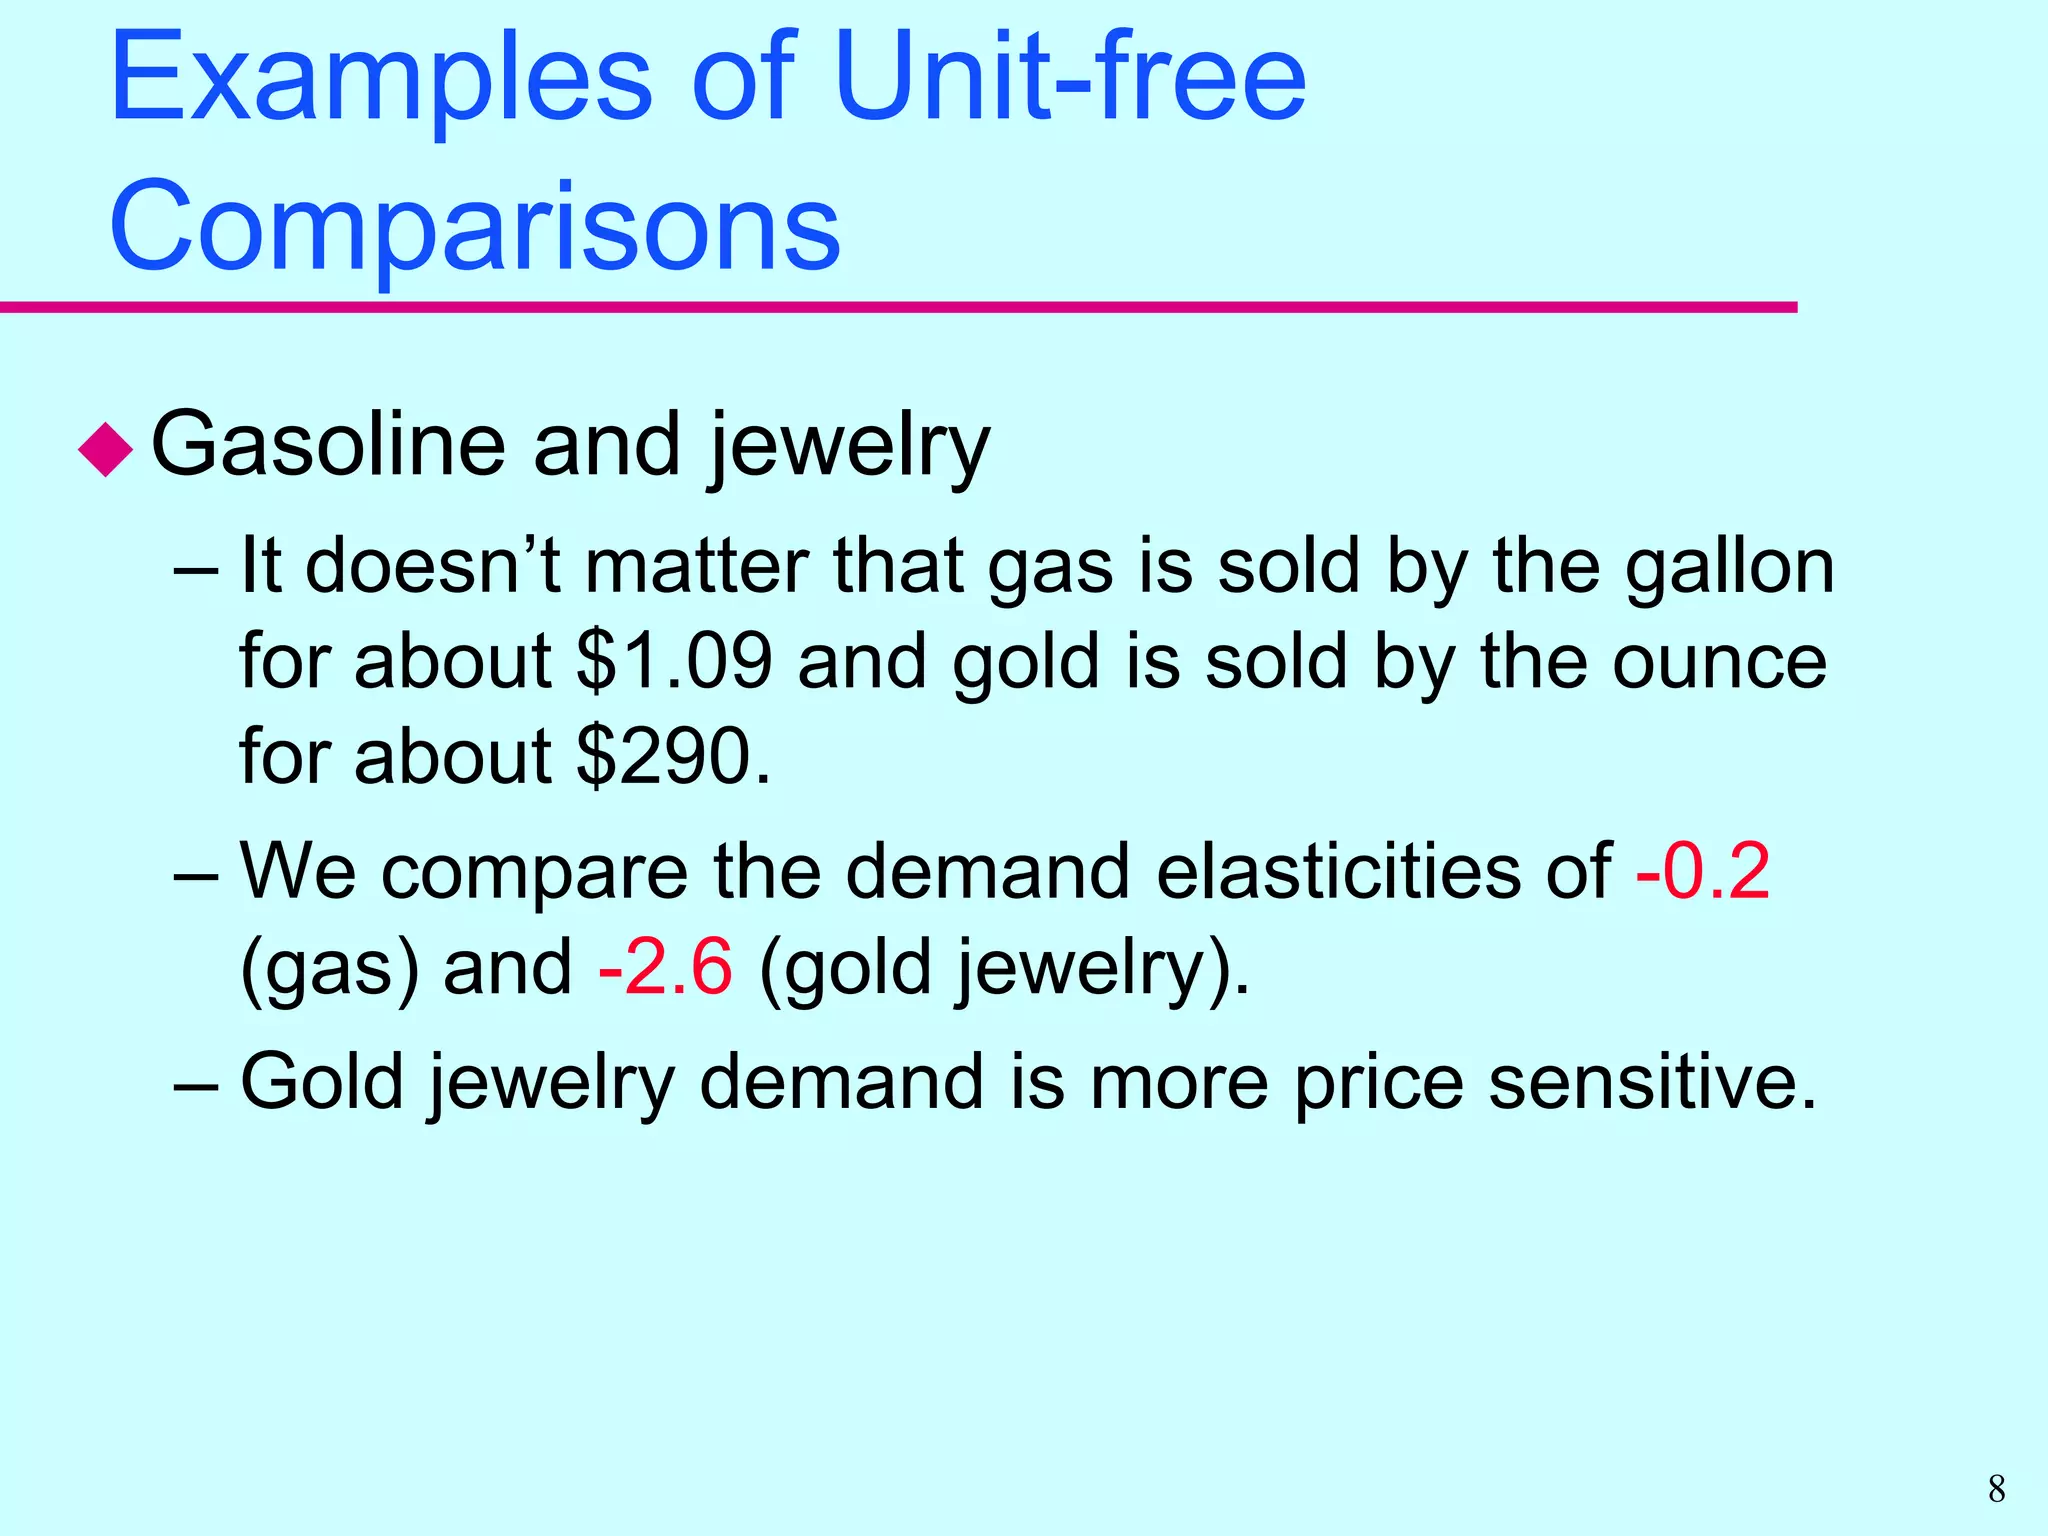

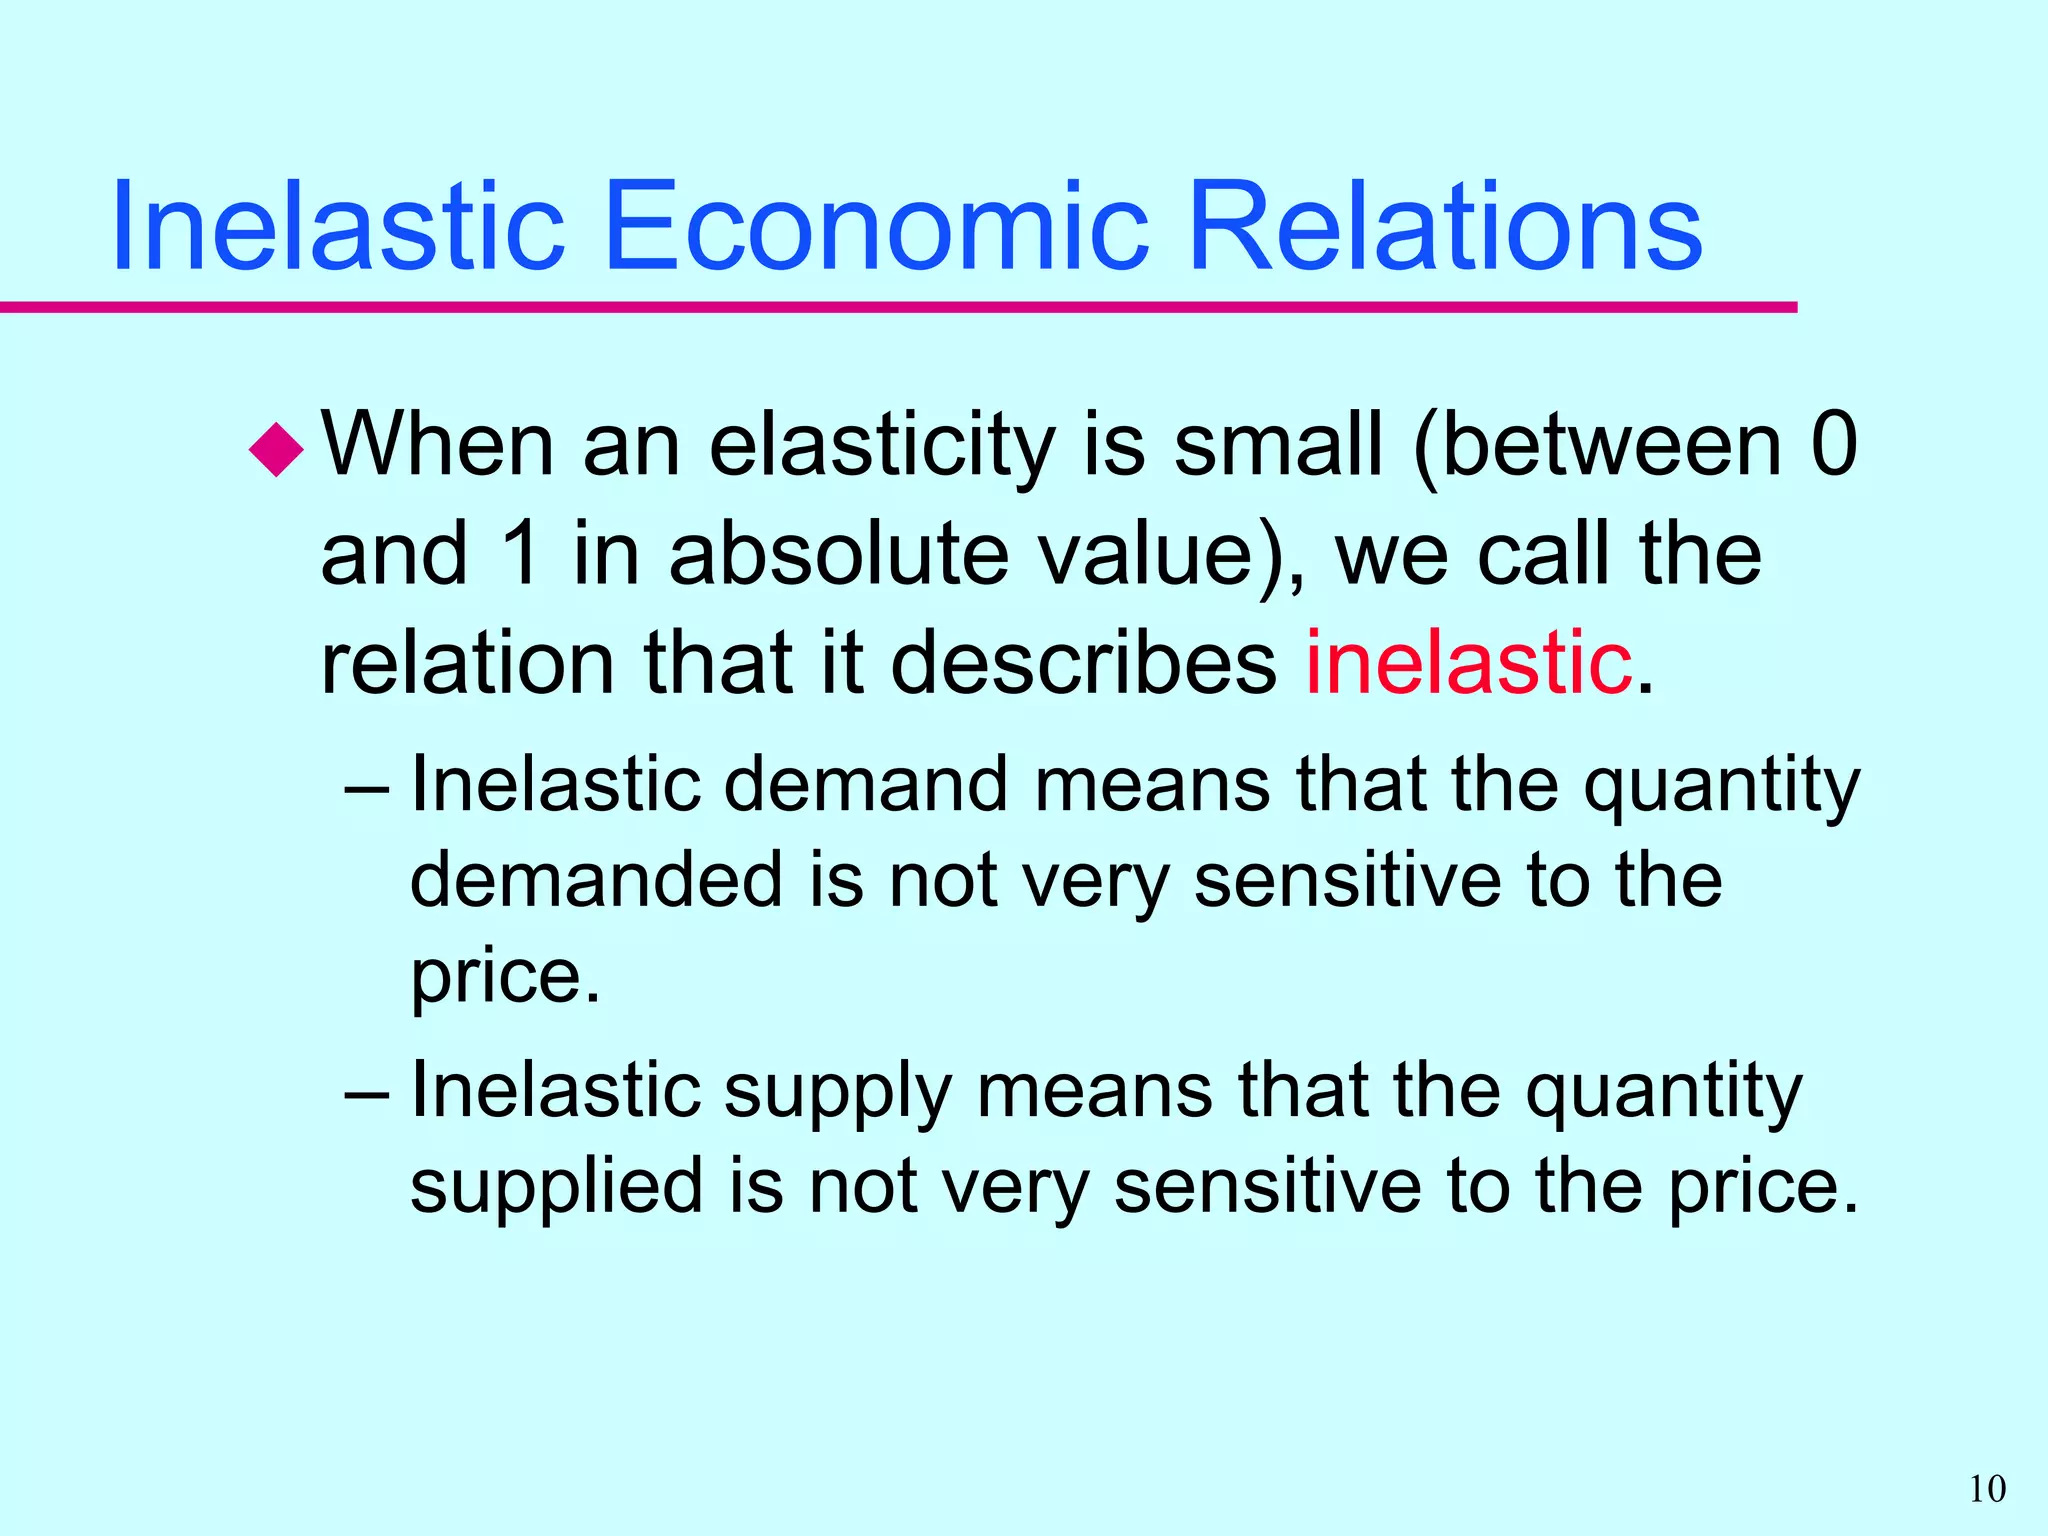
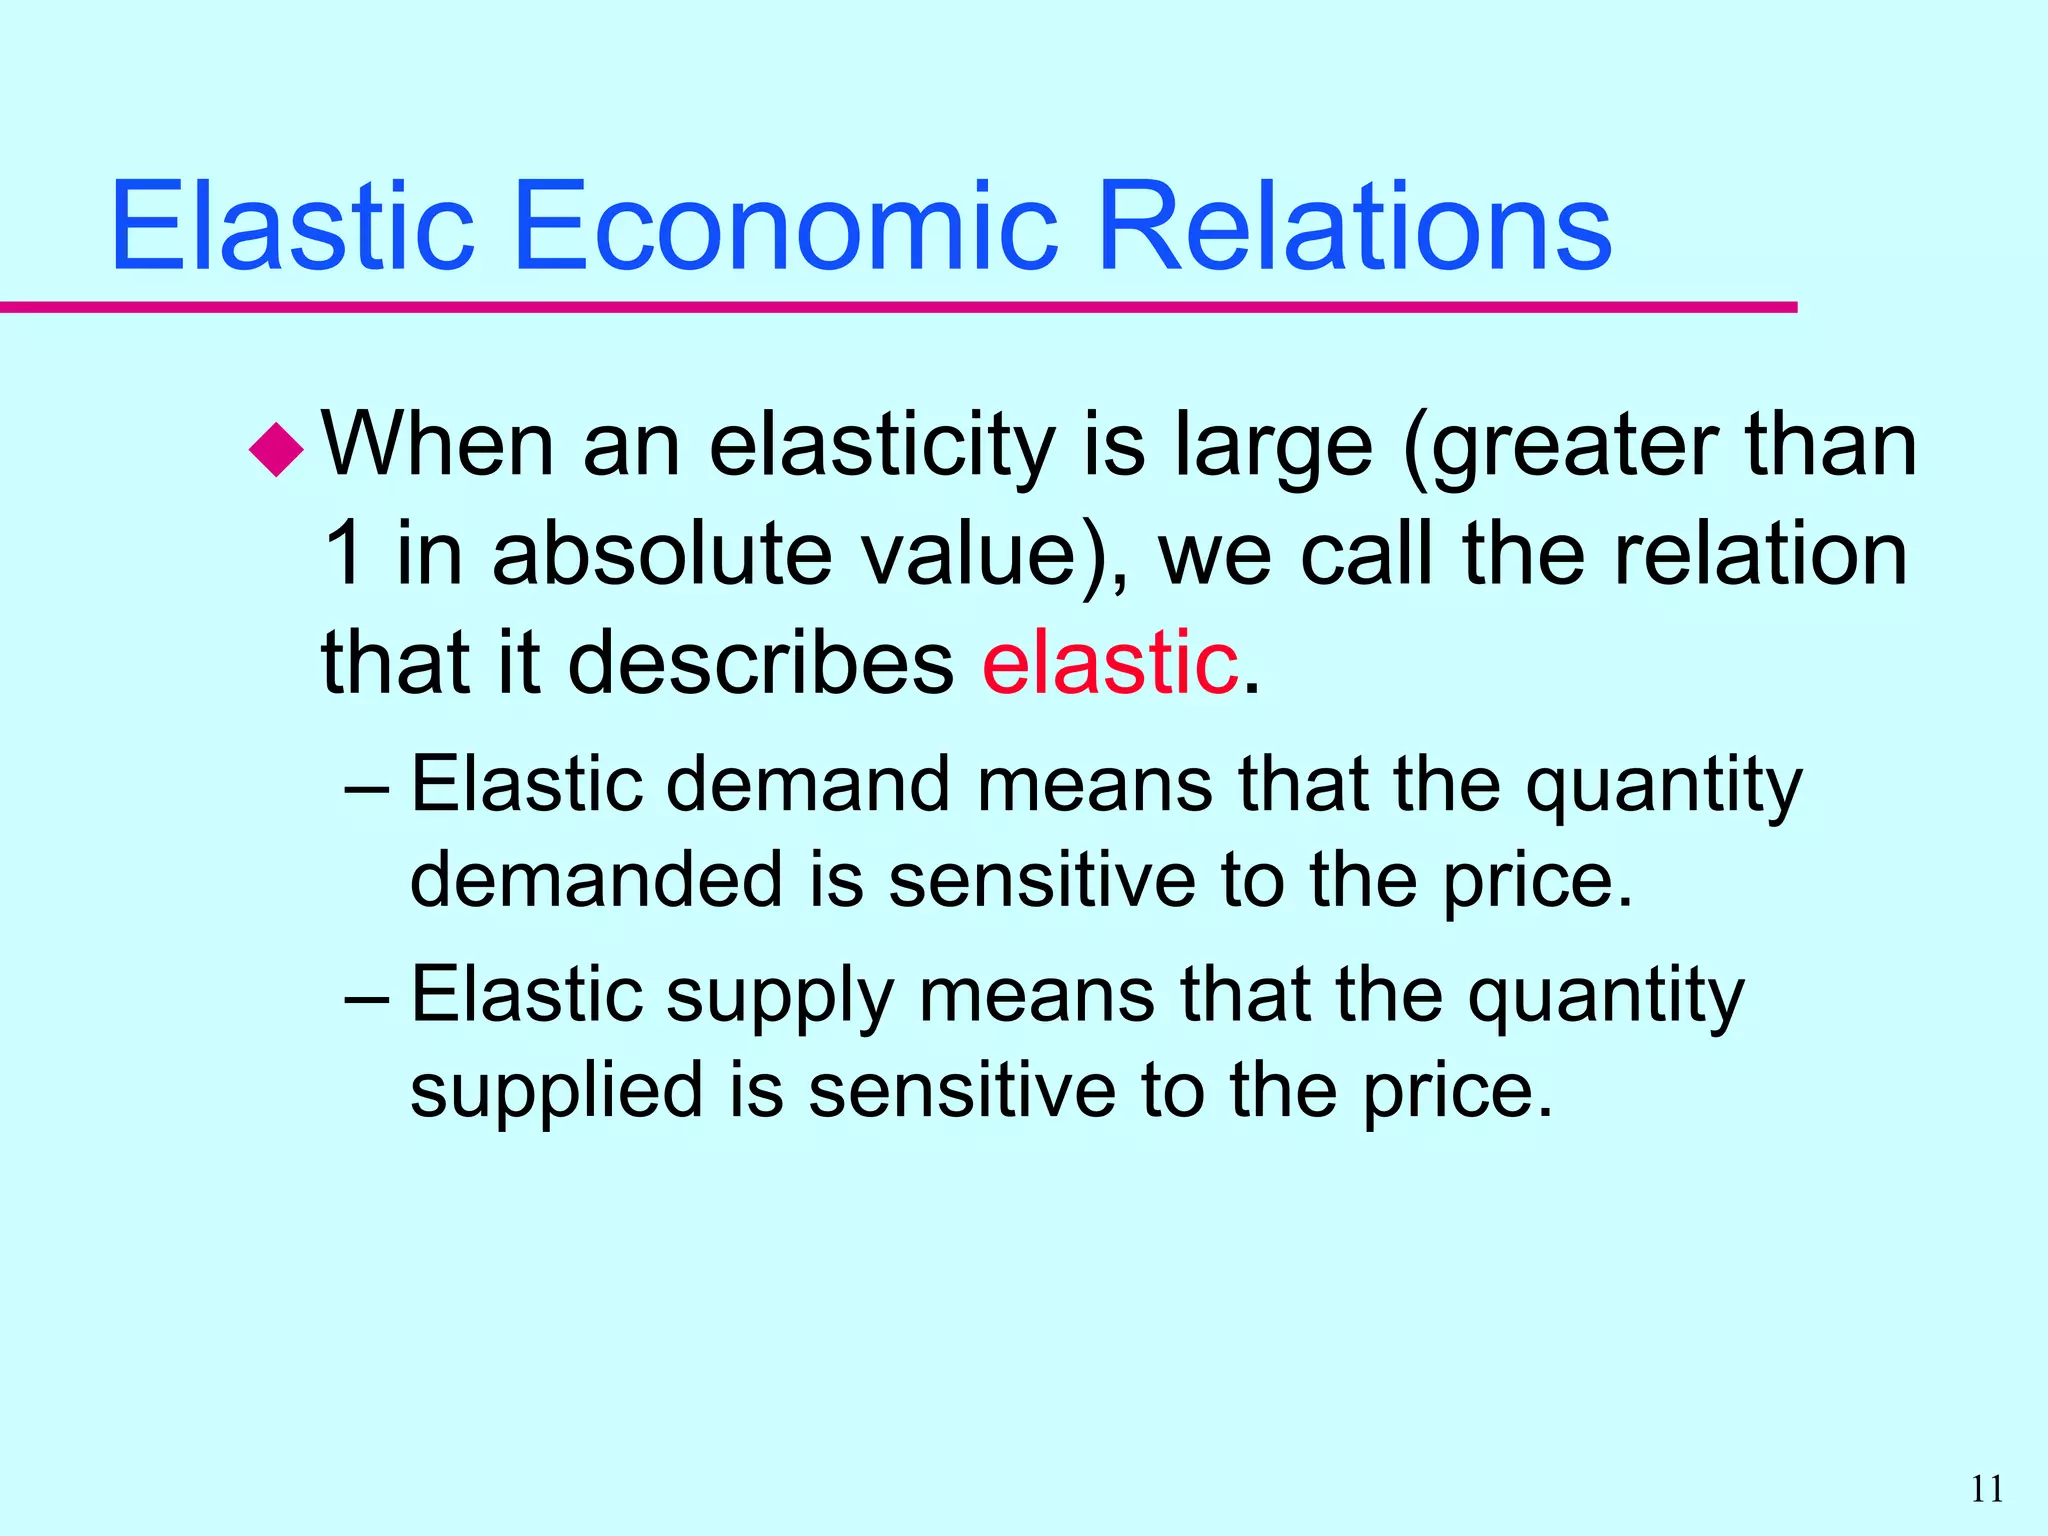
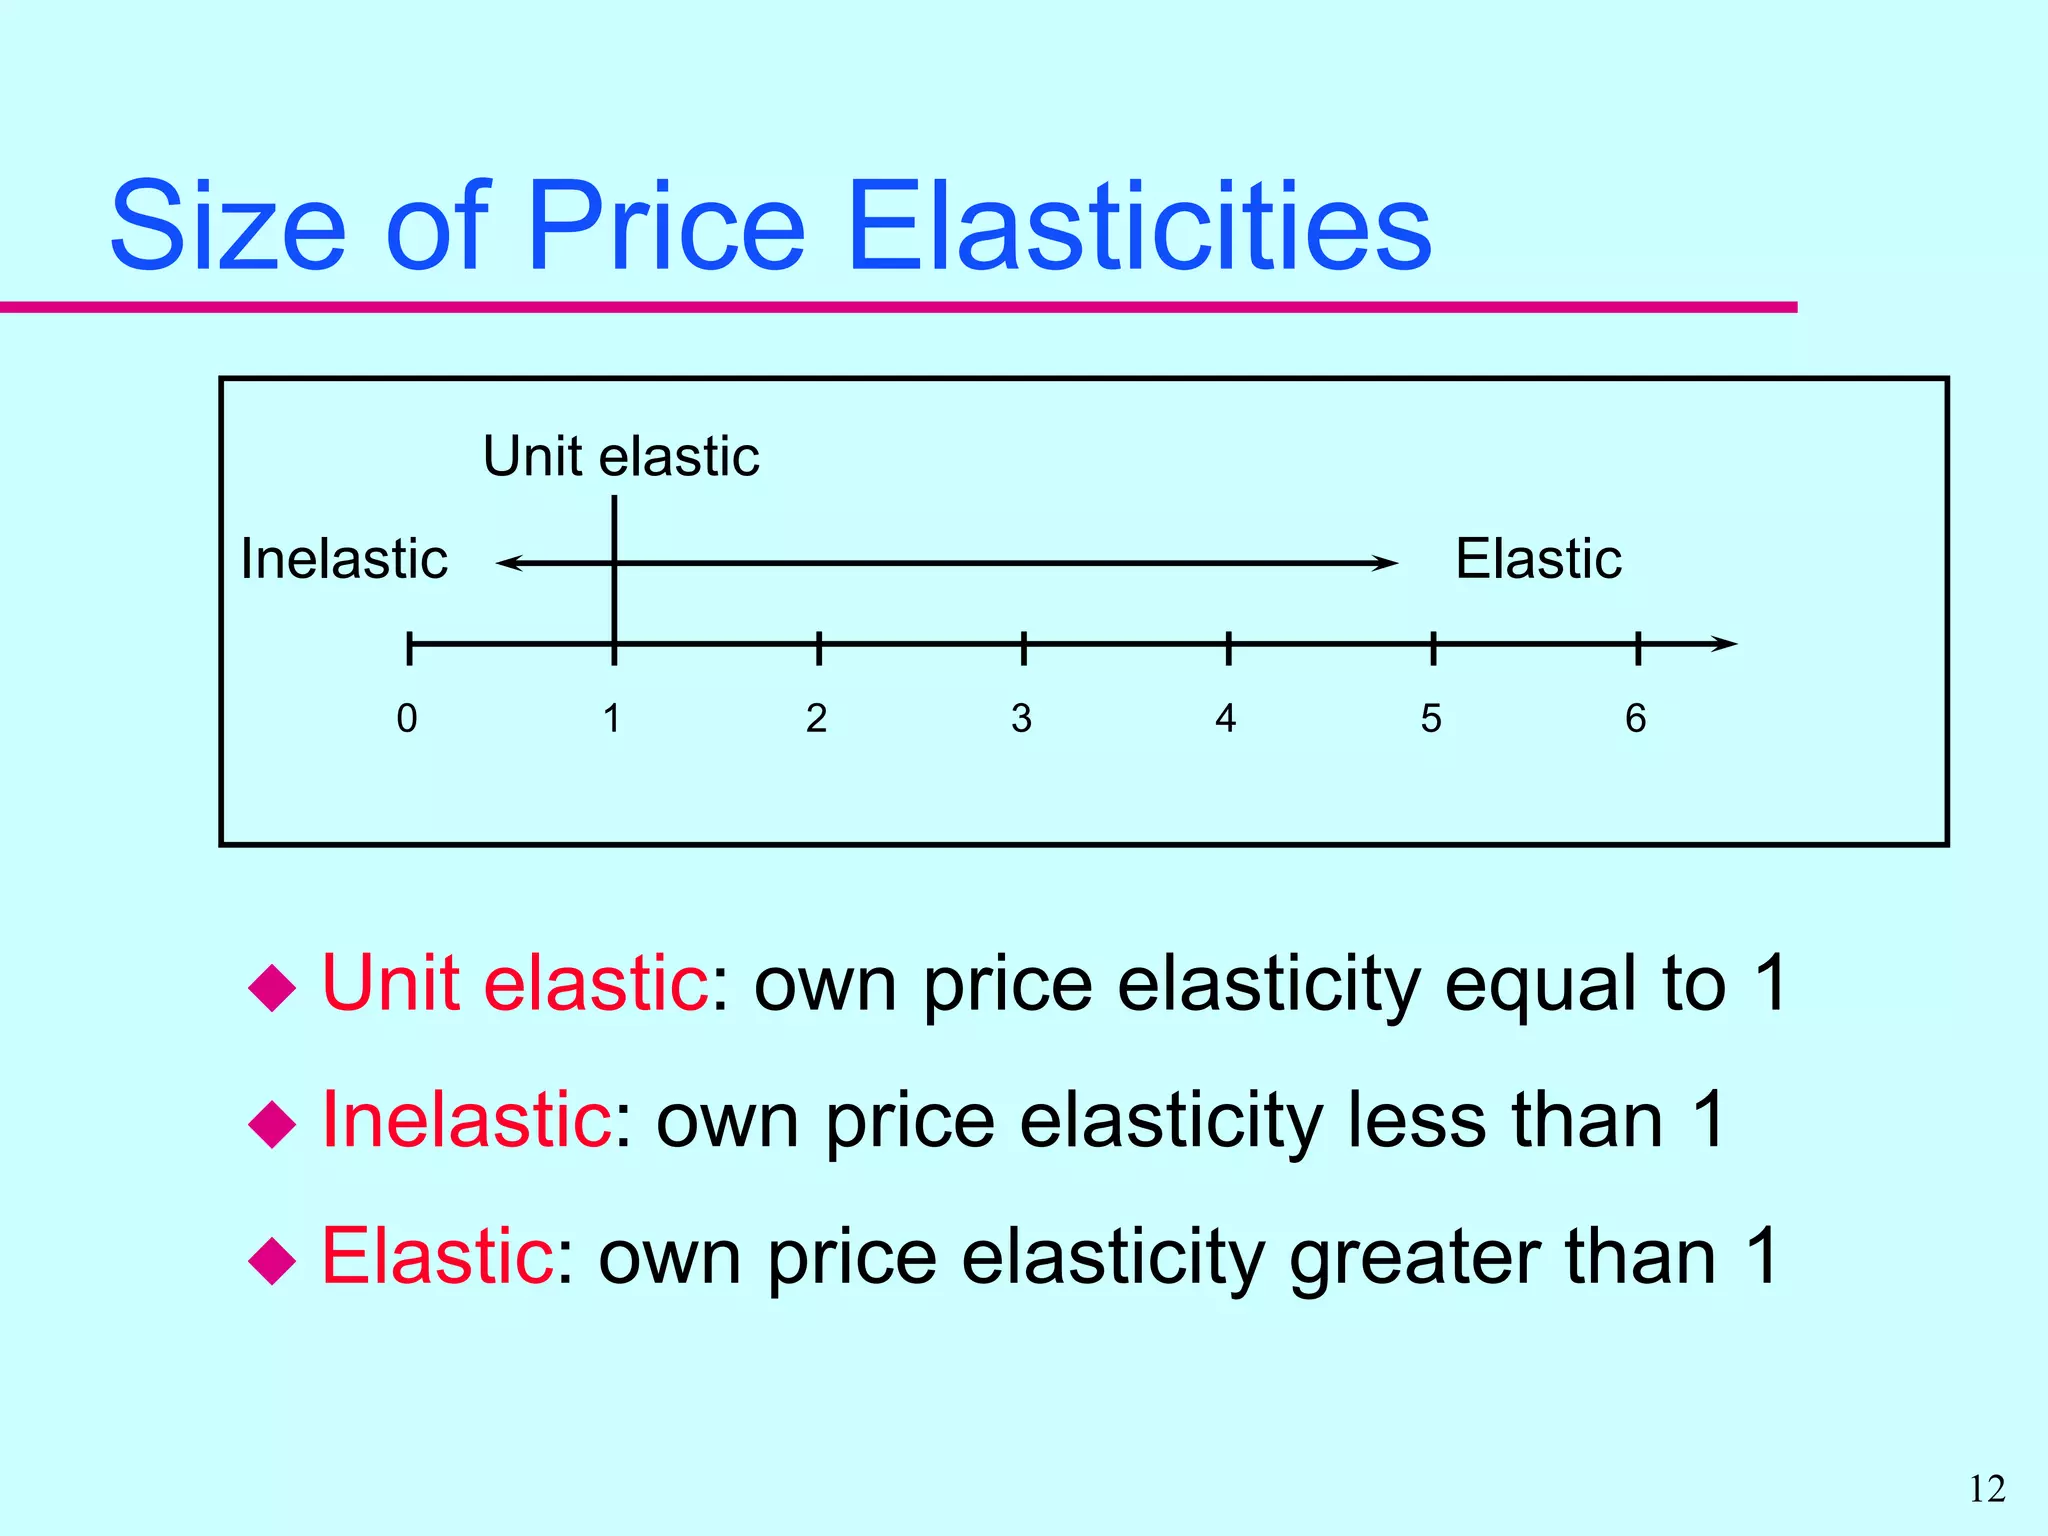
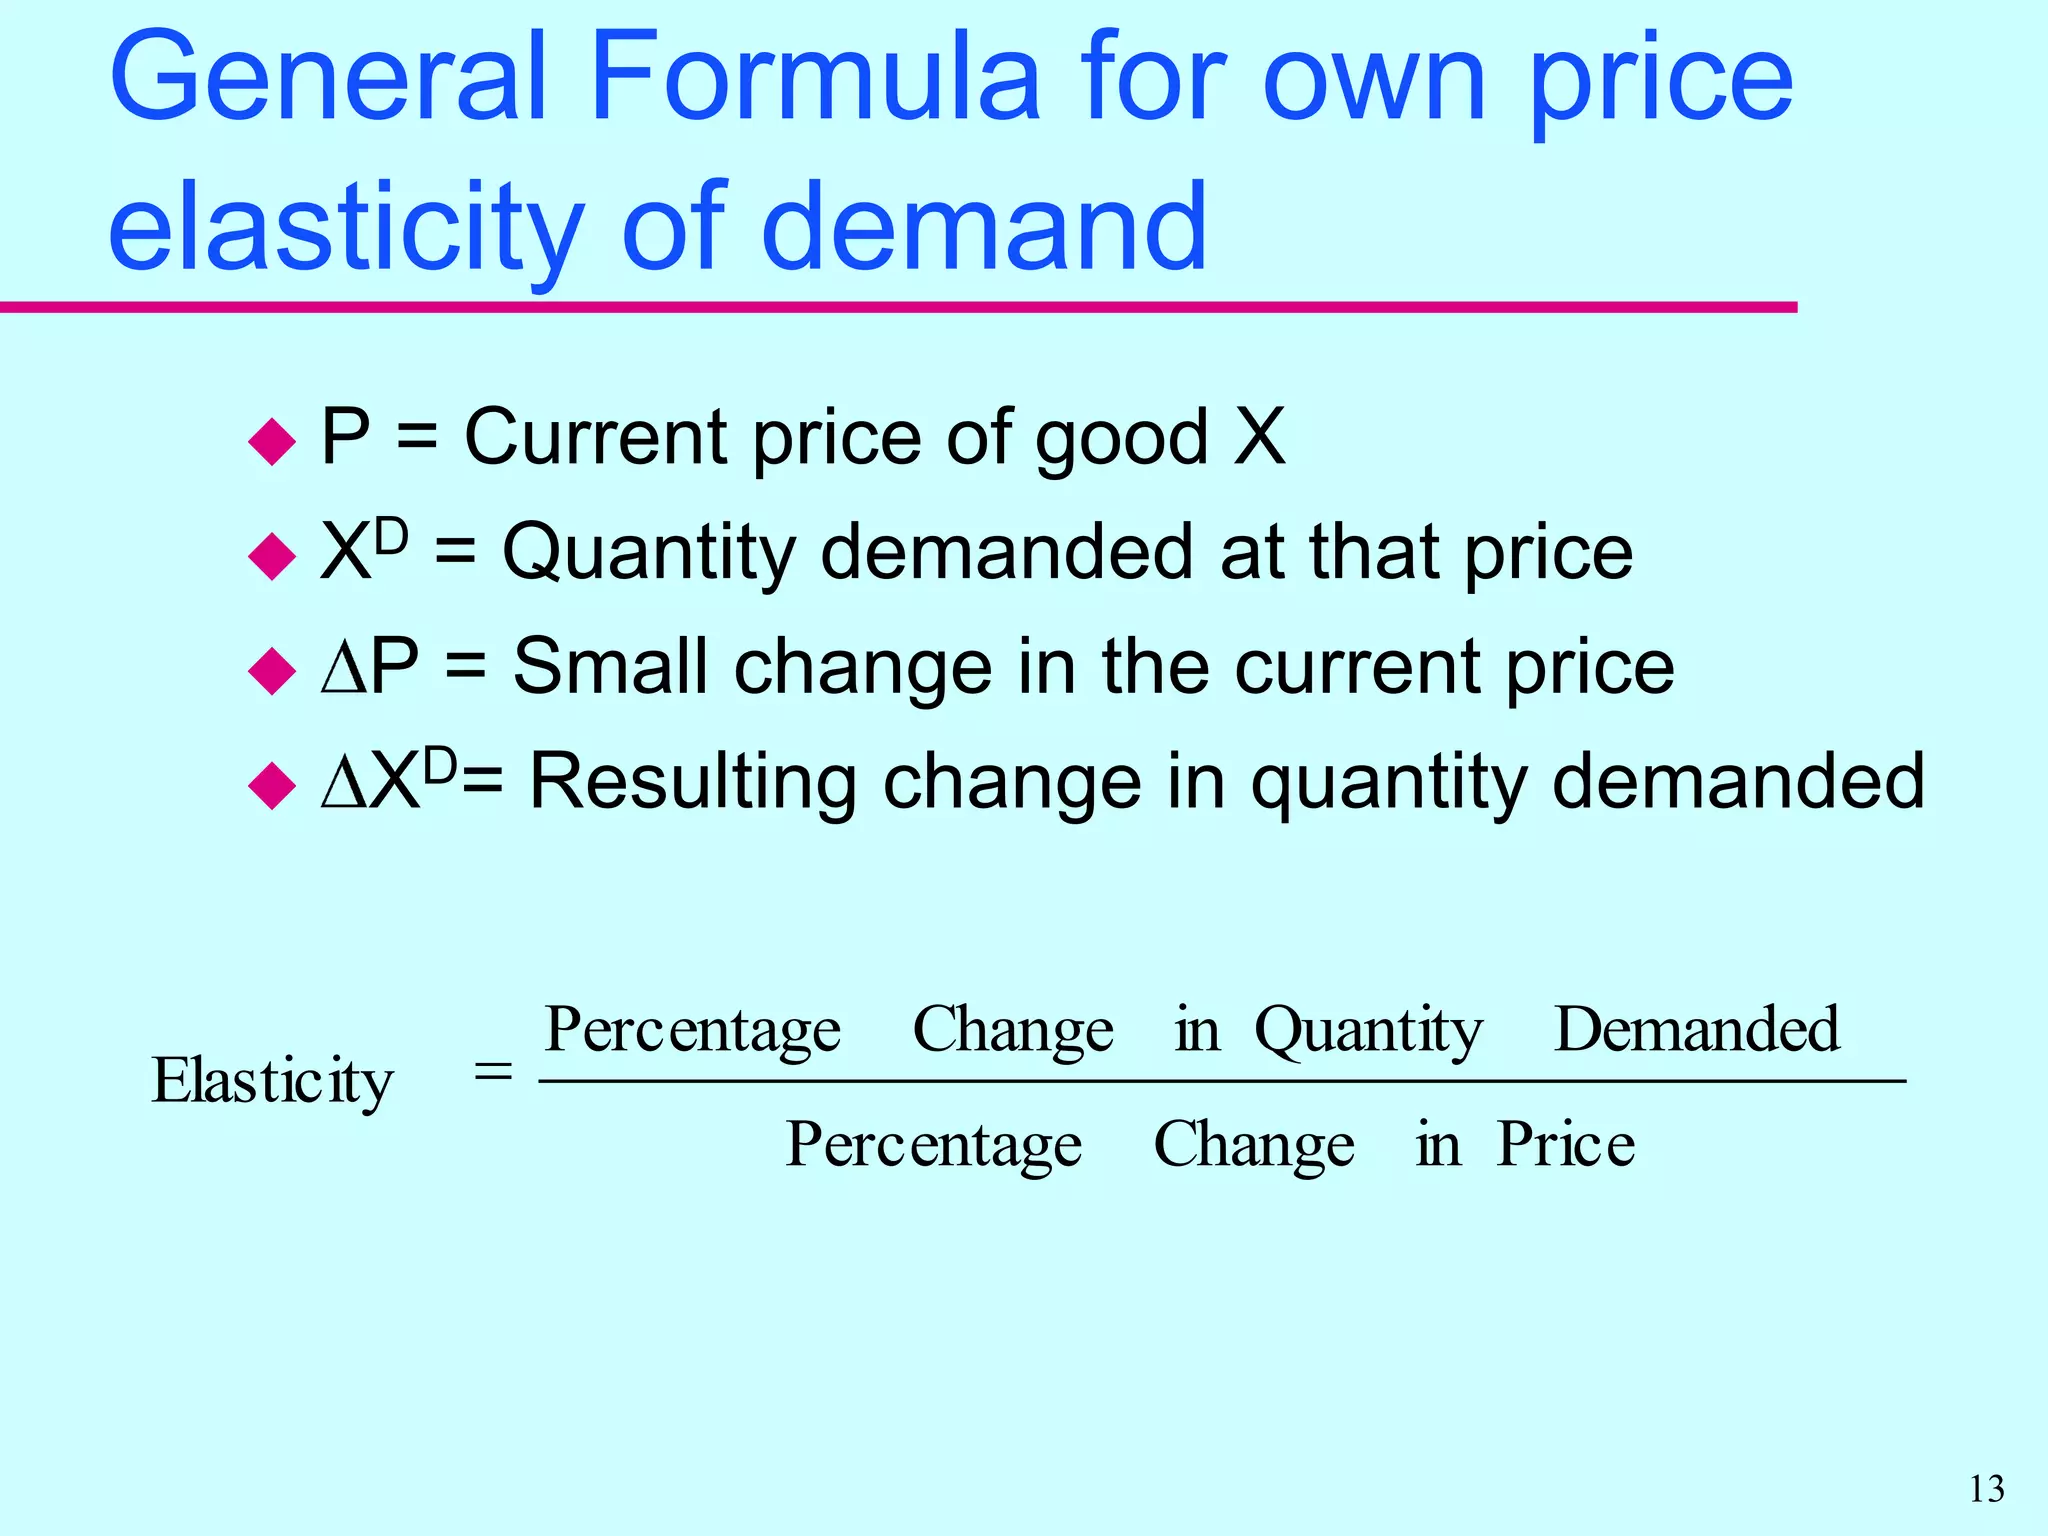
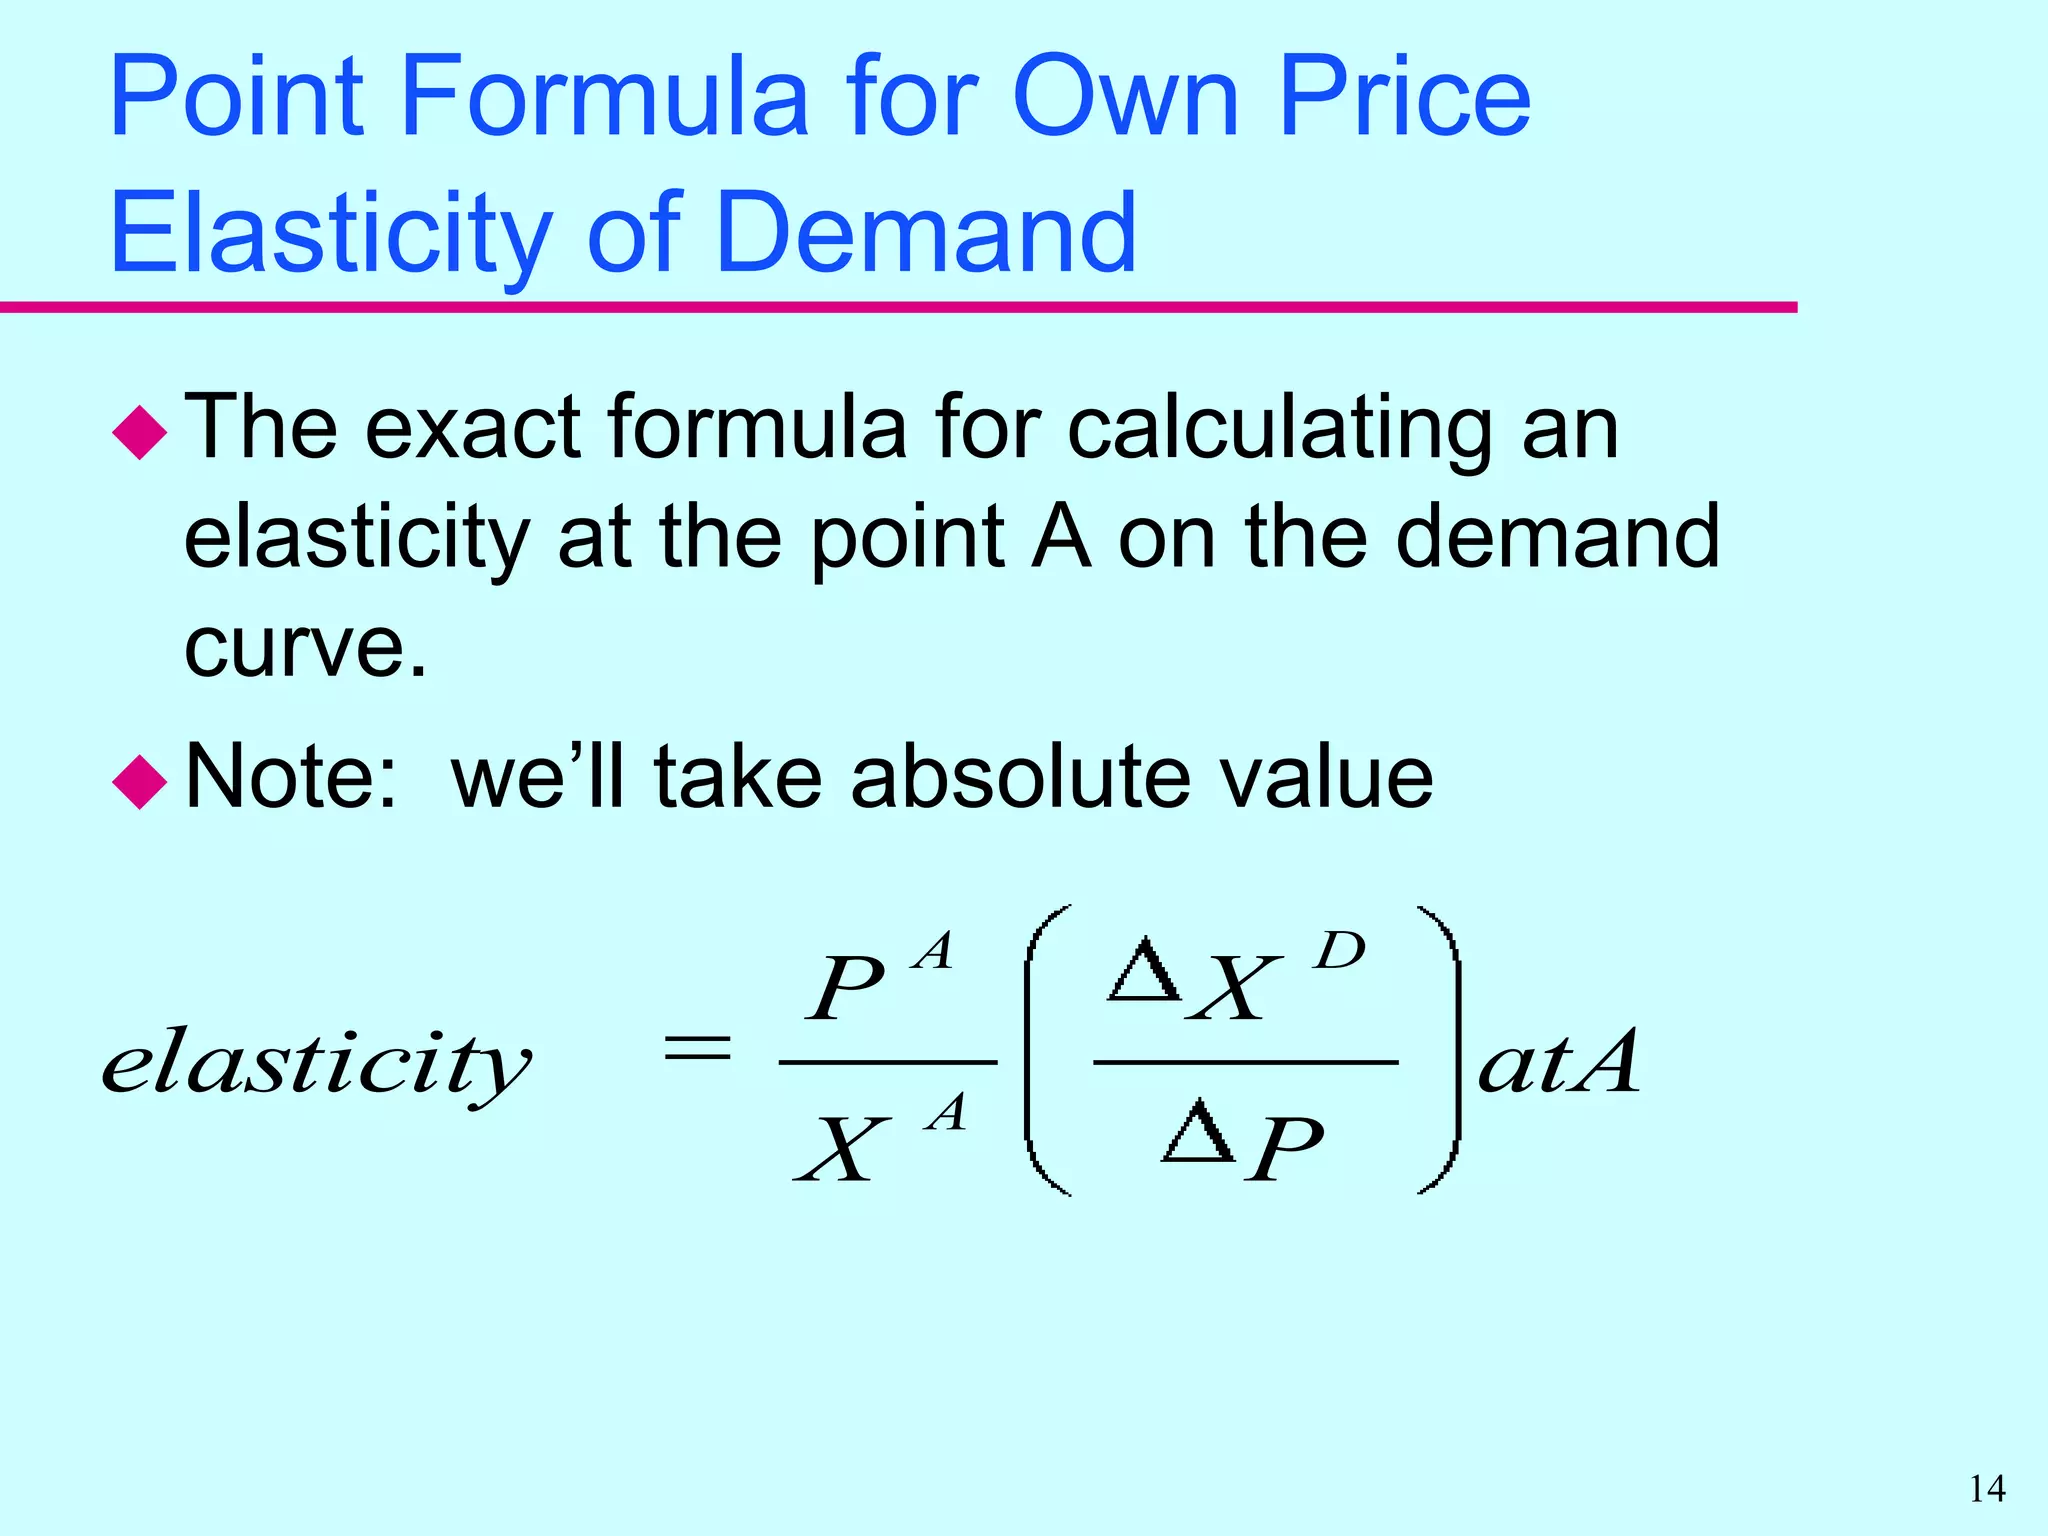
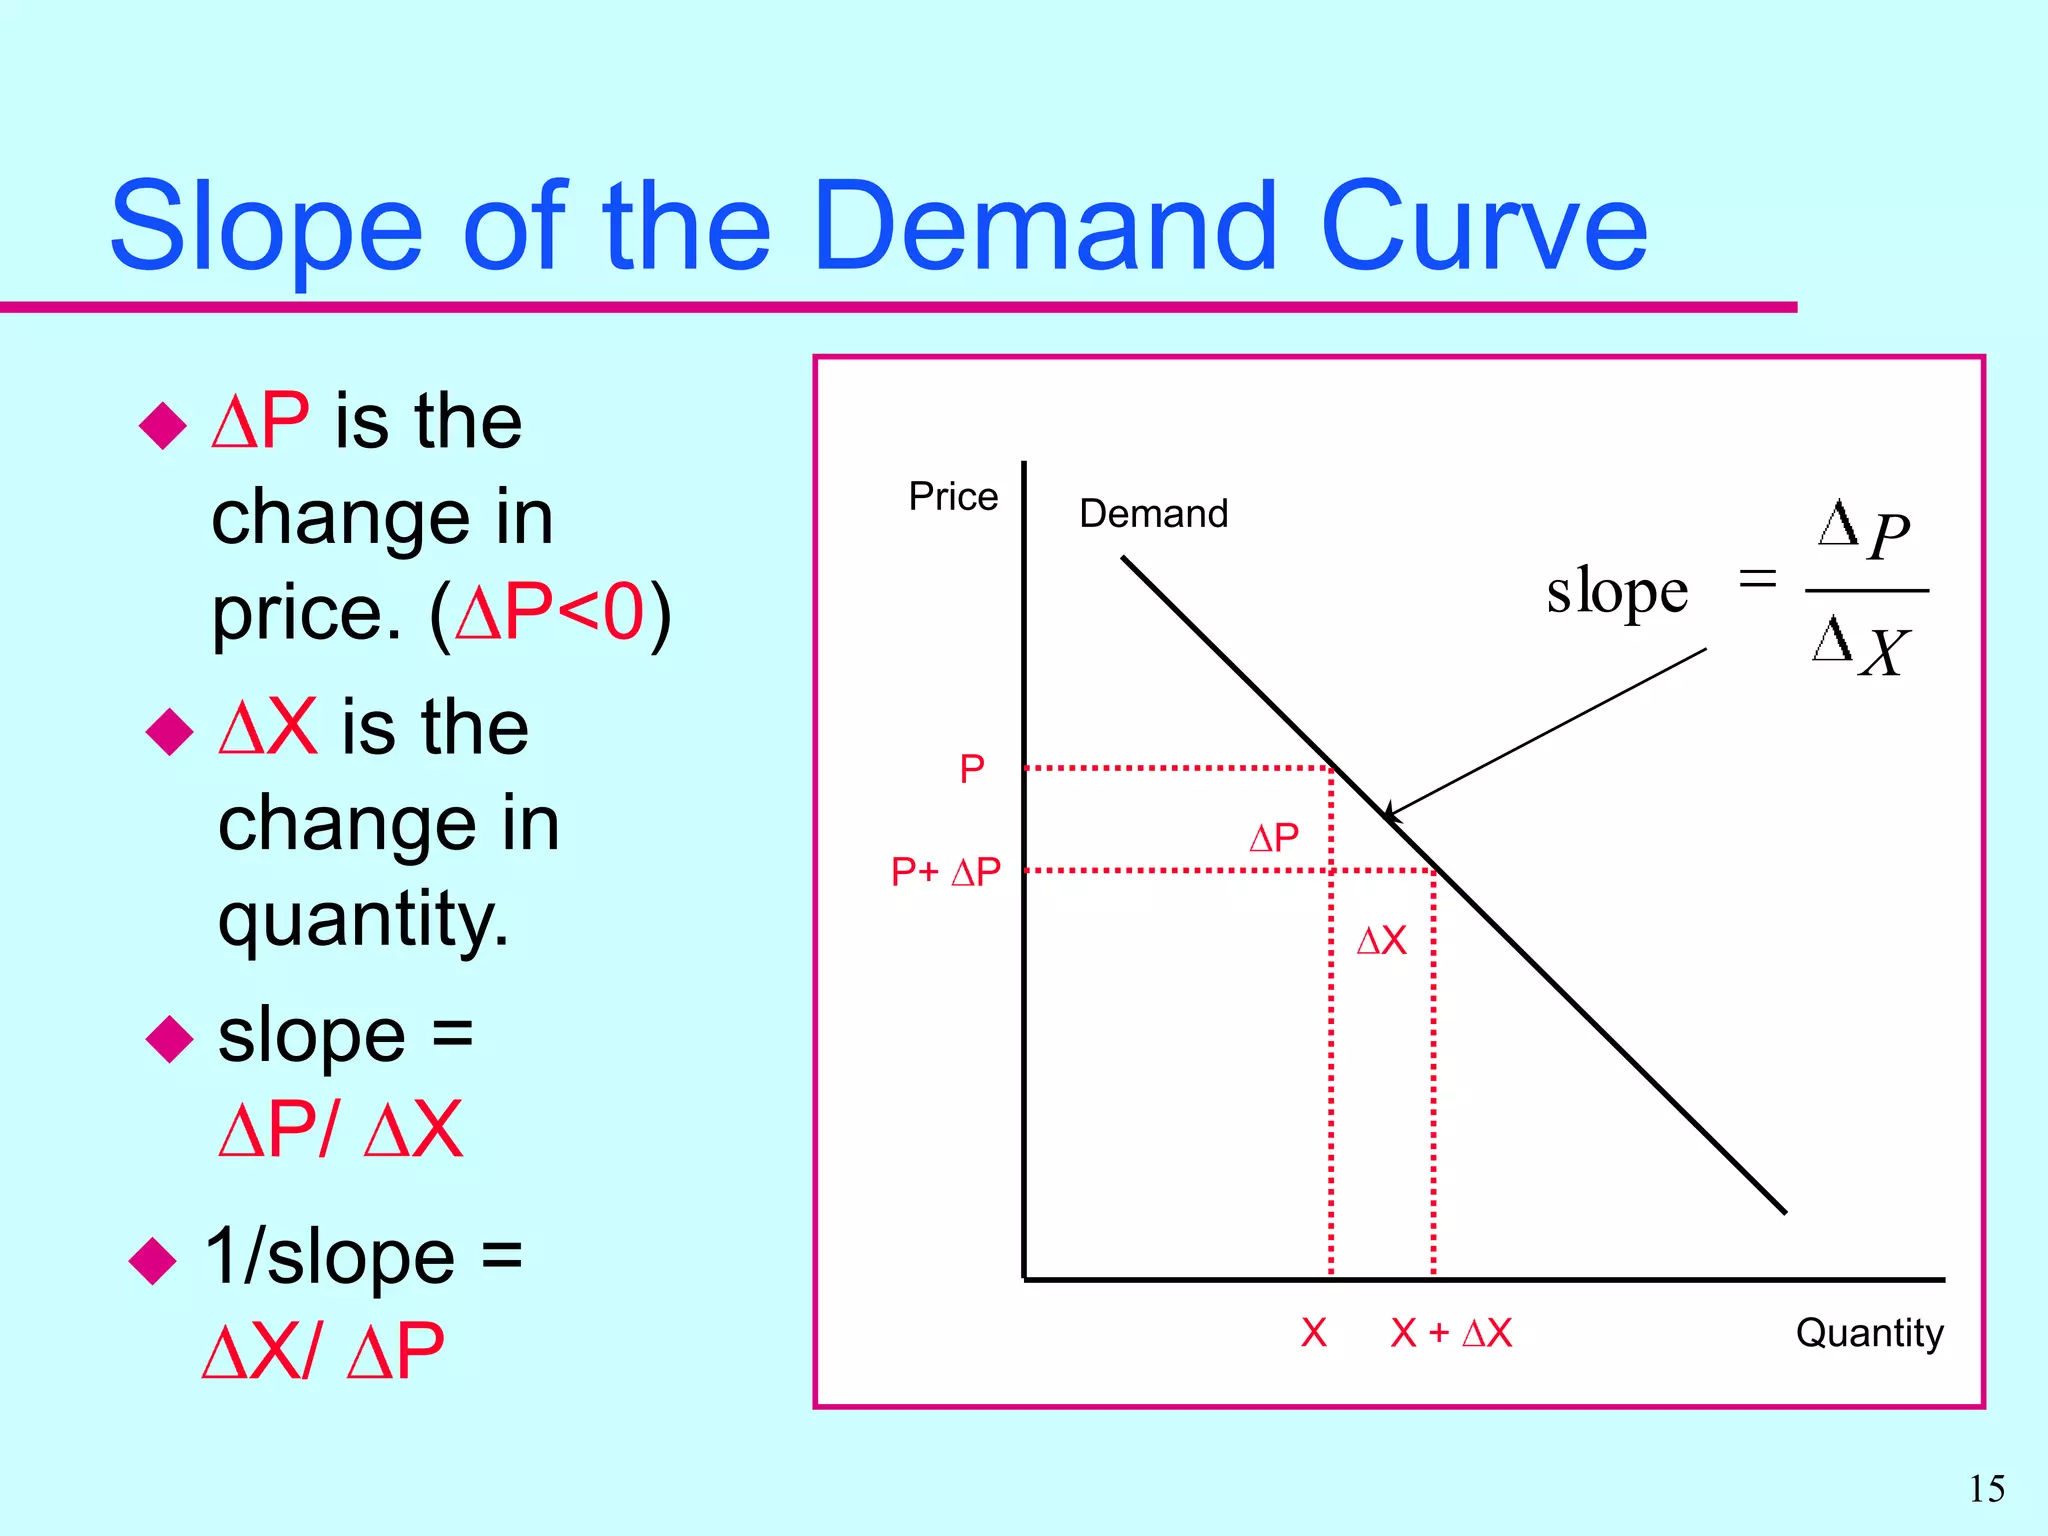
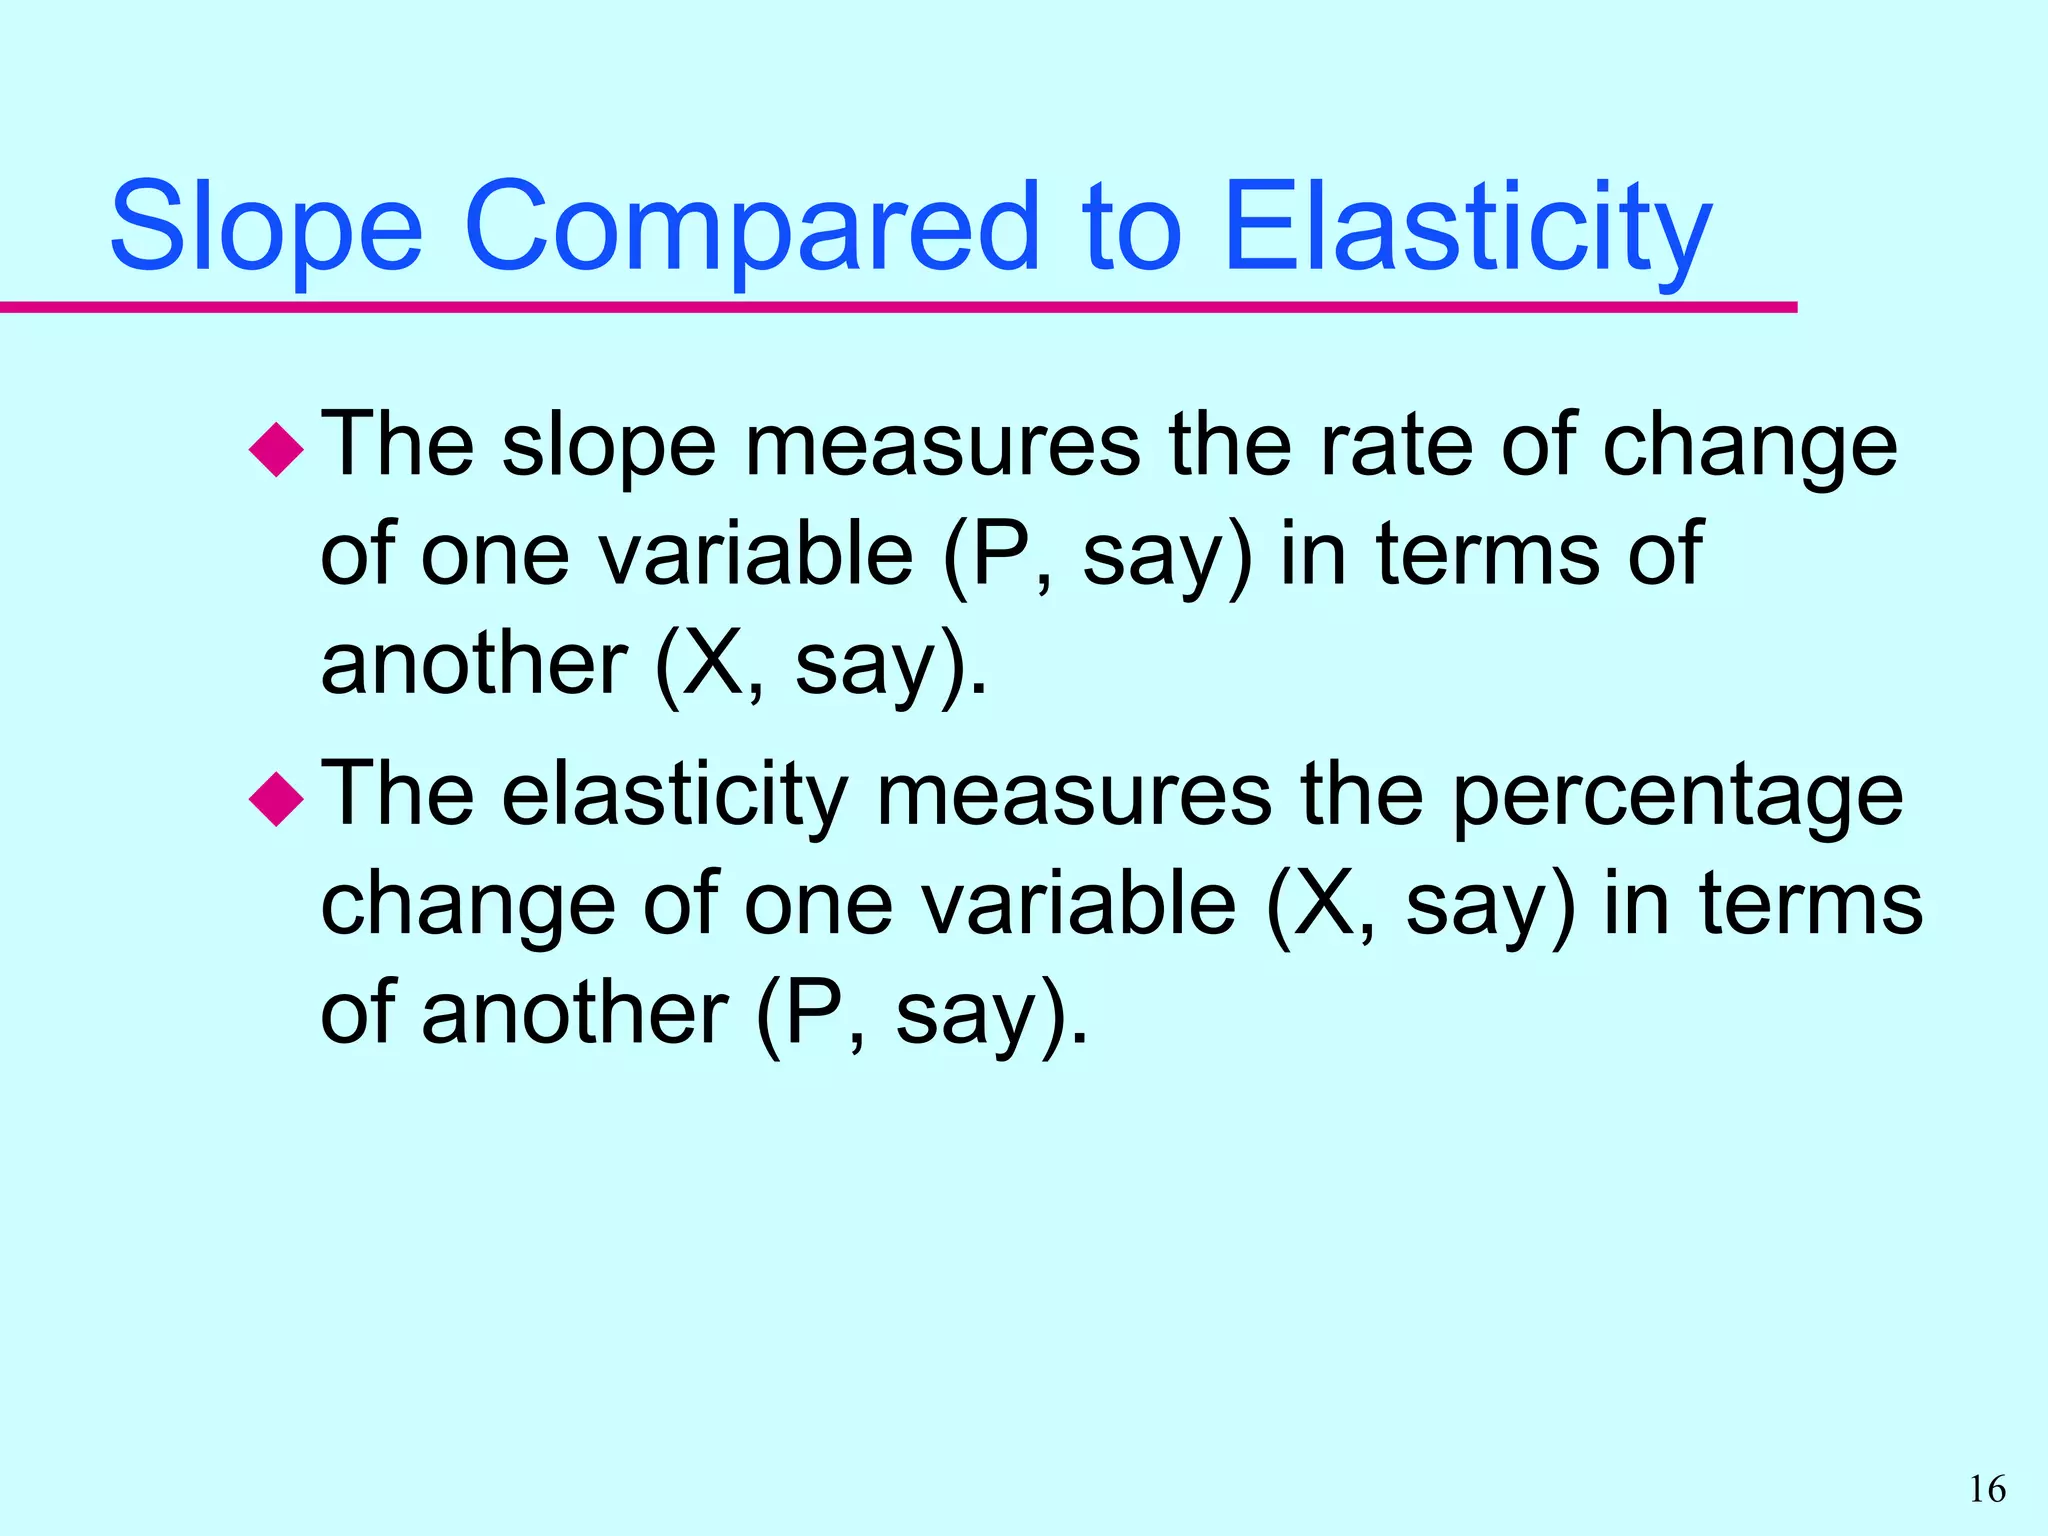
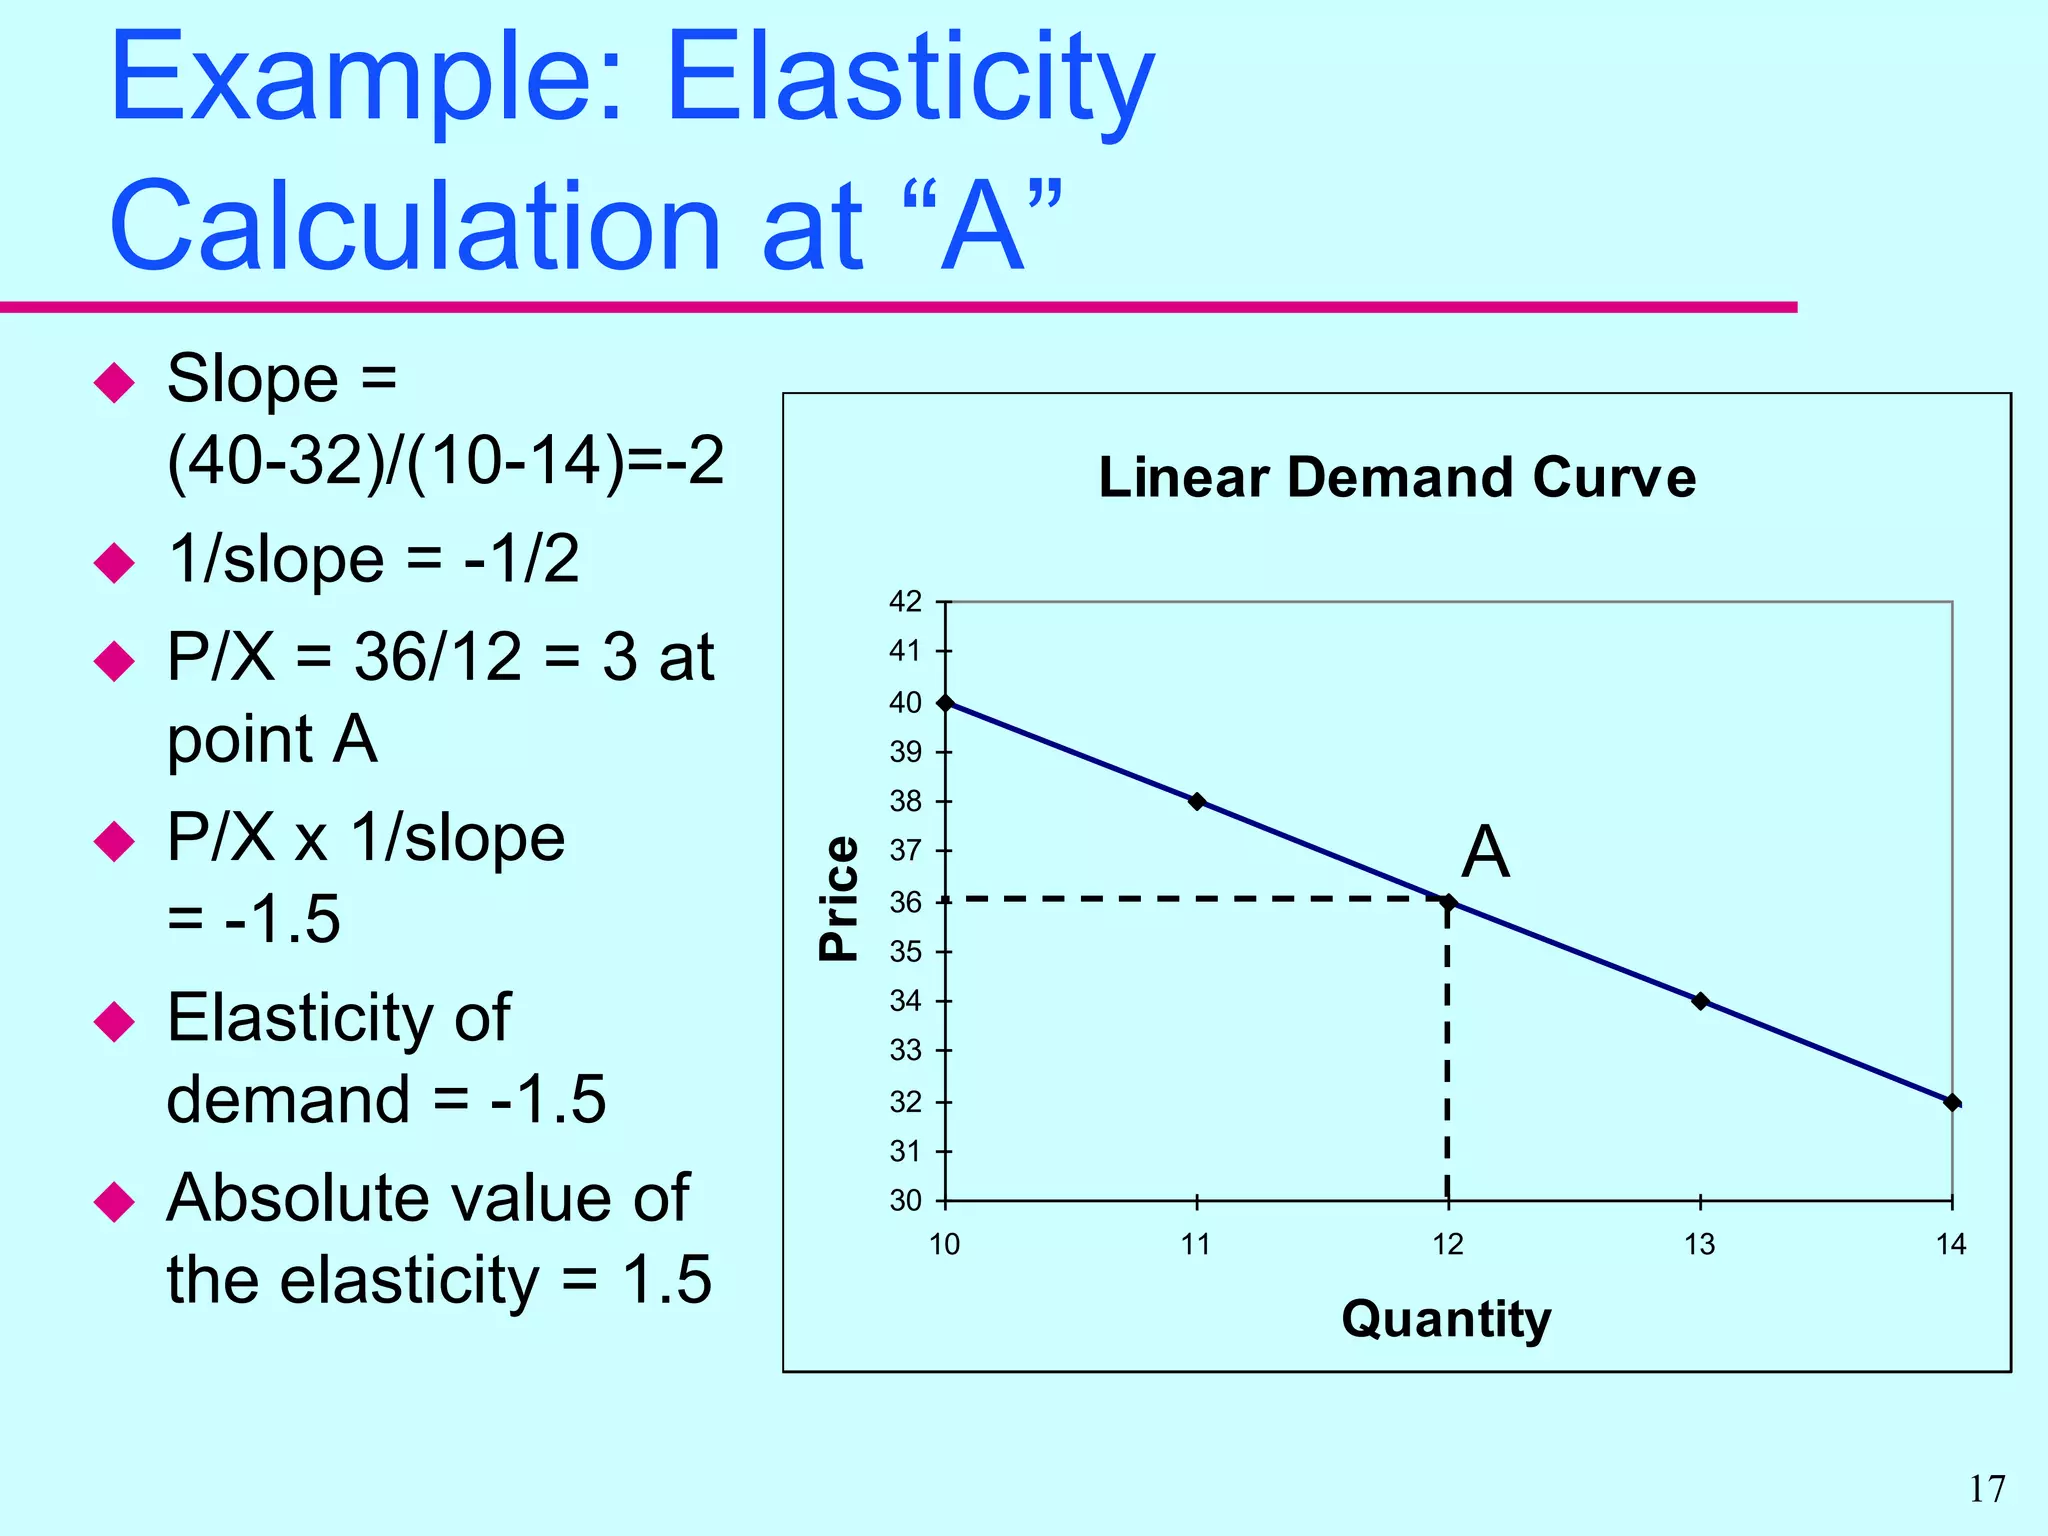


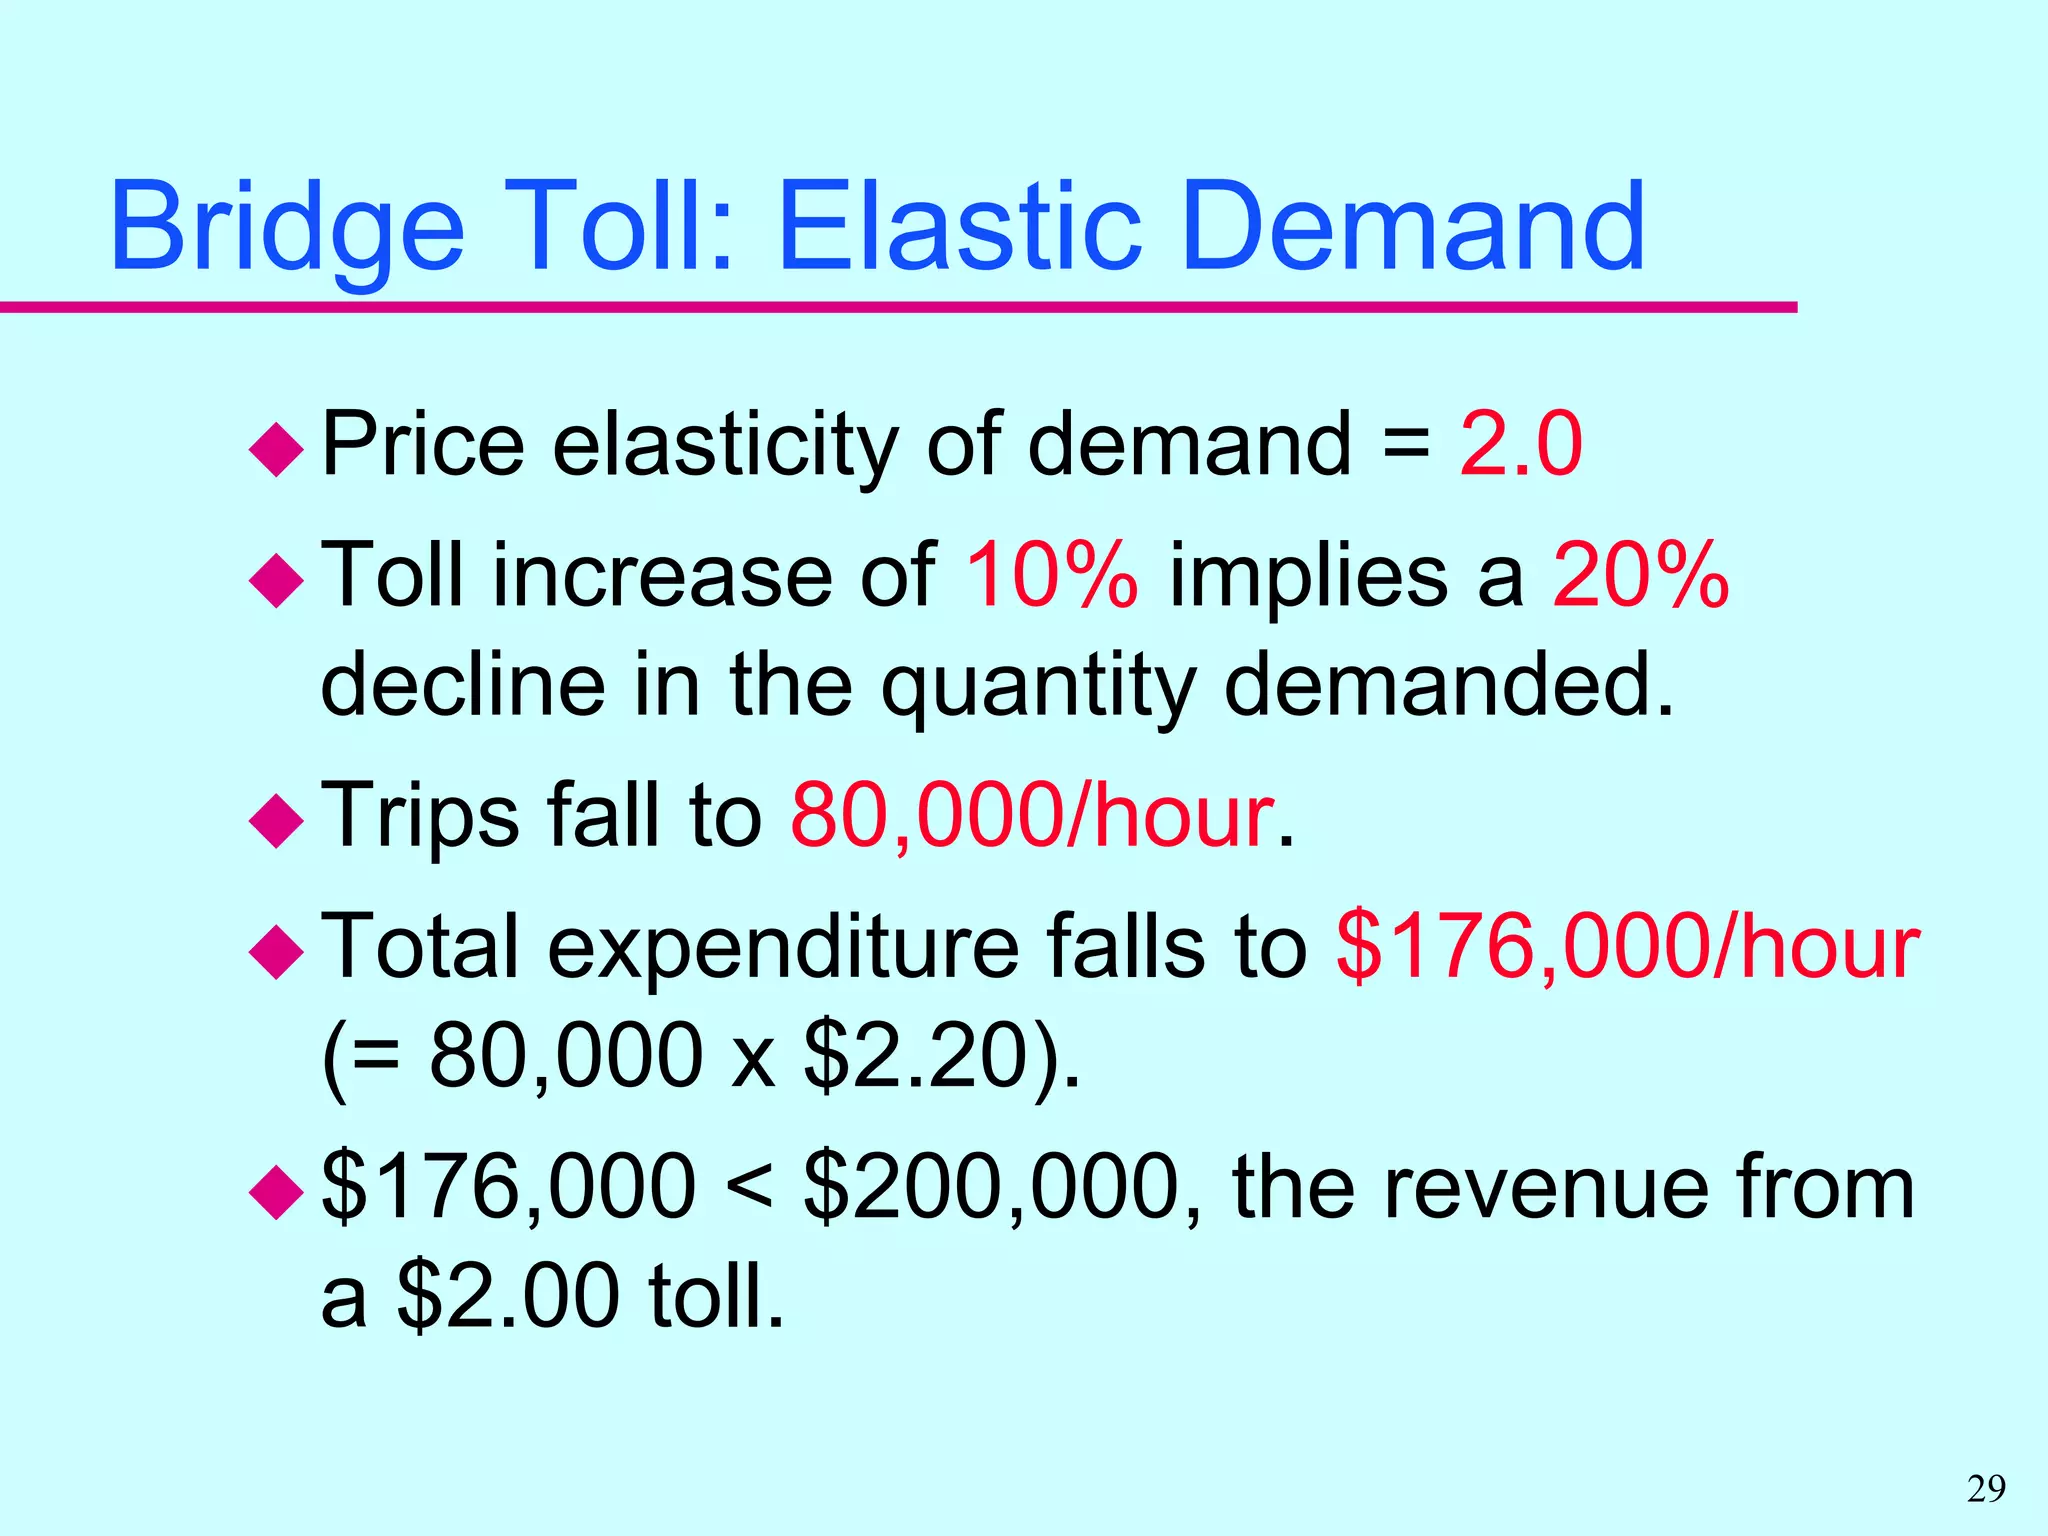

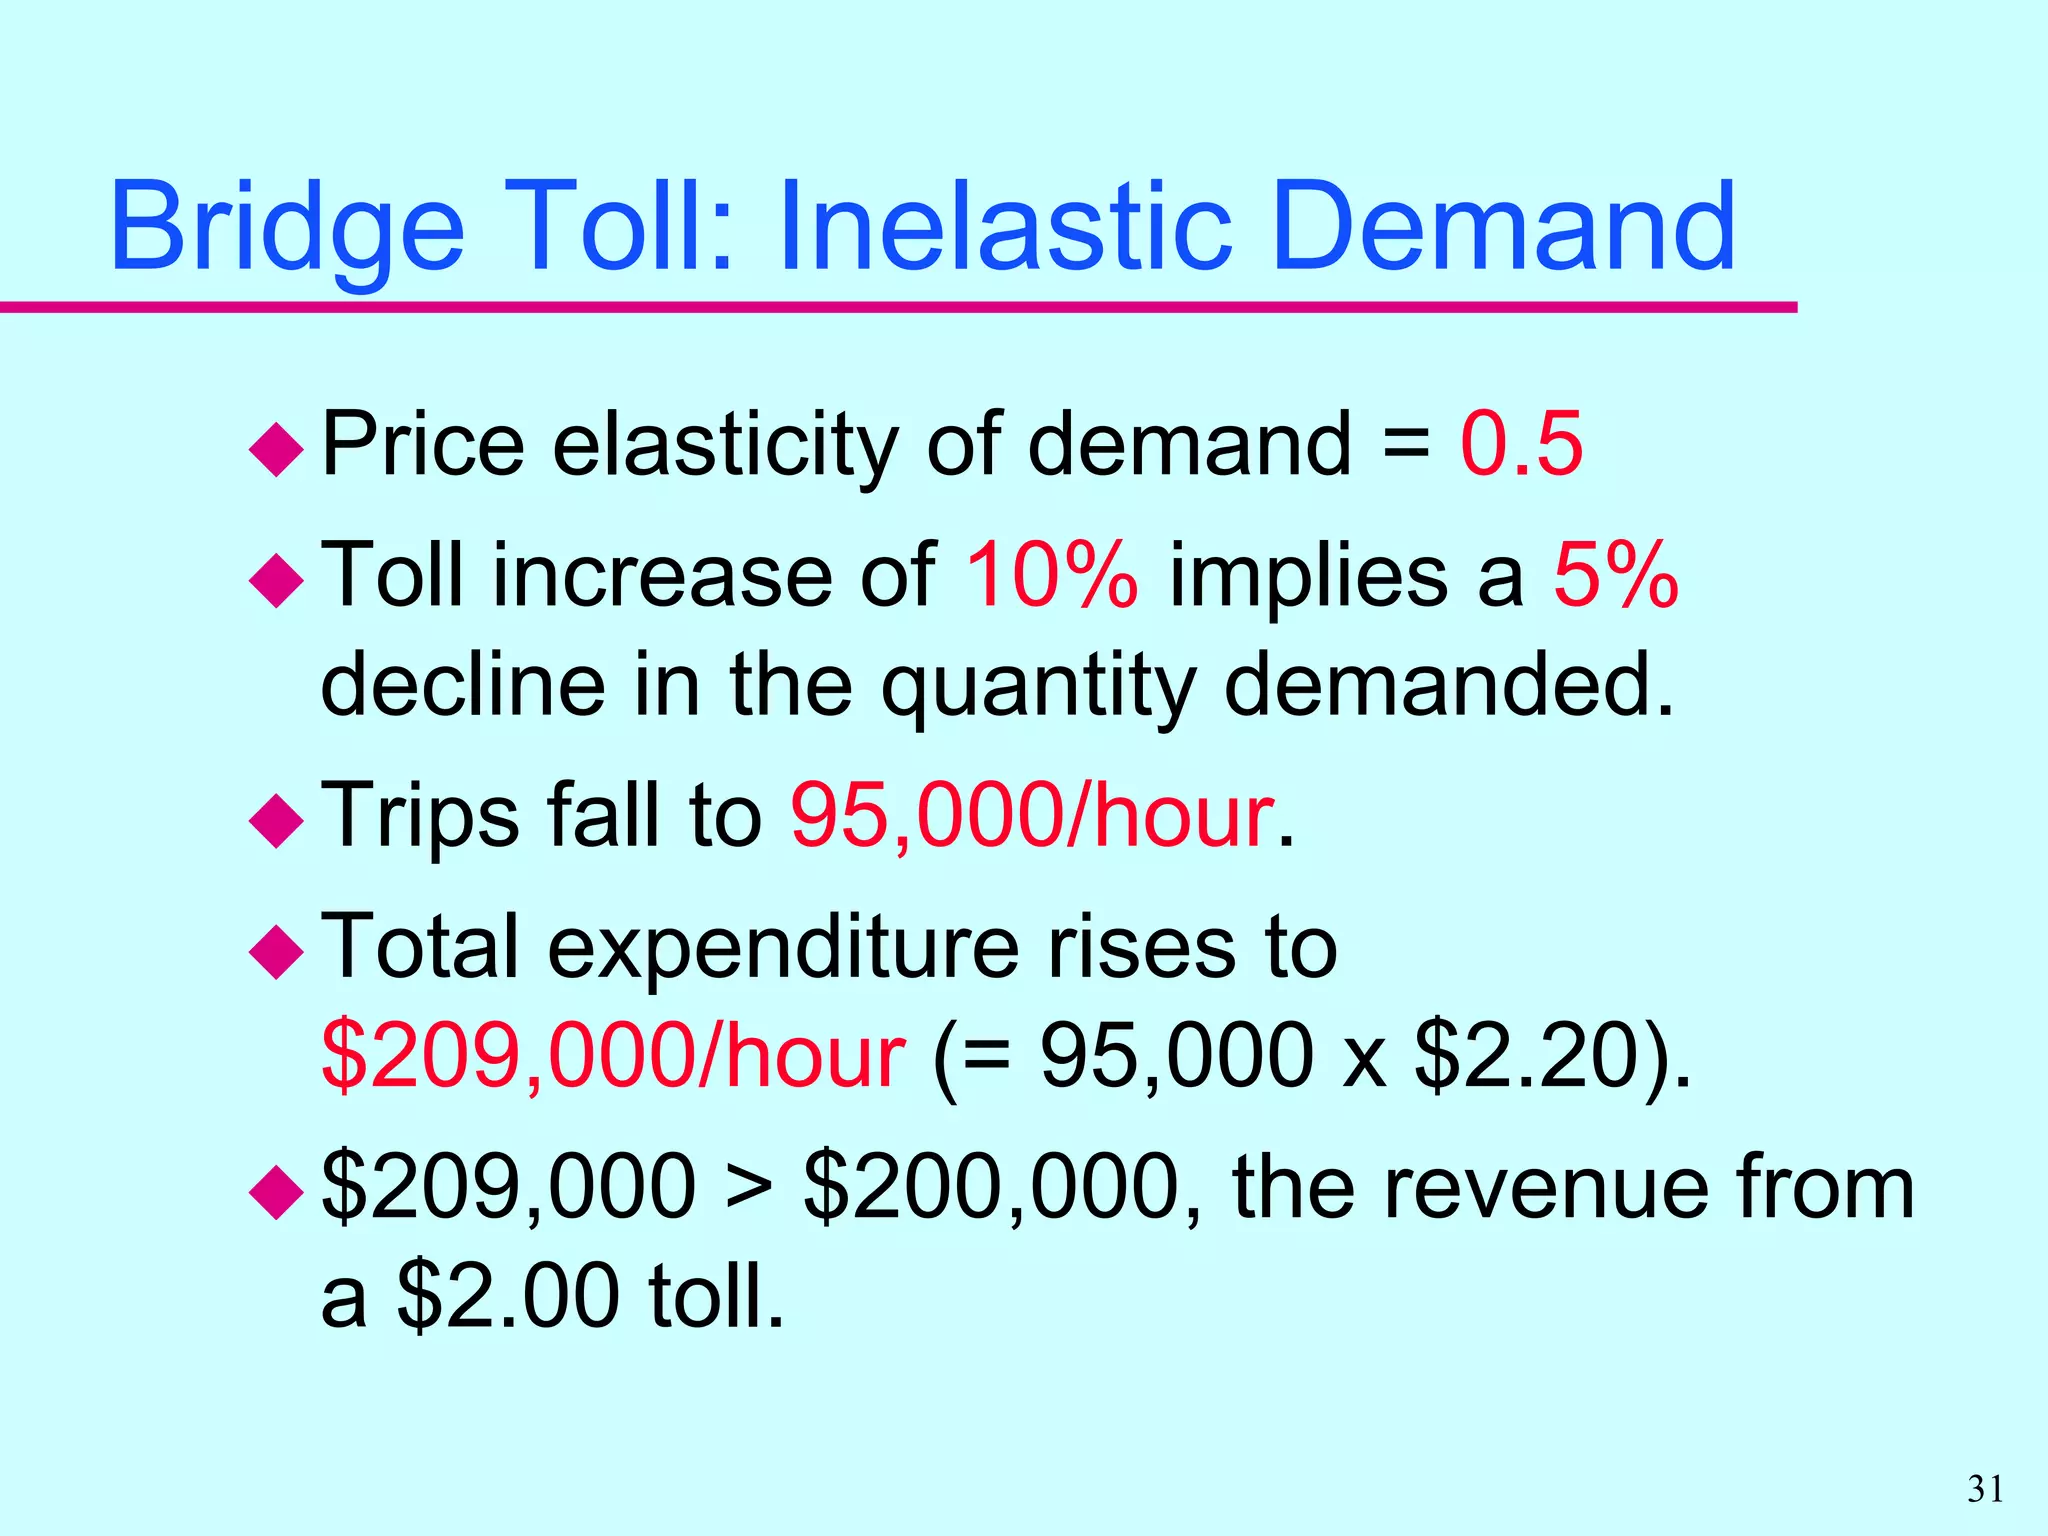
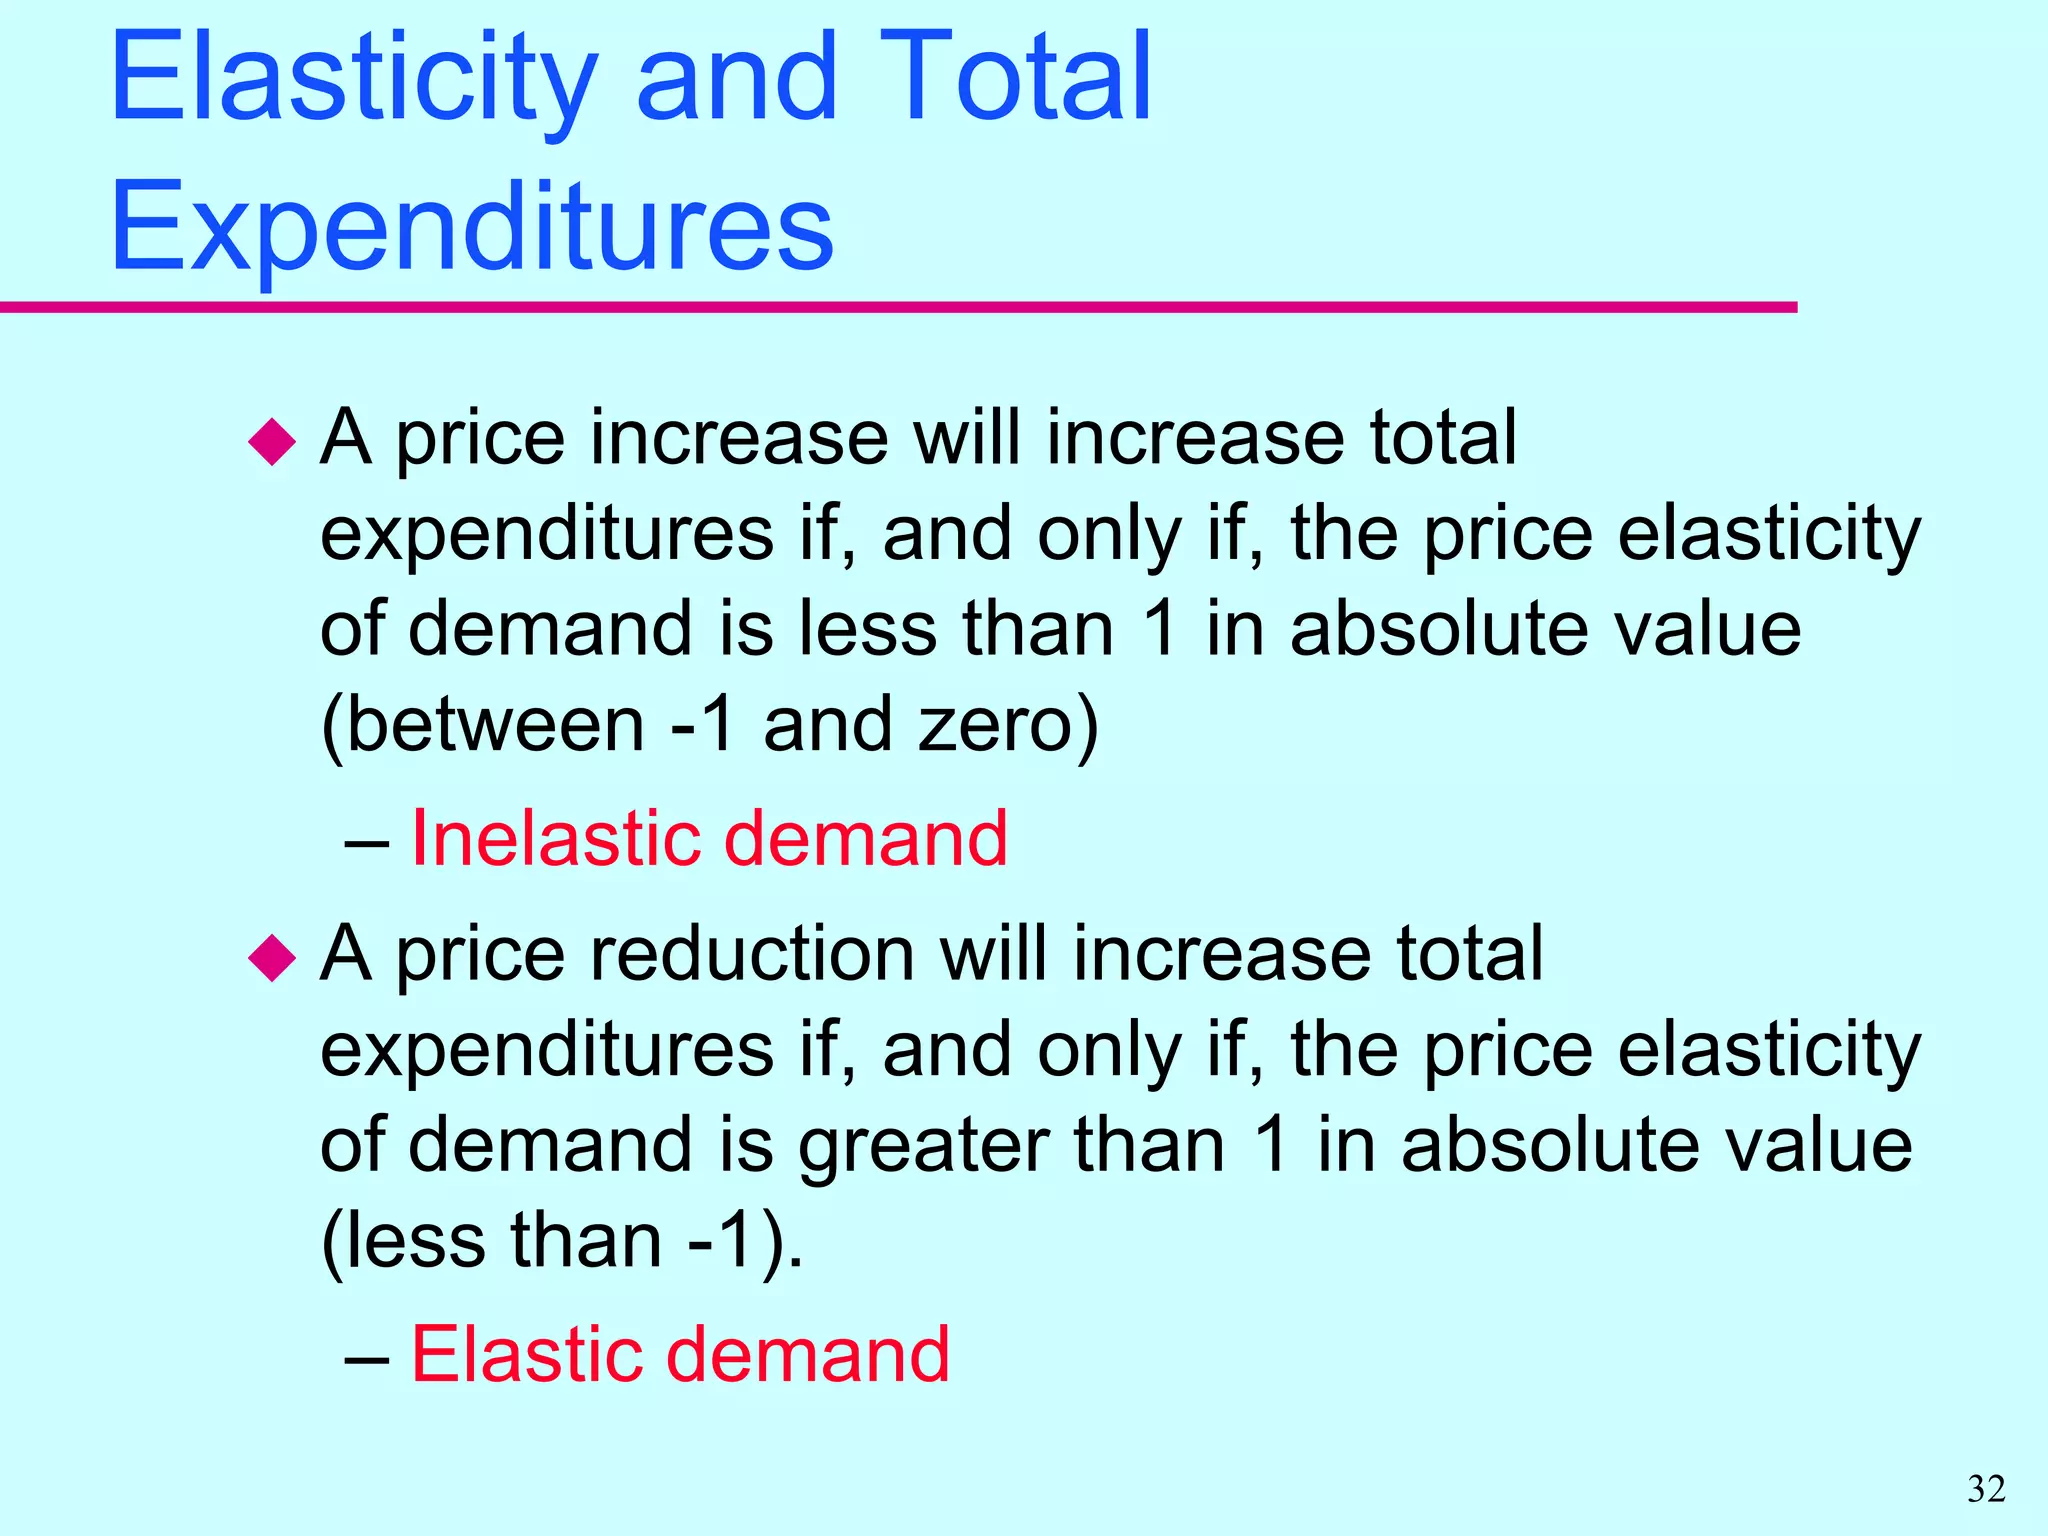
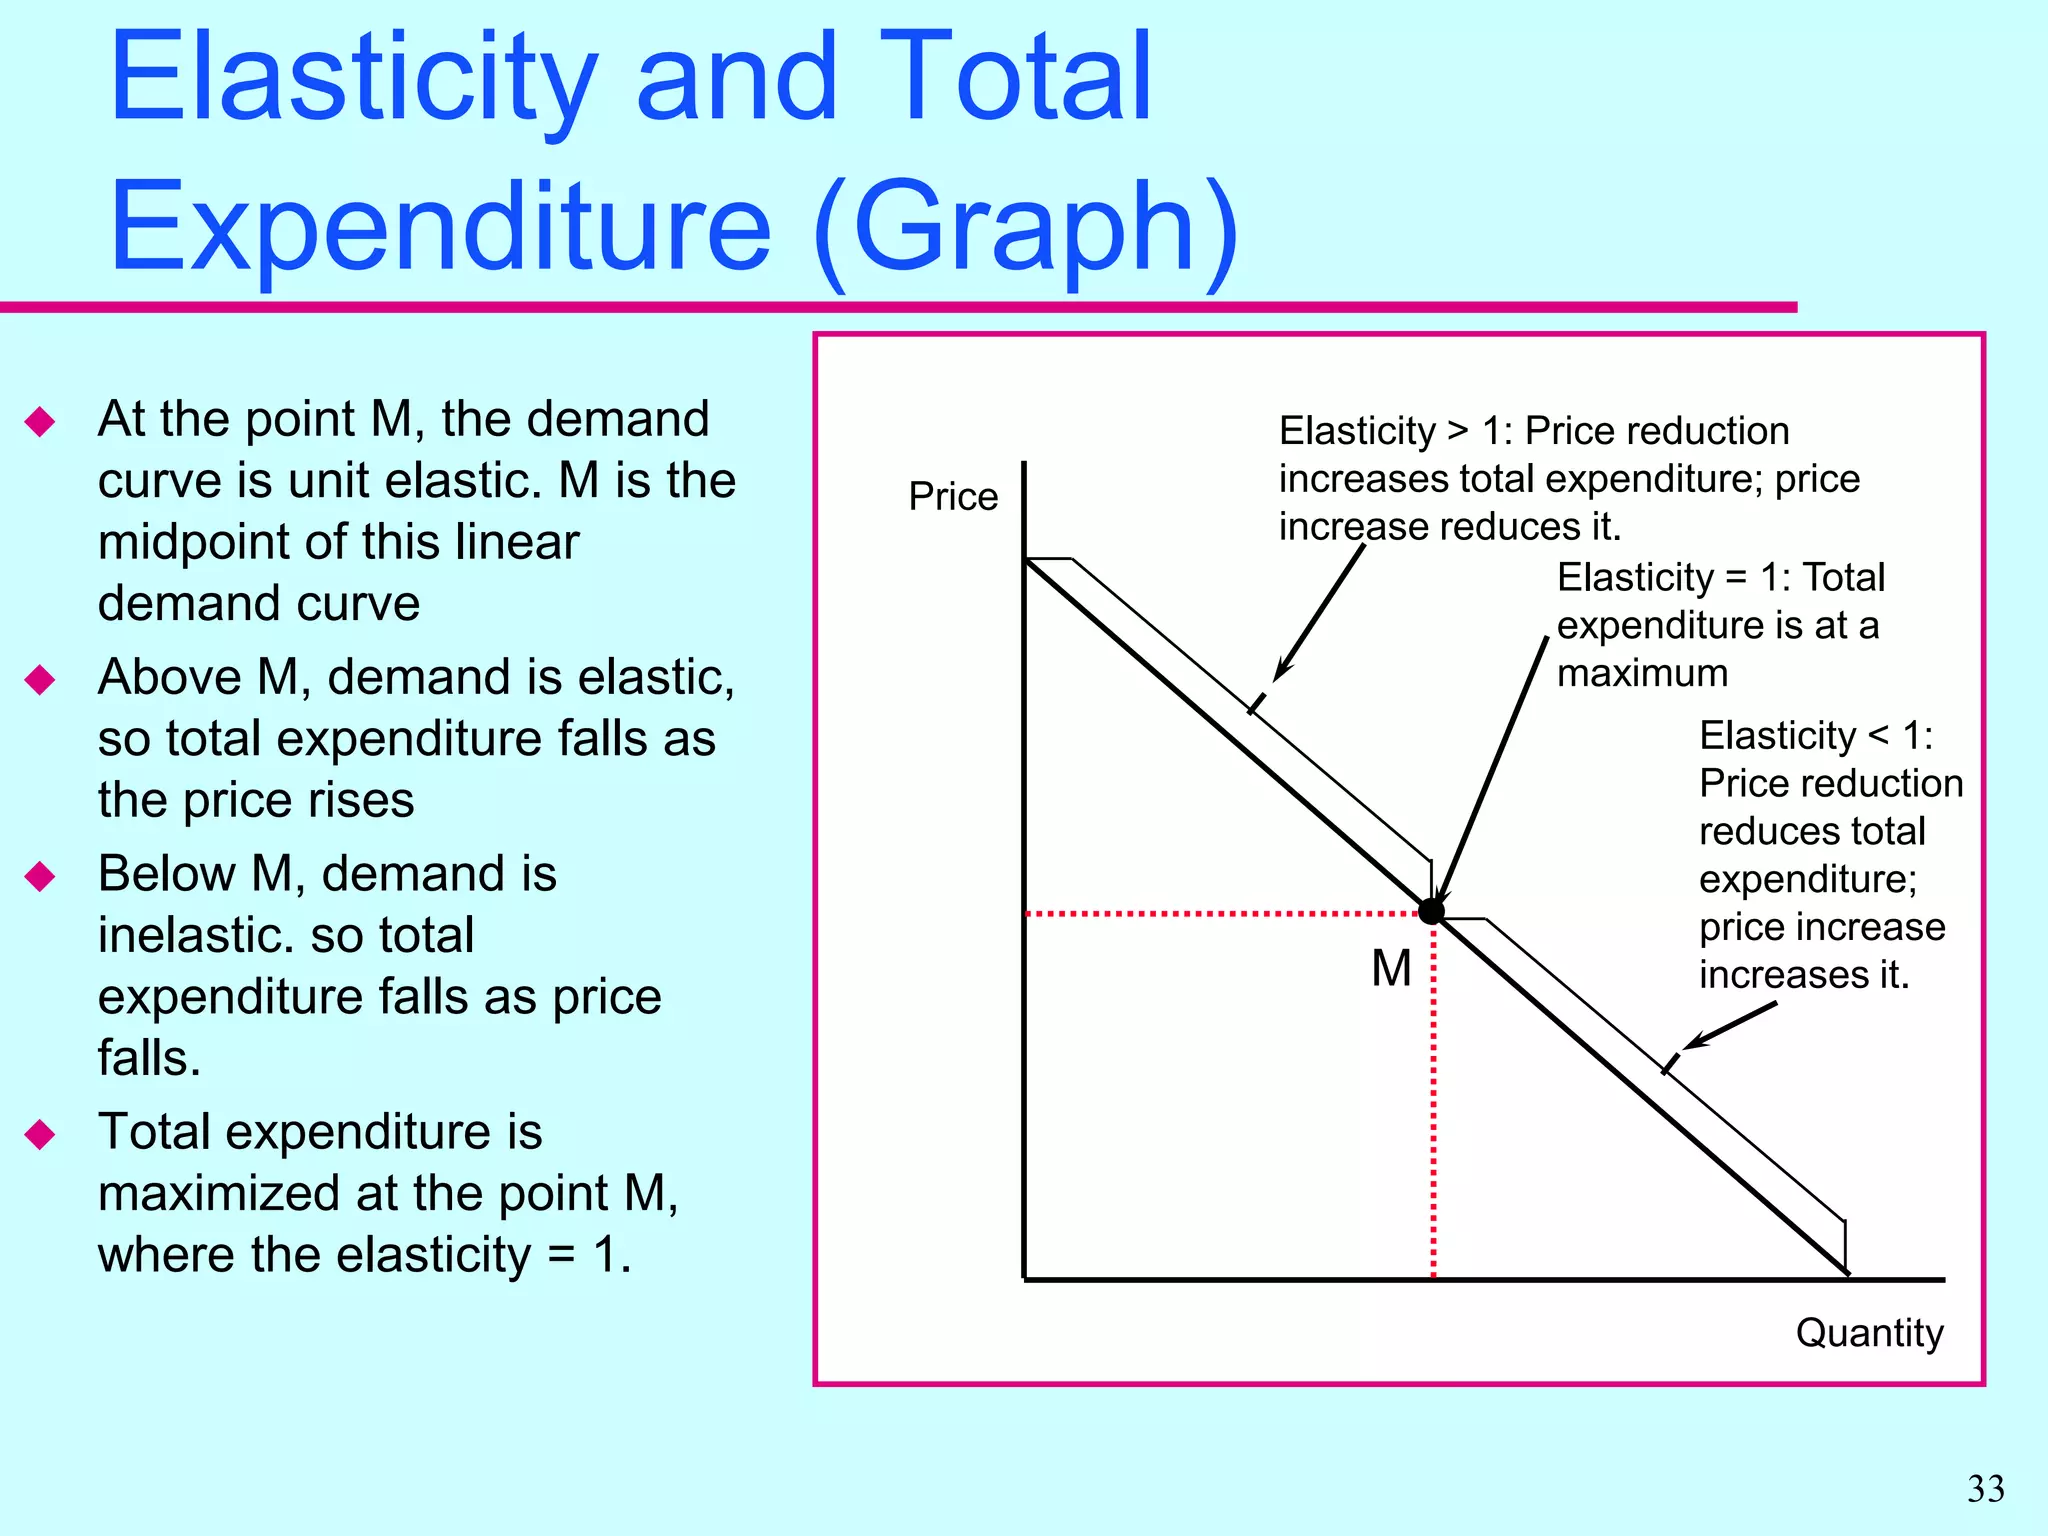
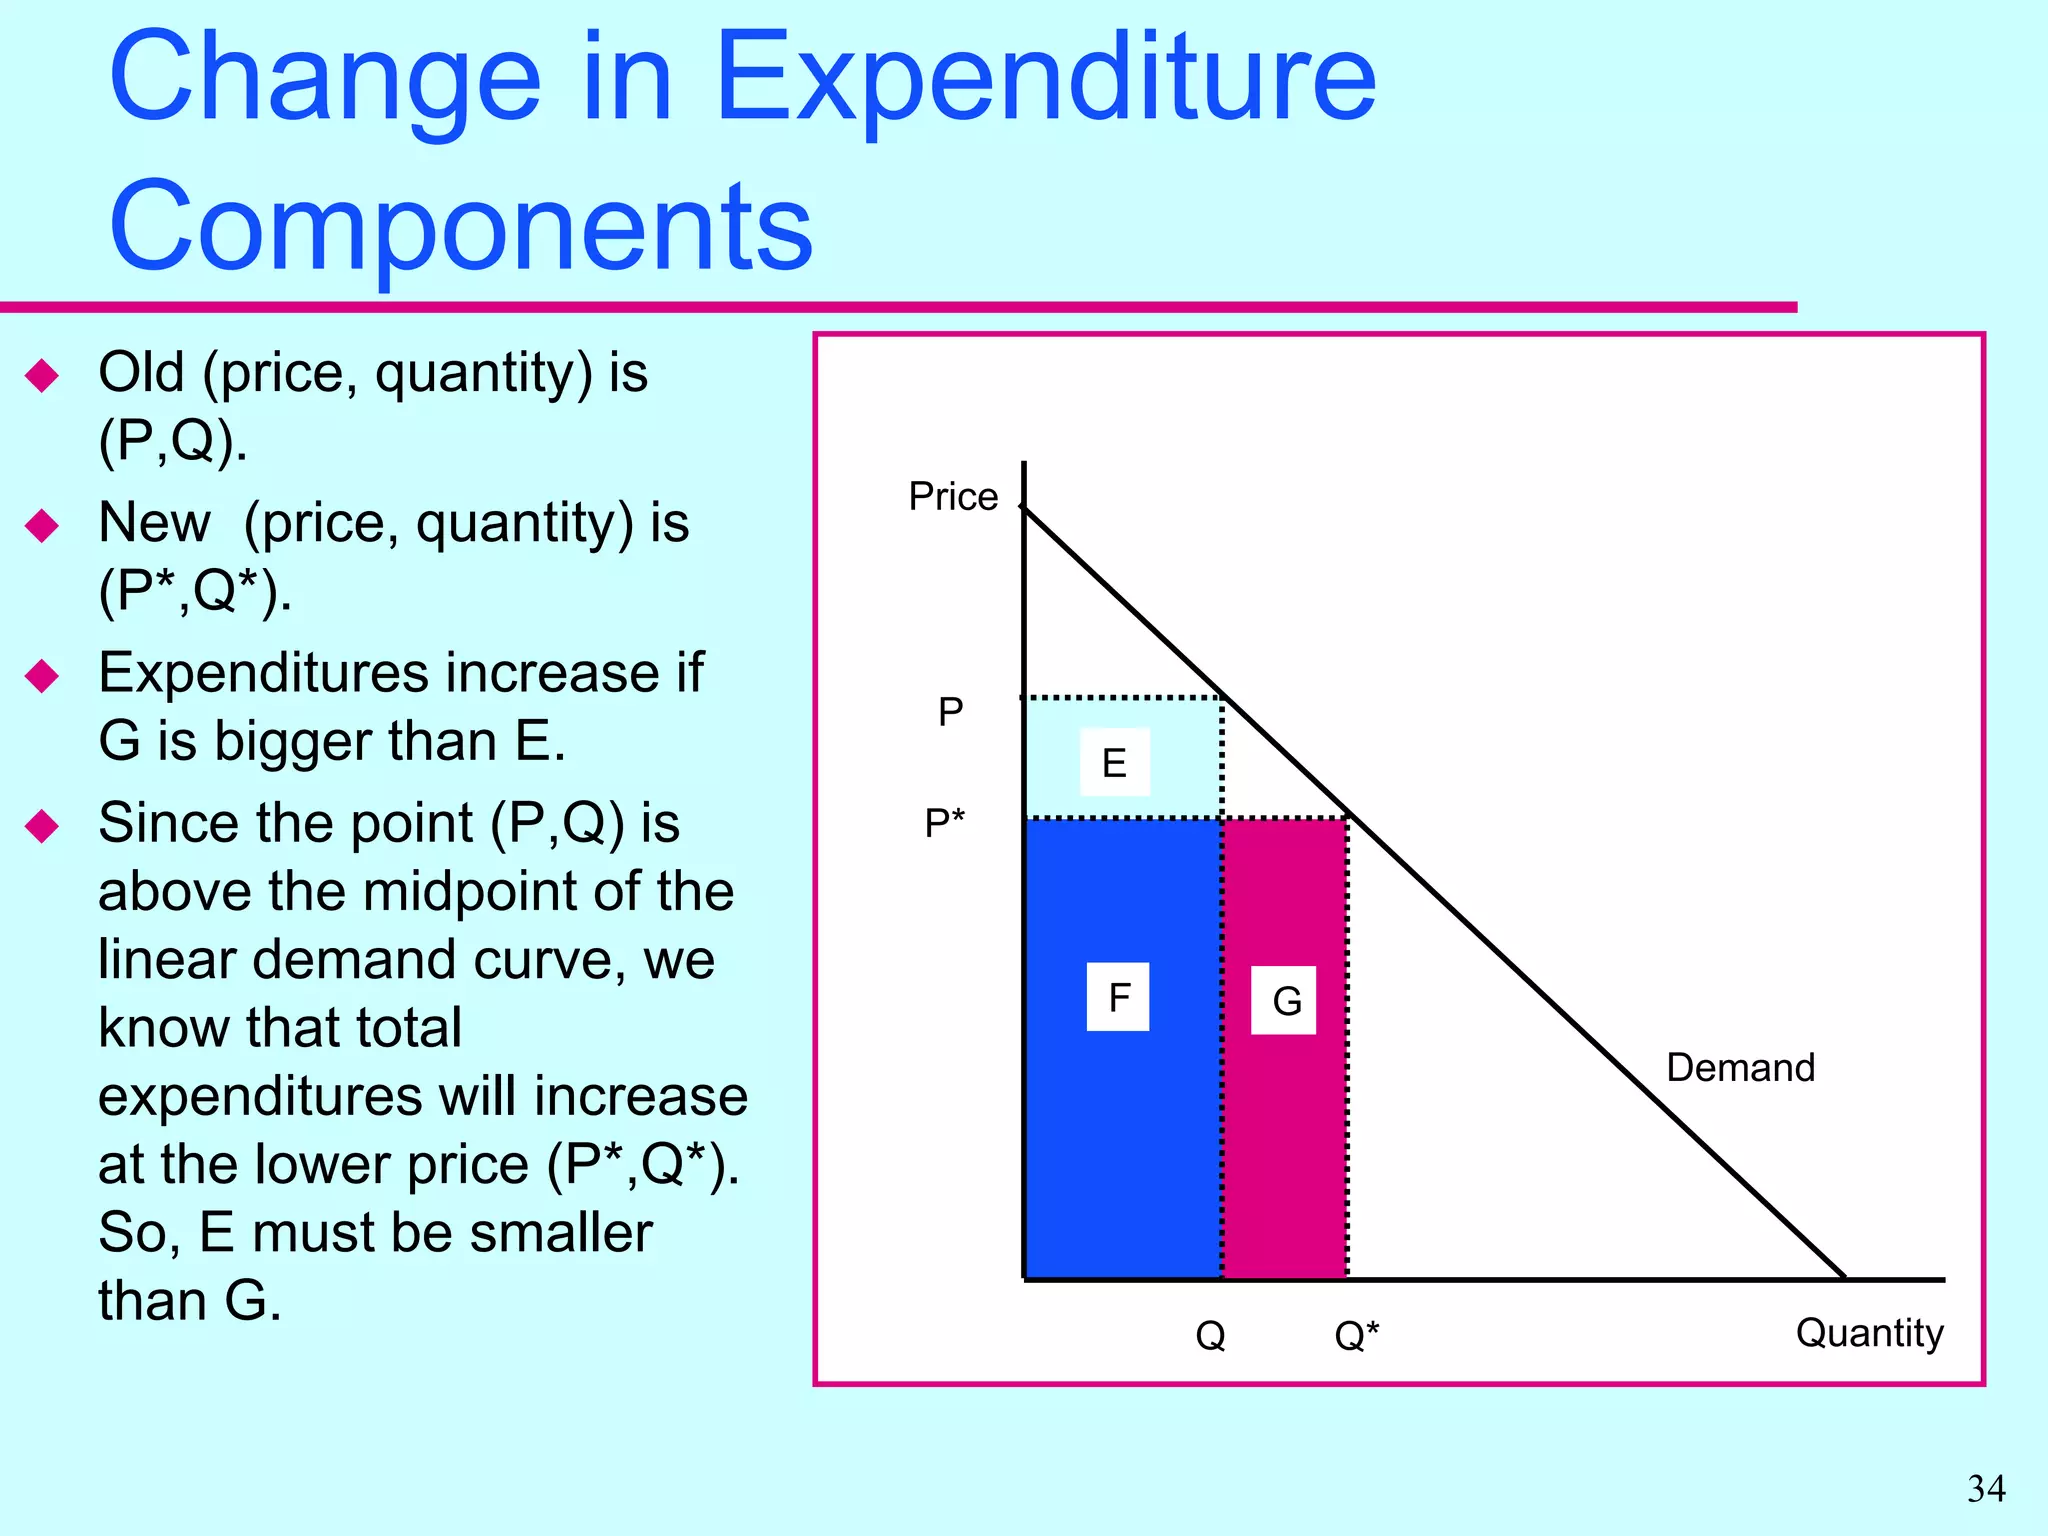


Elasticity measures the responsiveness of quantity to price changes. It allows economists to compare markets without standardizing units. There are own price elasticities of demand and supply that measure responsiveness of quantity to the good's own price. Demand is more price sensitive when elasticity is further from zero. Total expenditures can increase or decrease with price changes depending on elasticity. Other elasticities include cross price and income elasticities.


