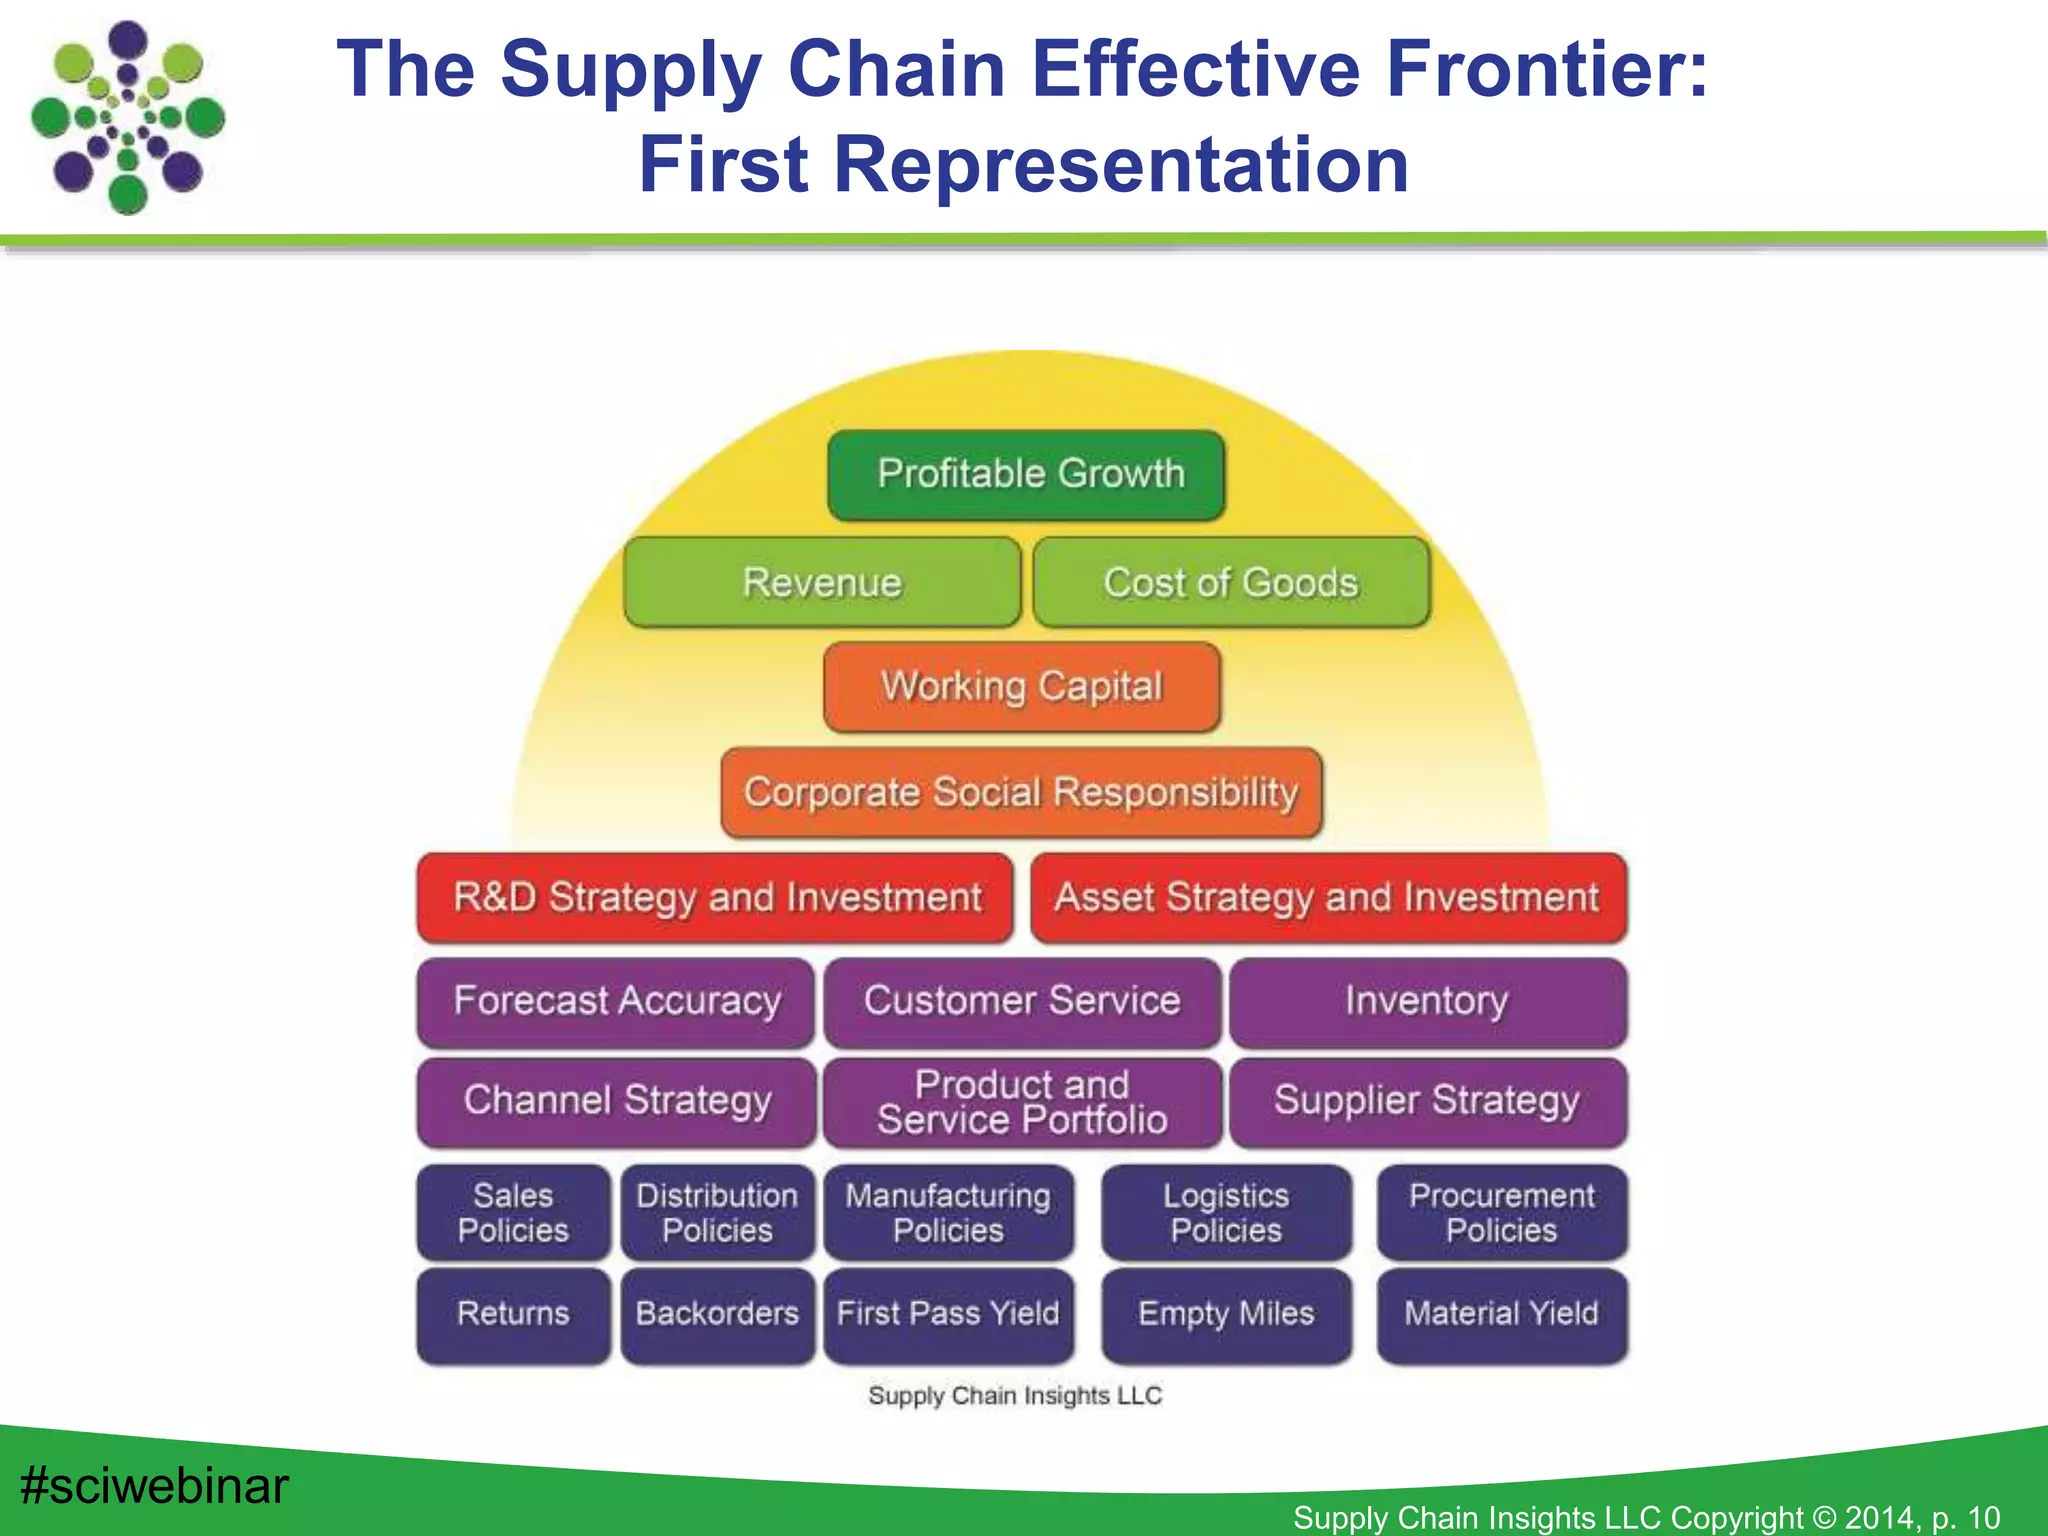
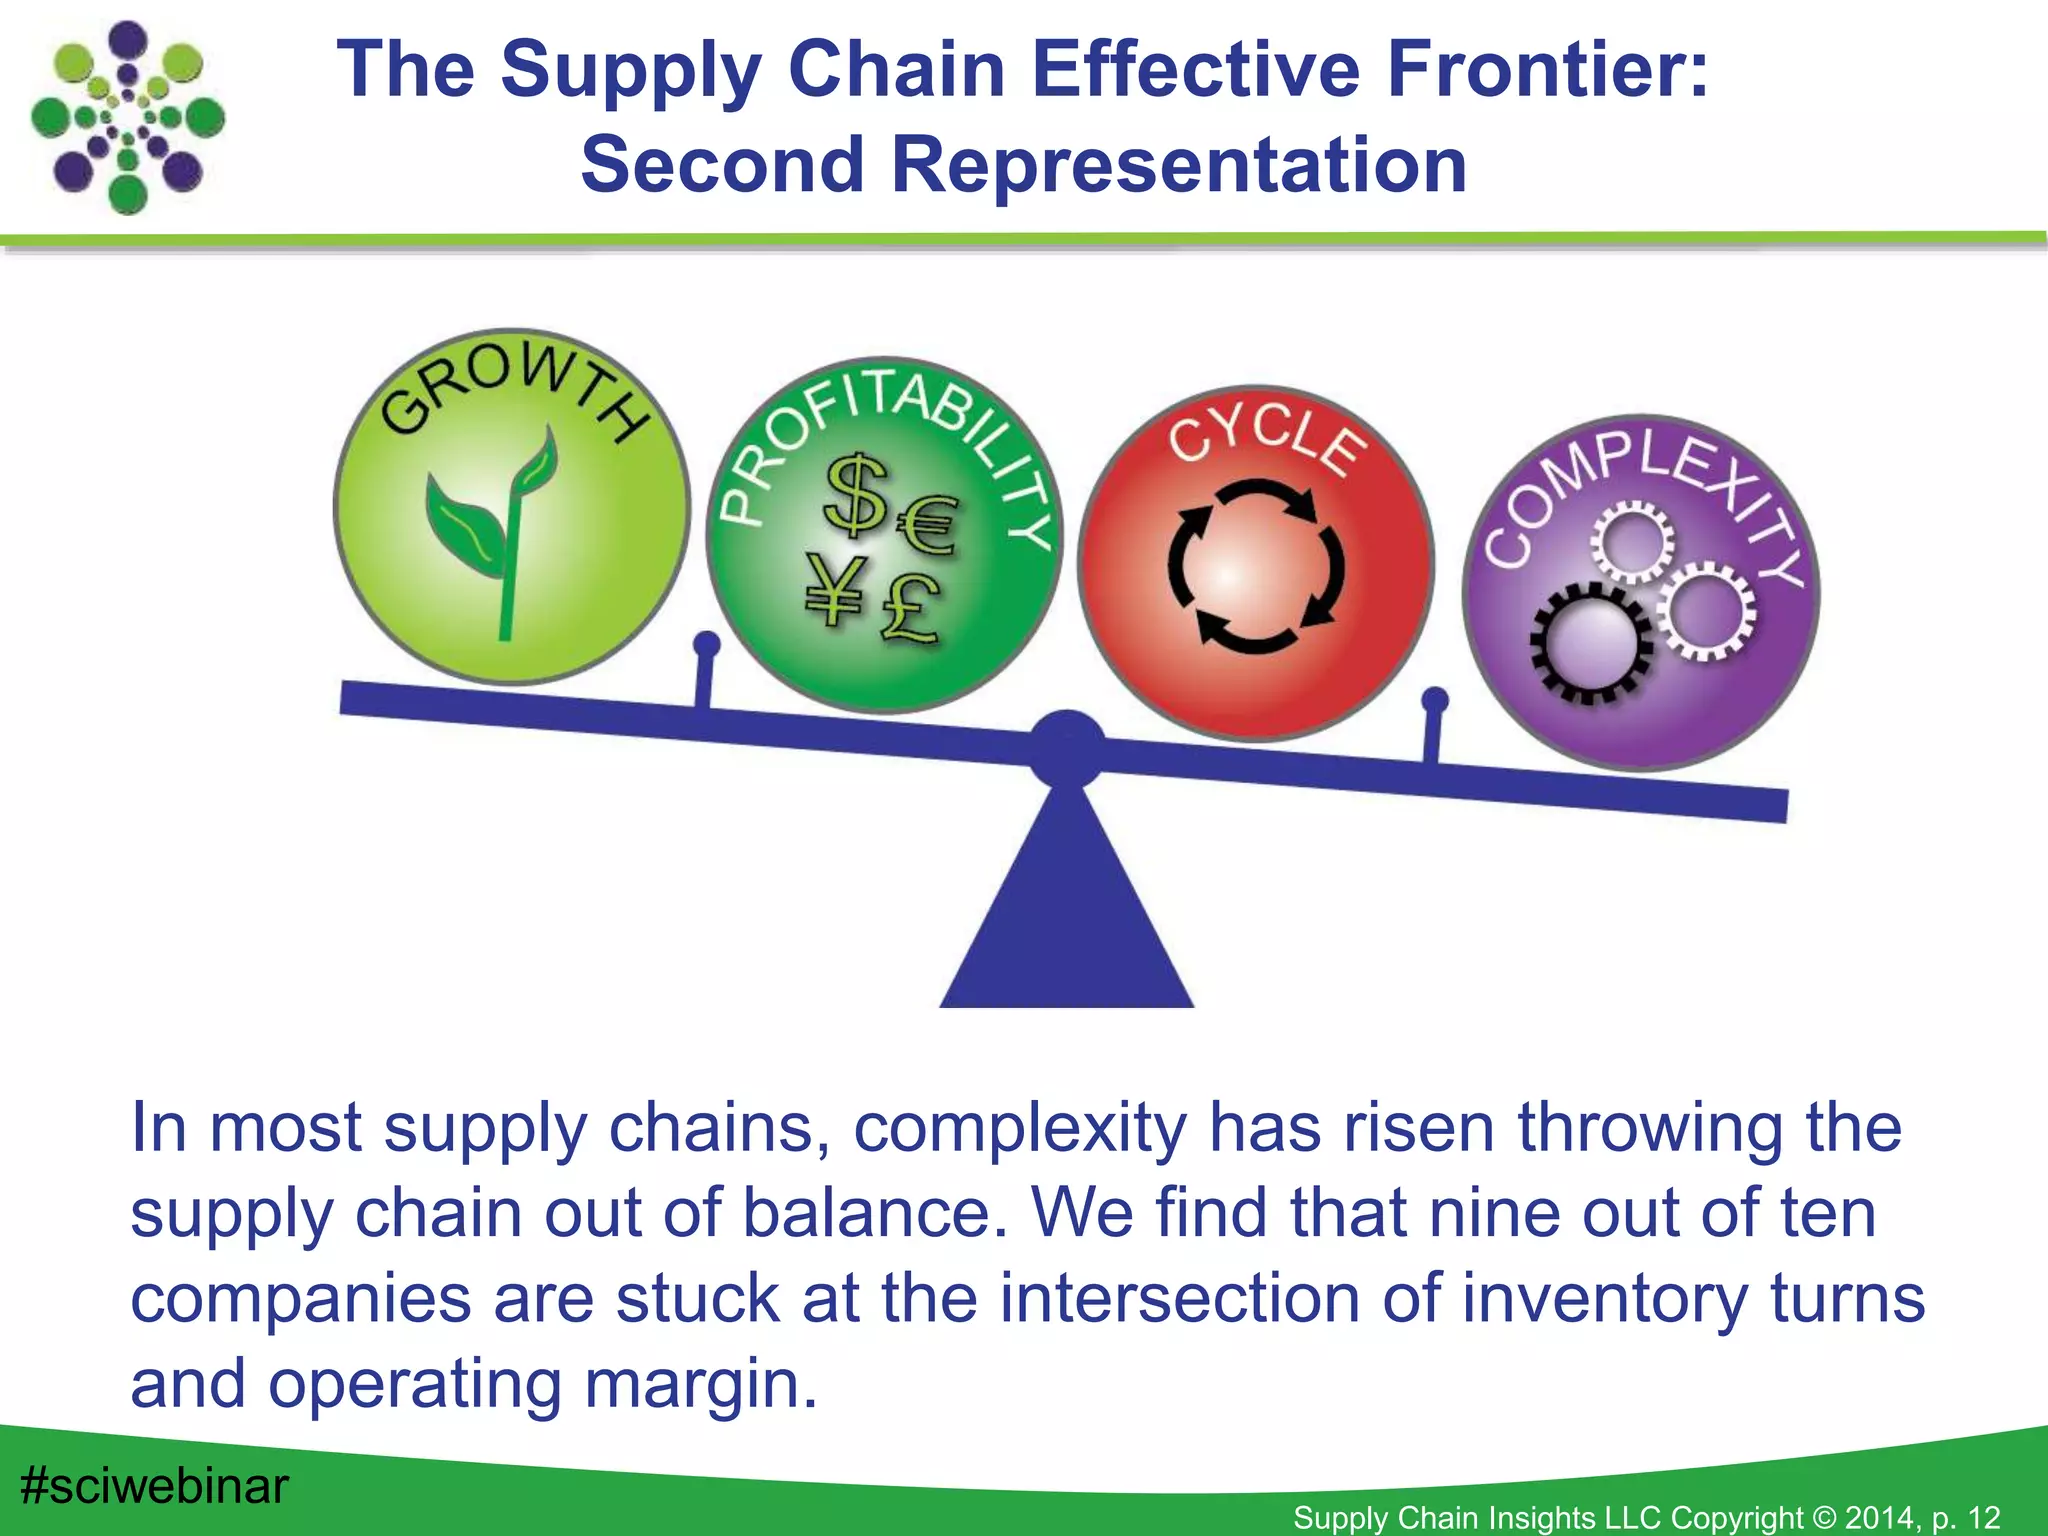
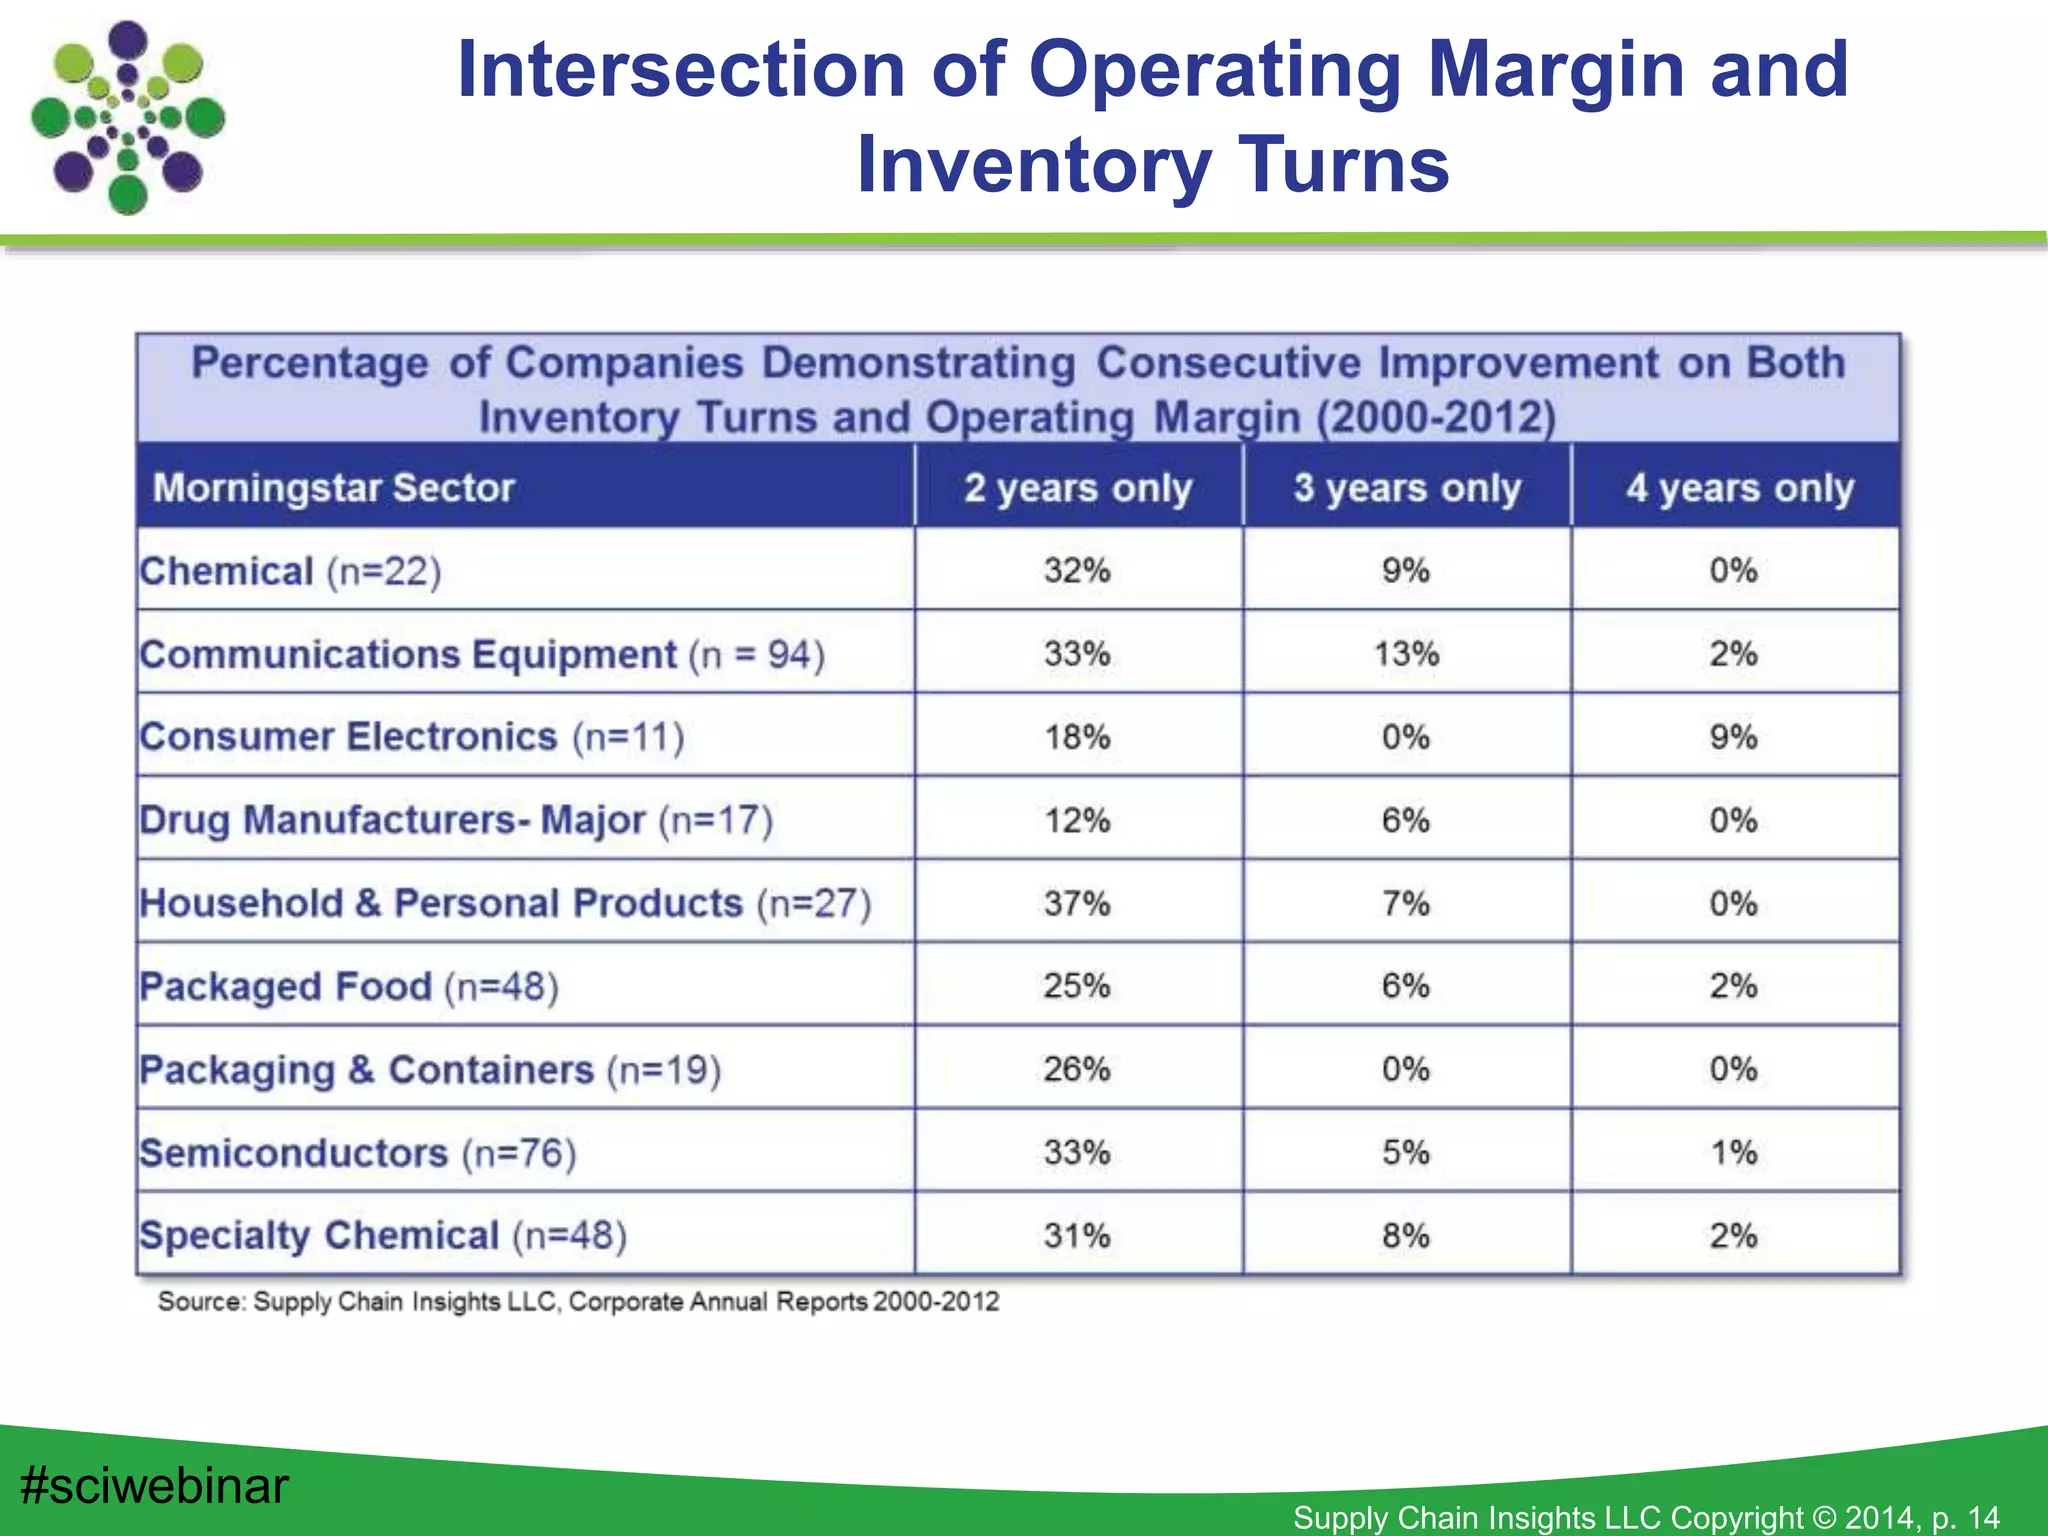
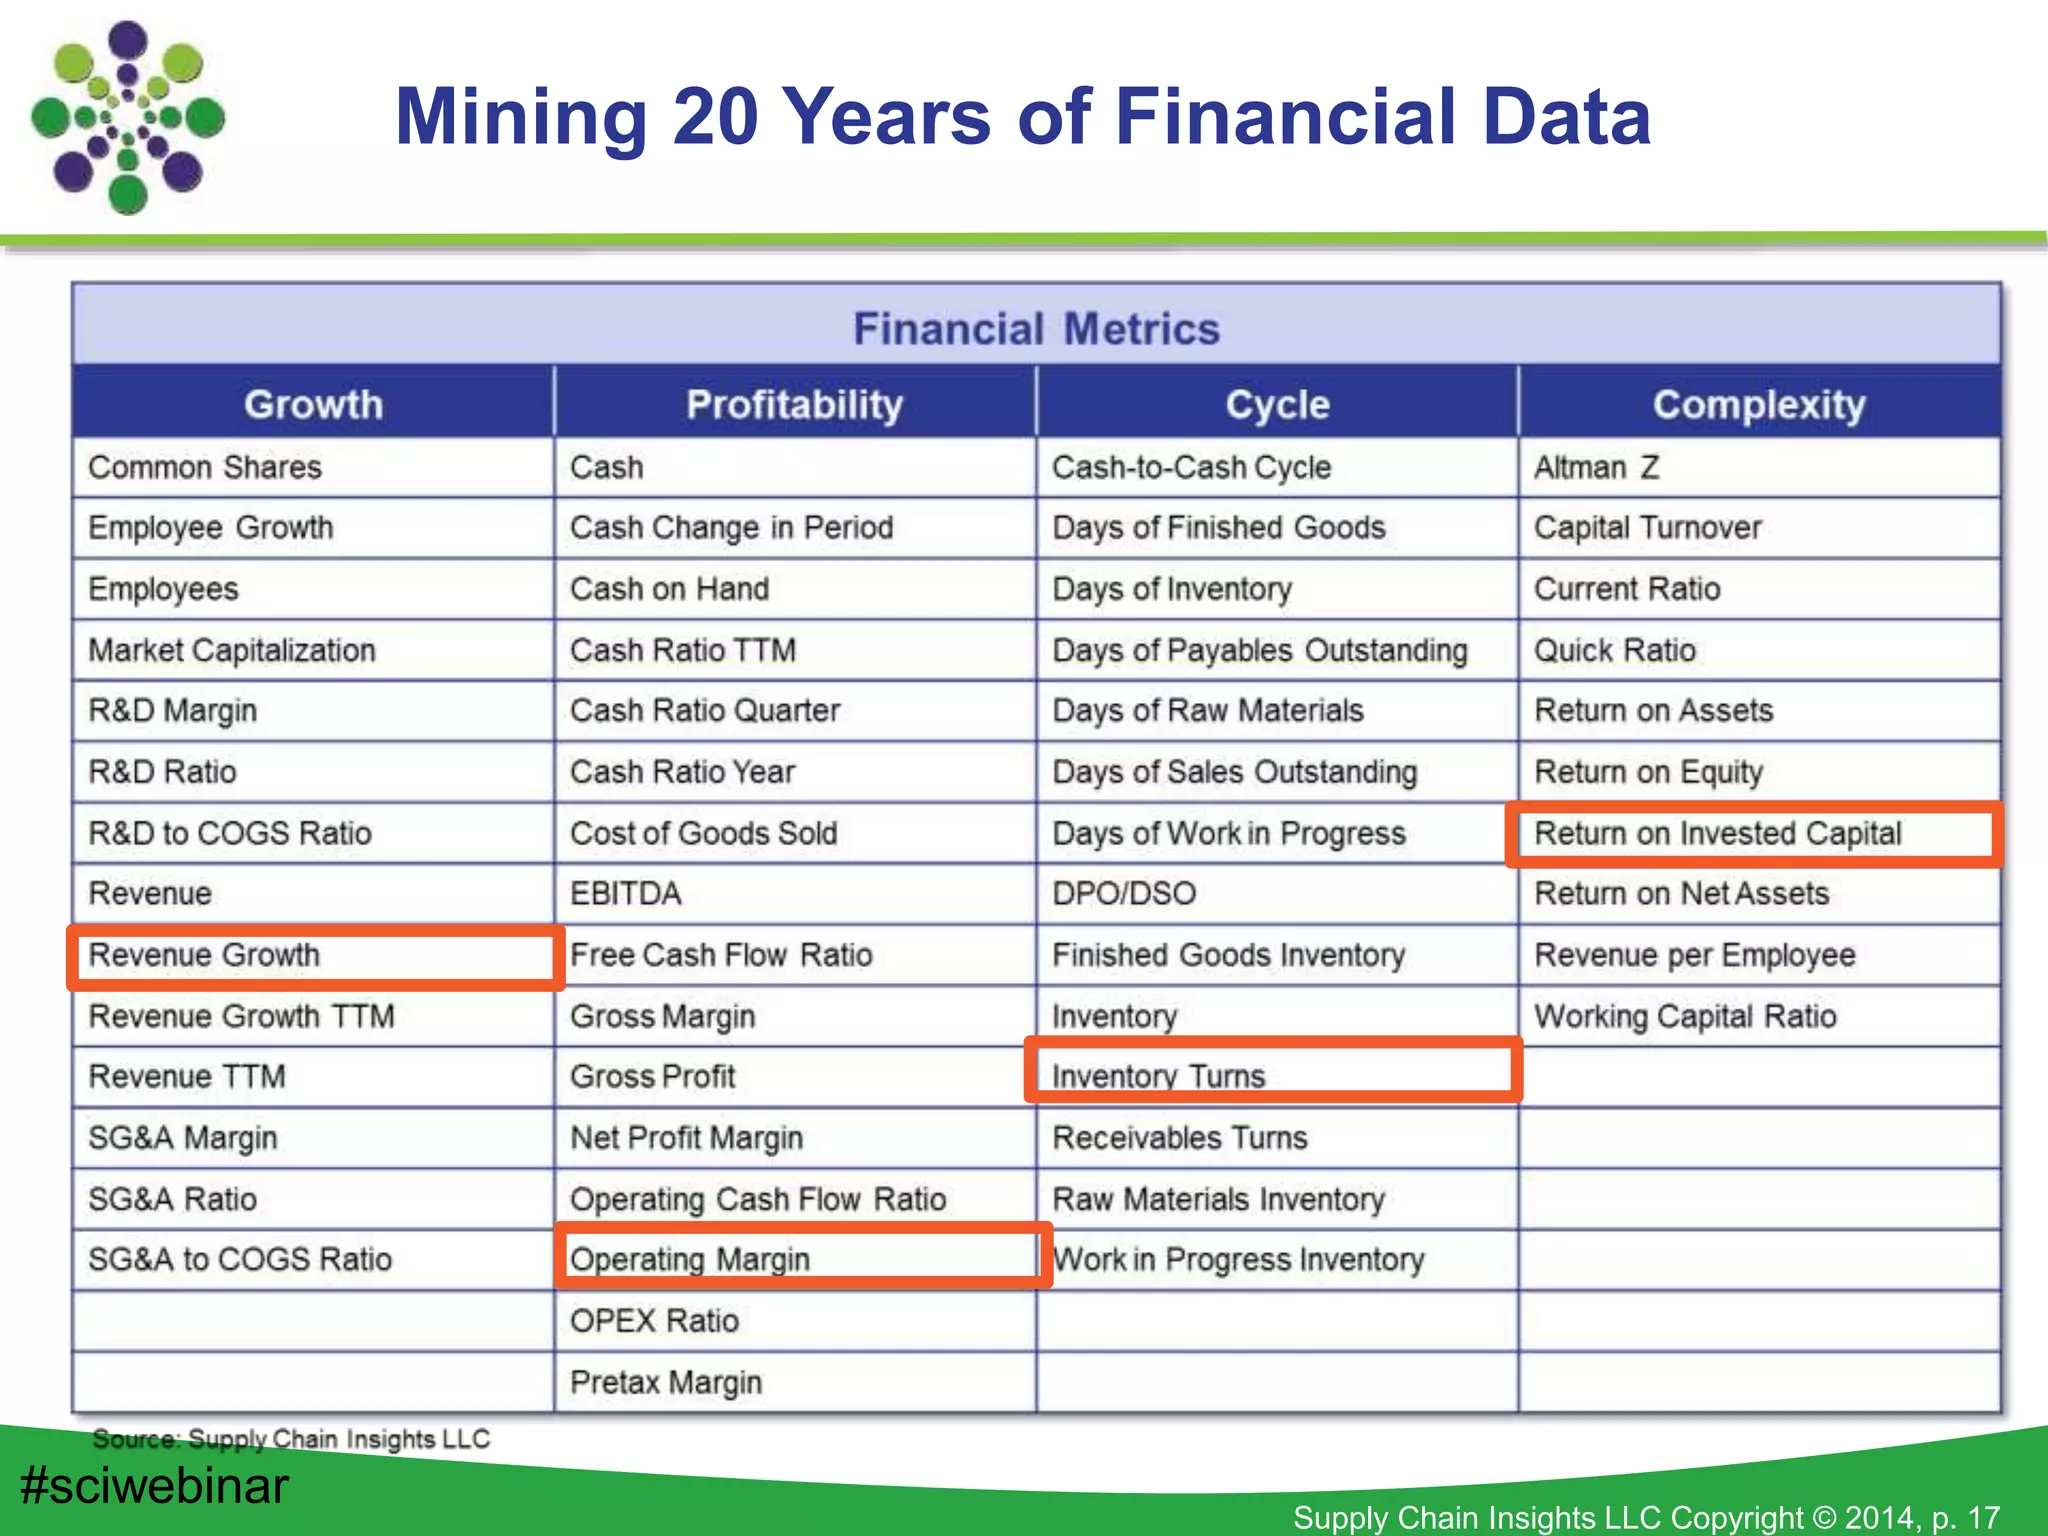
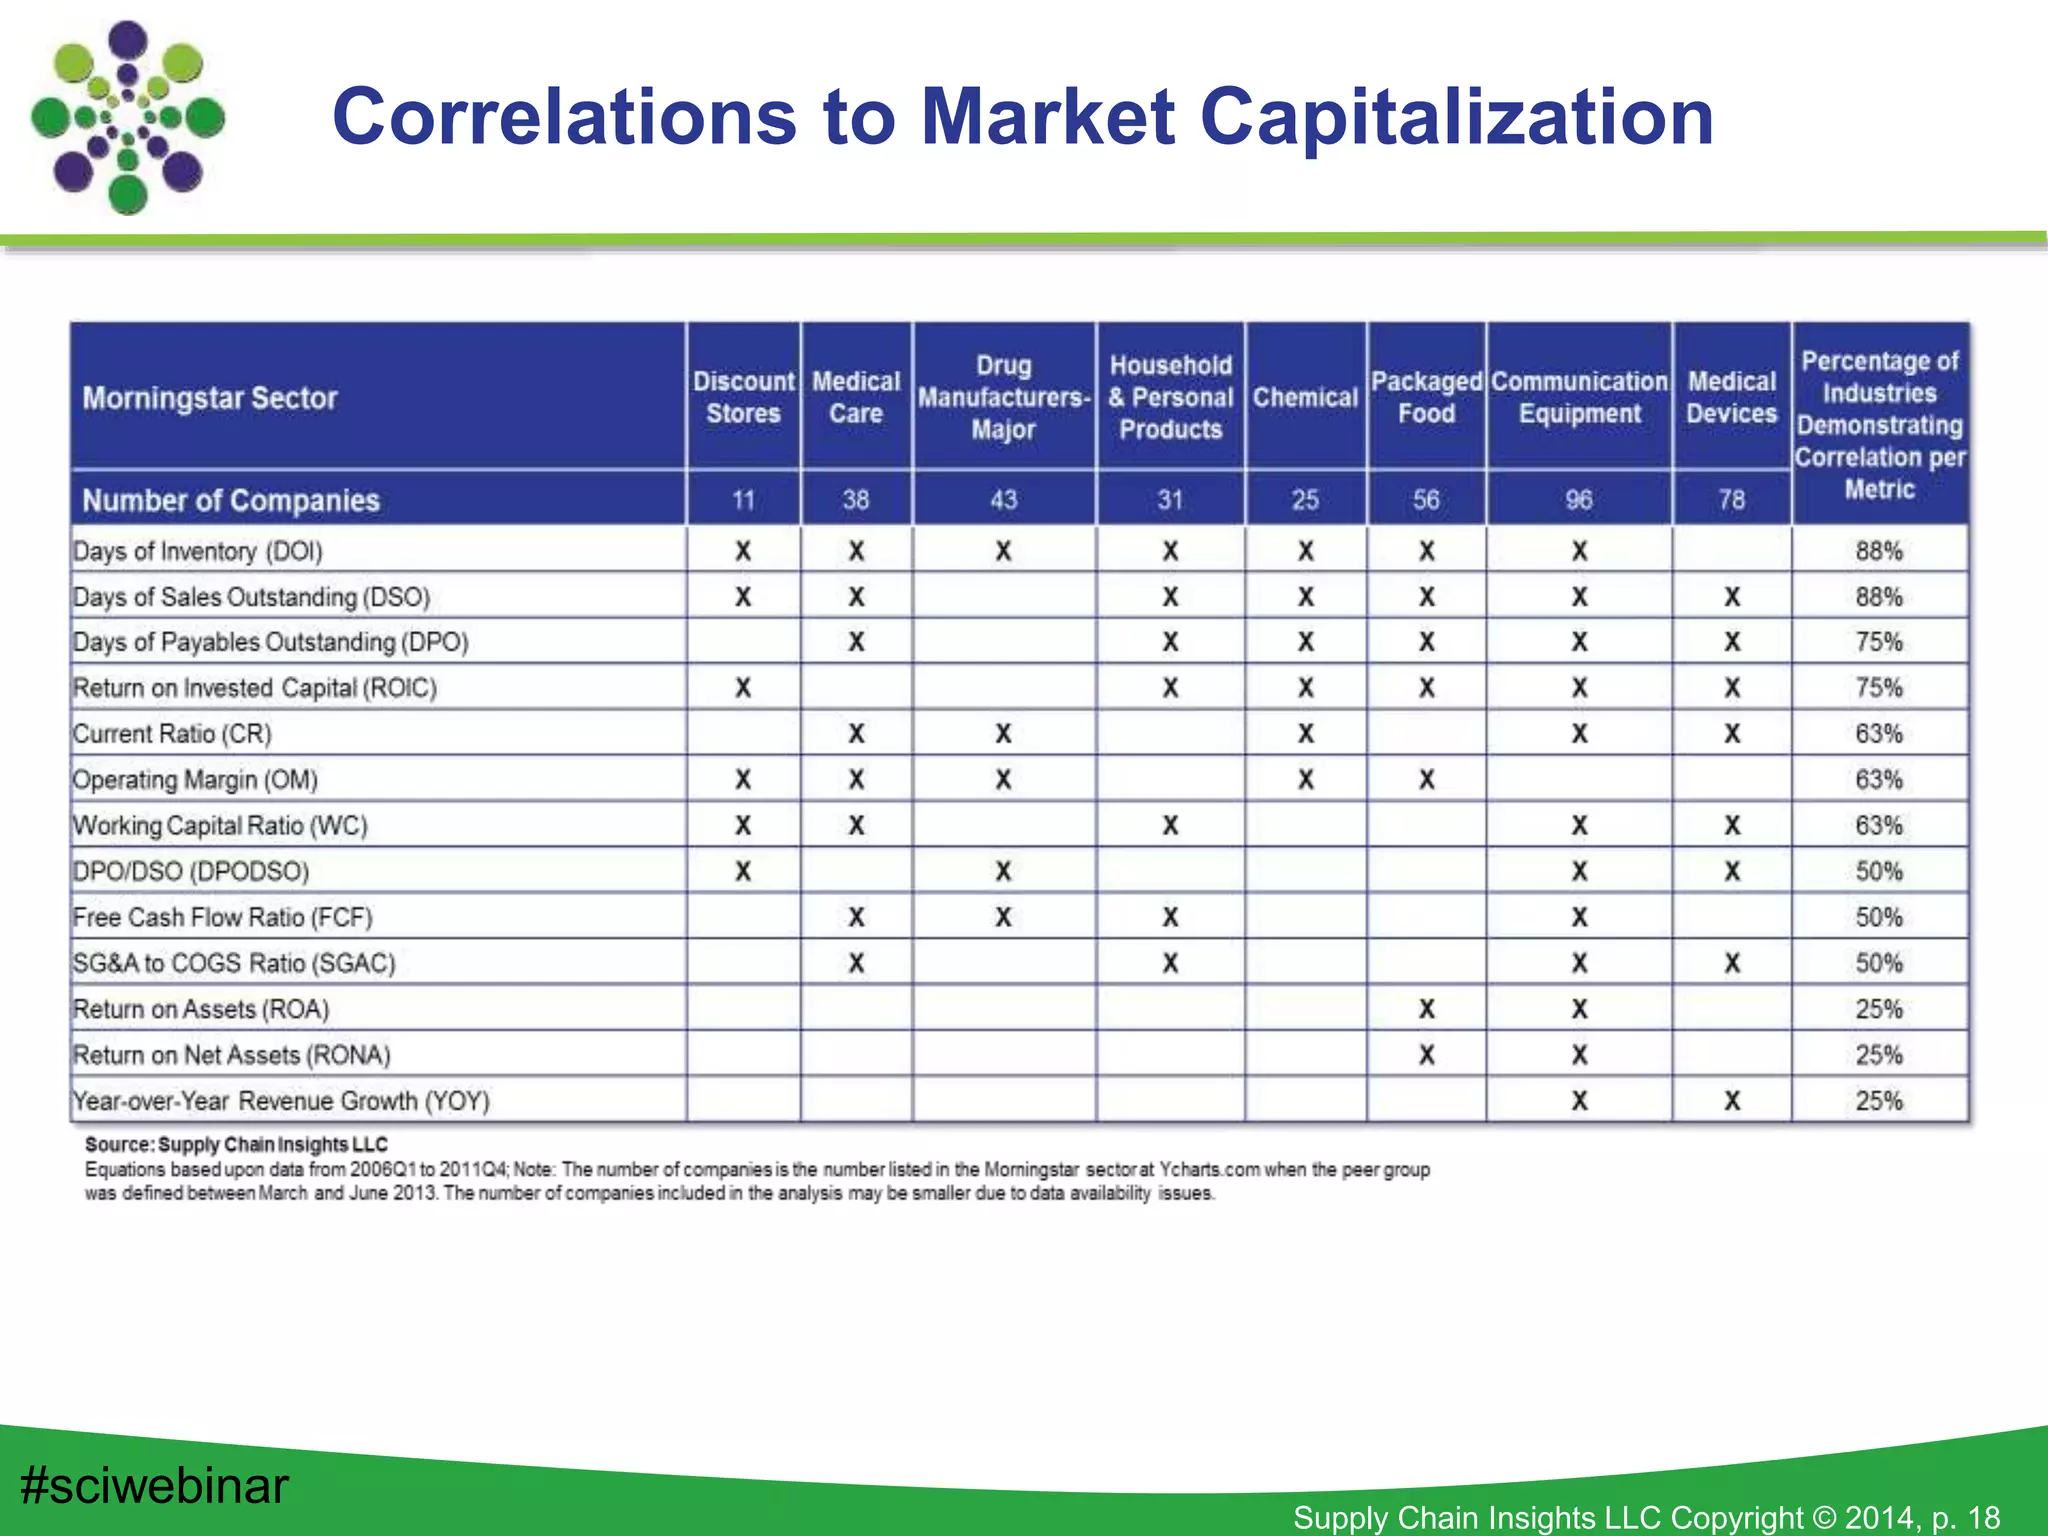
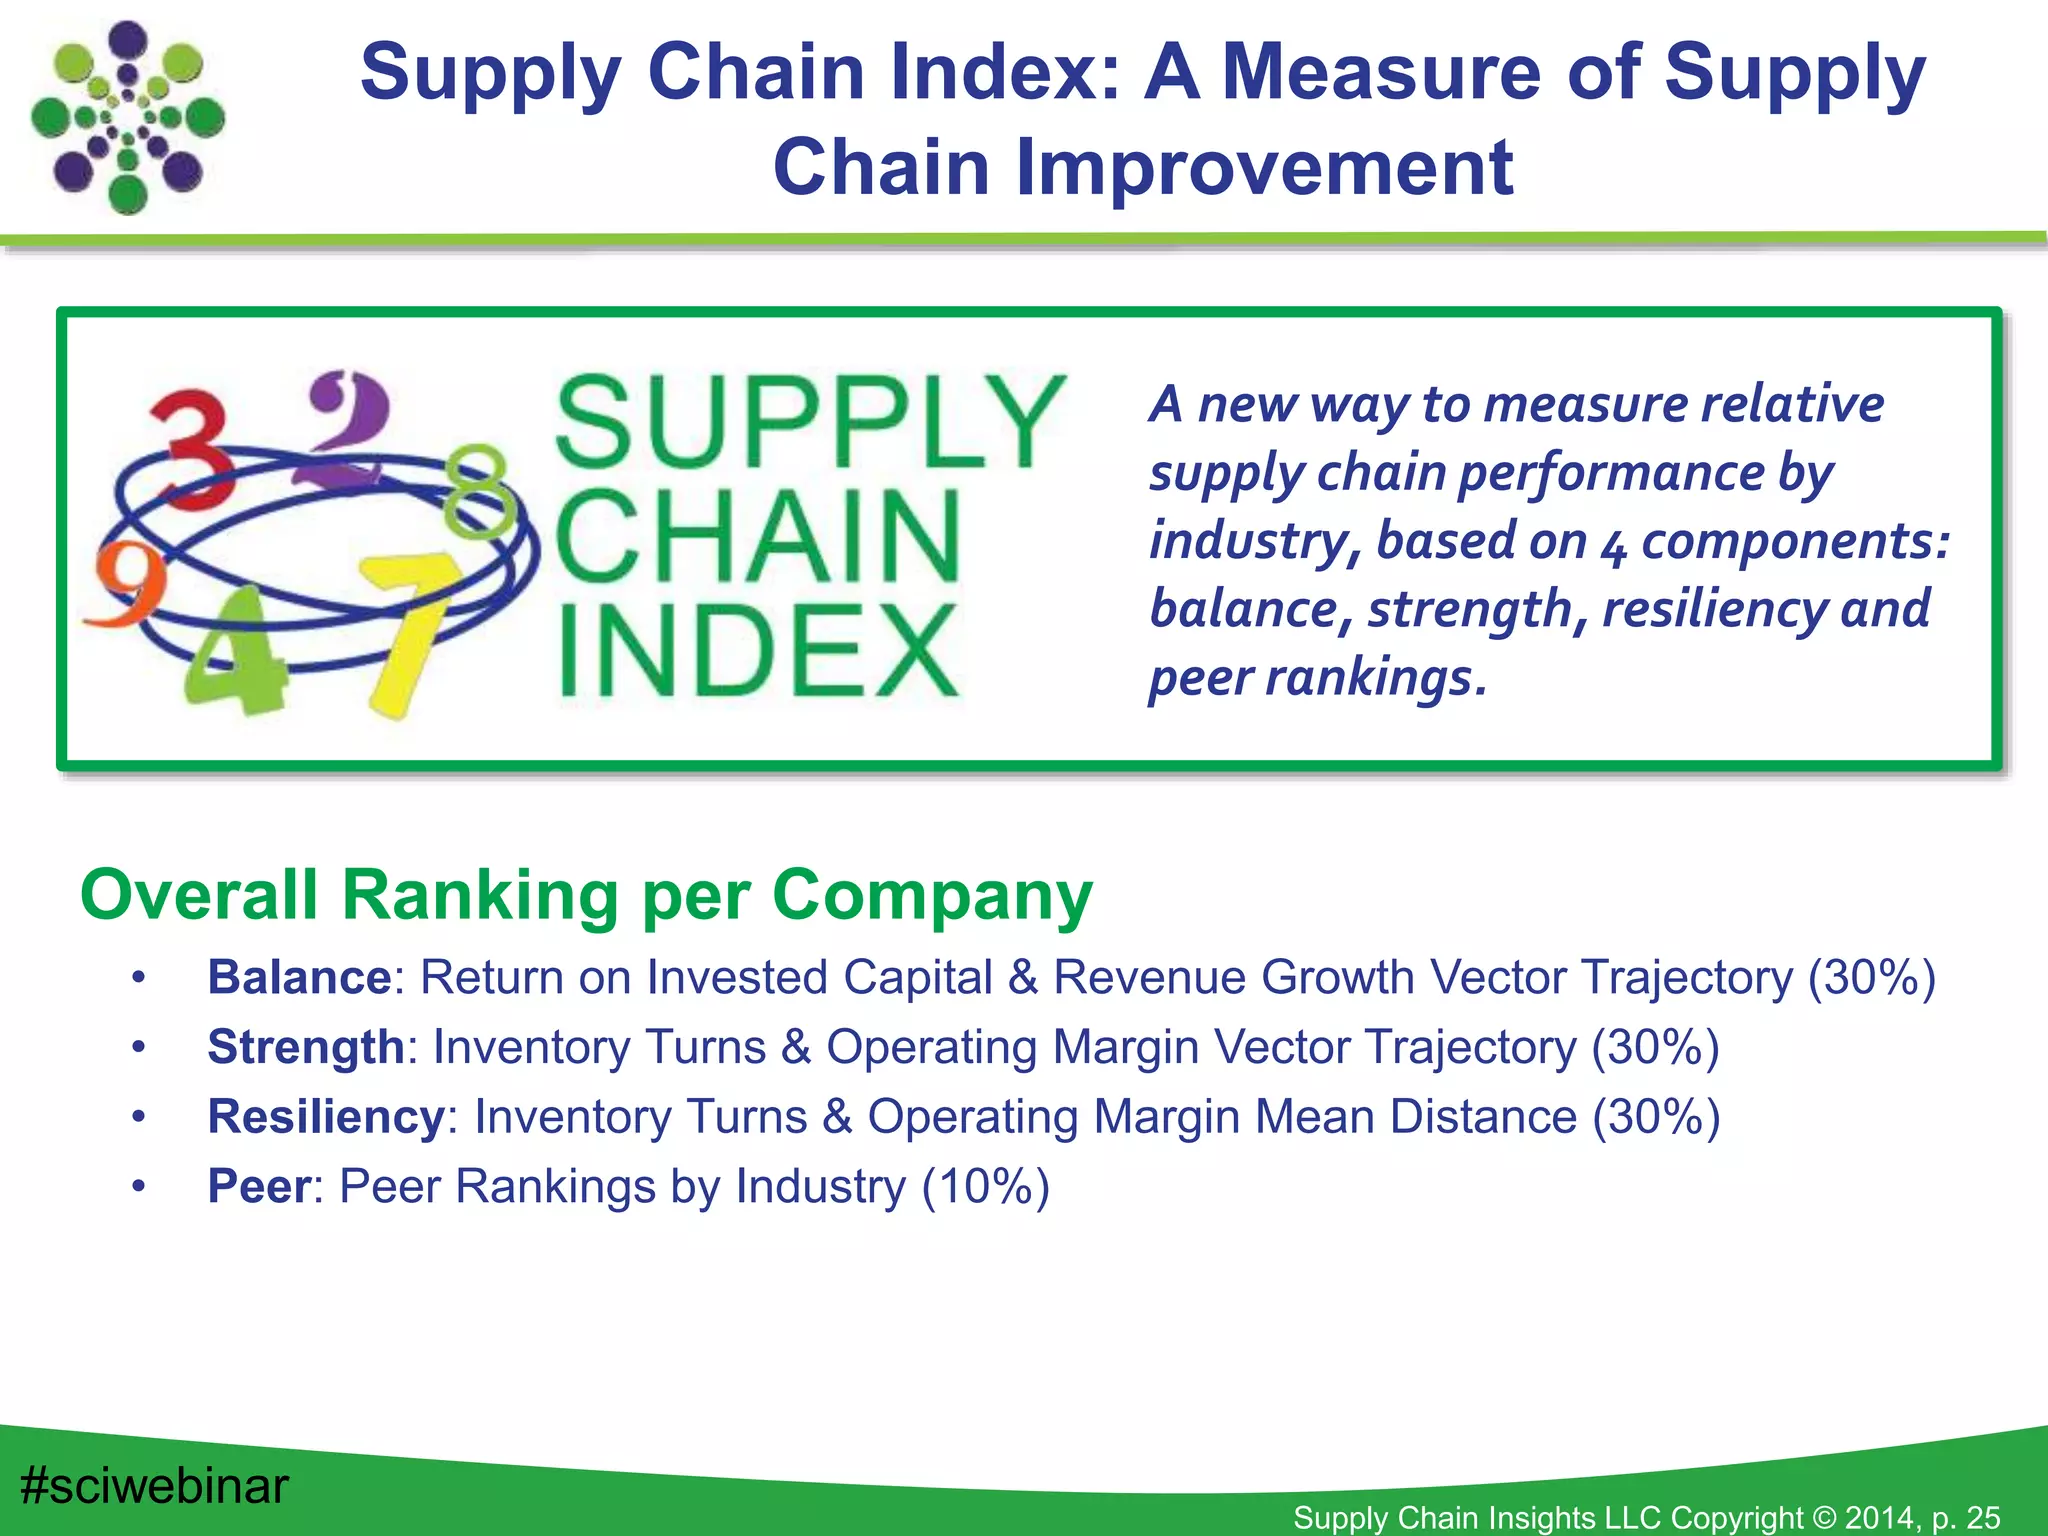
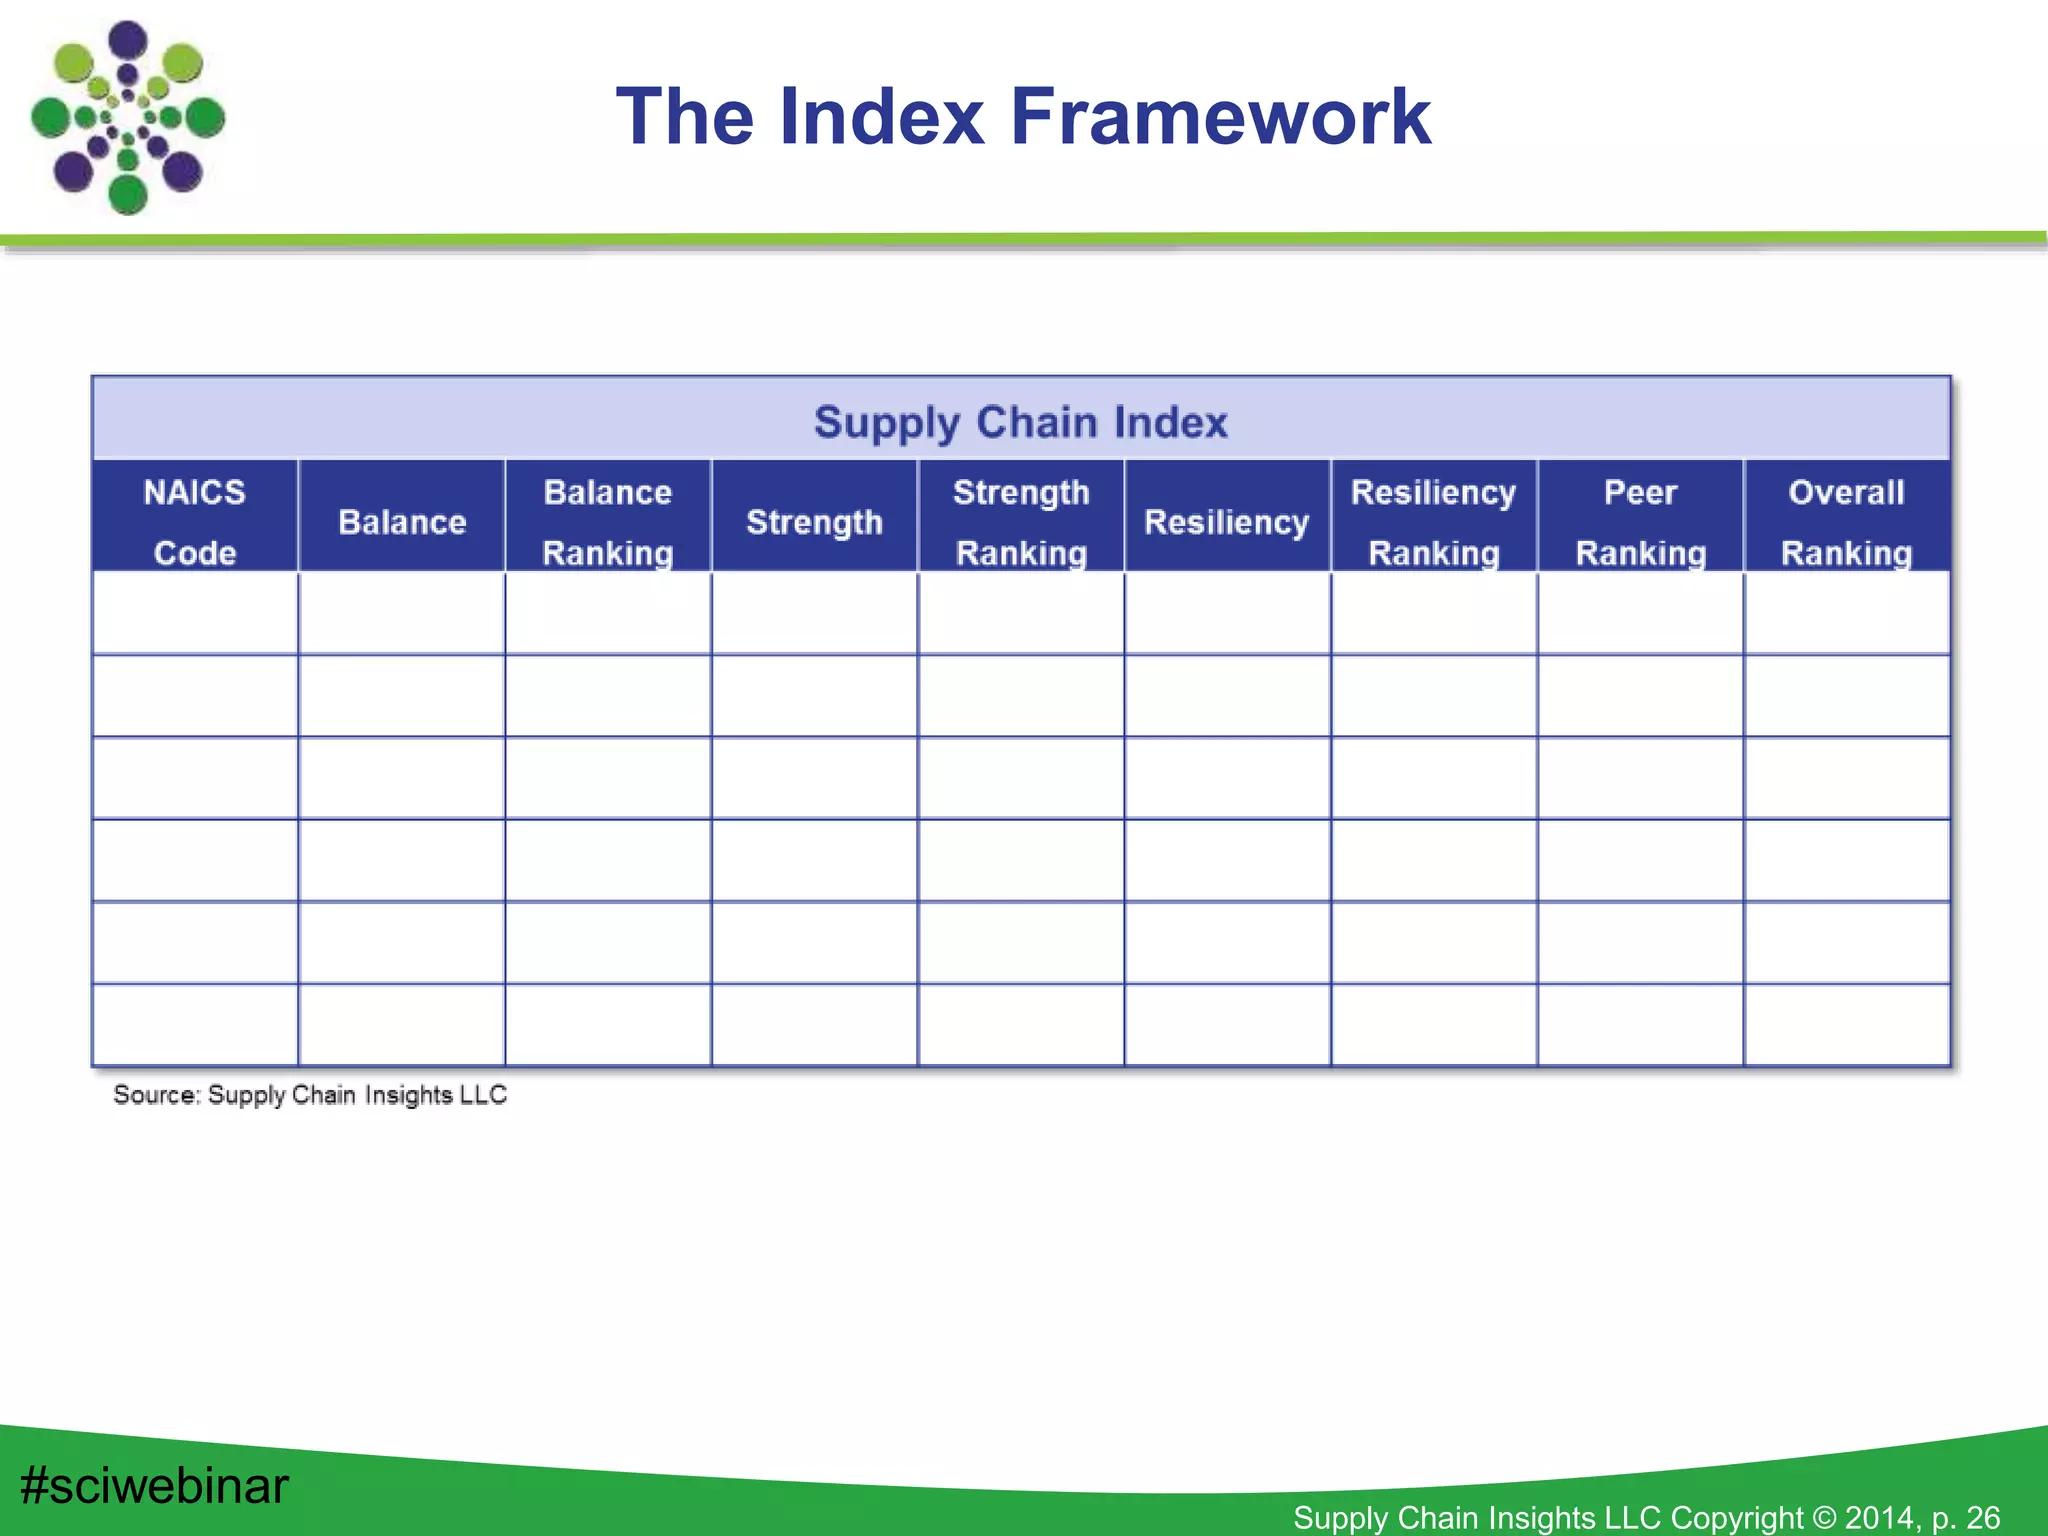
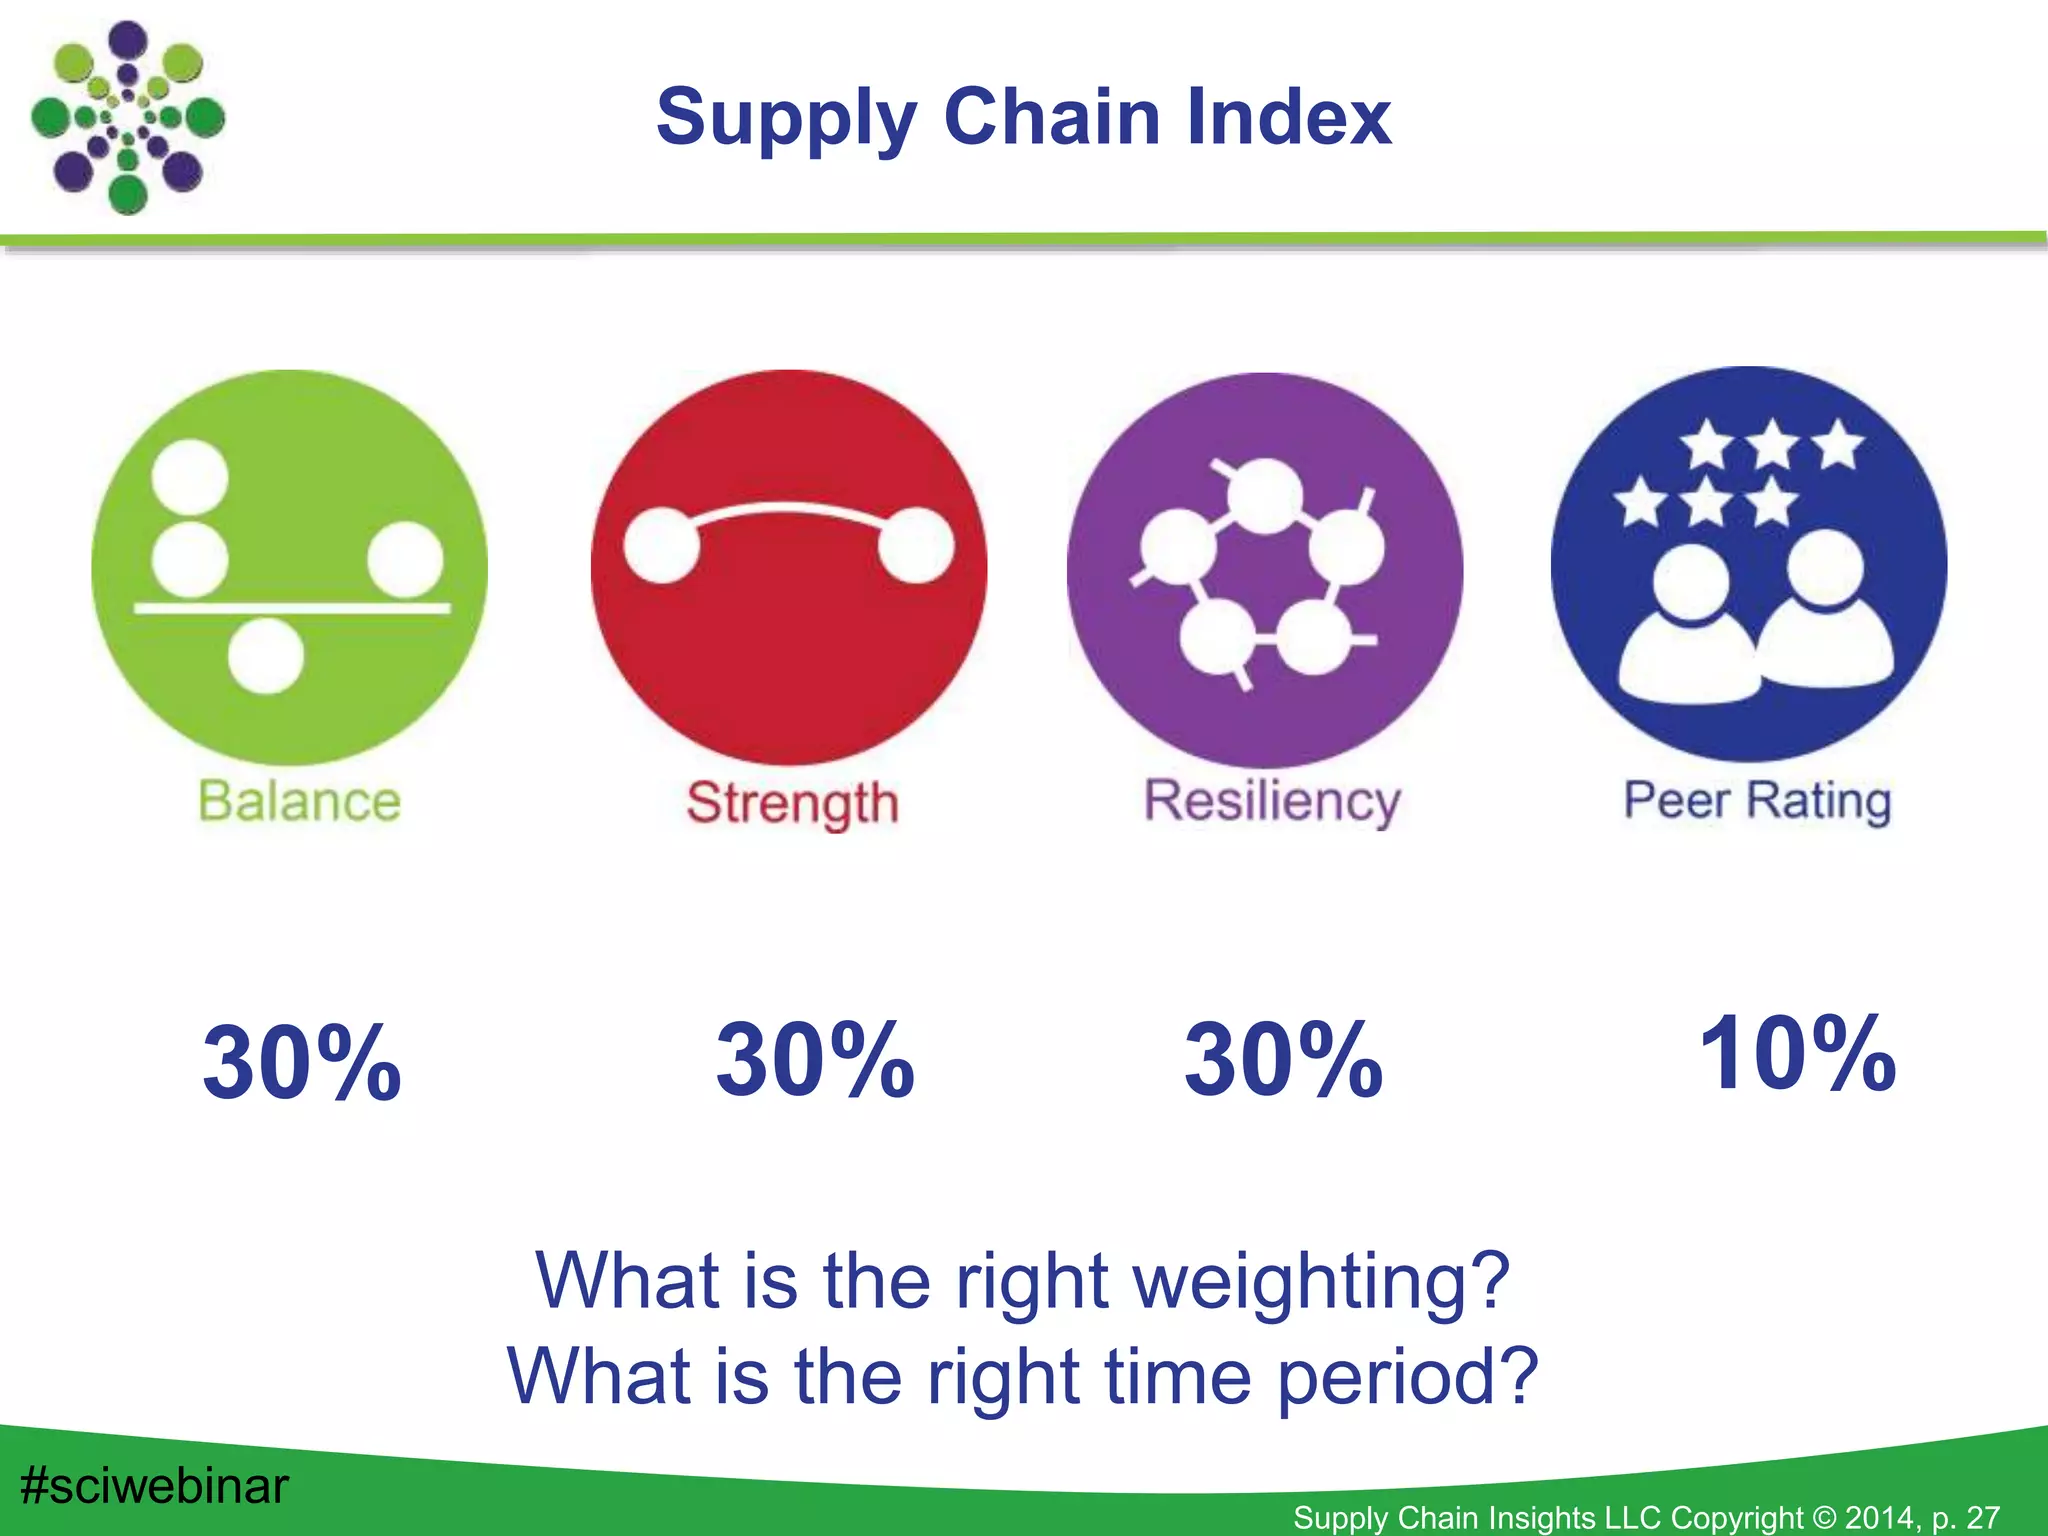
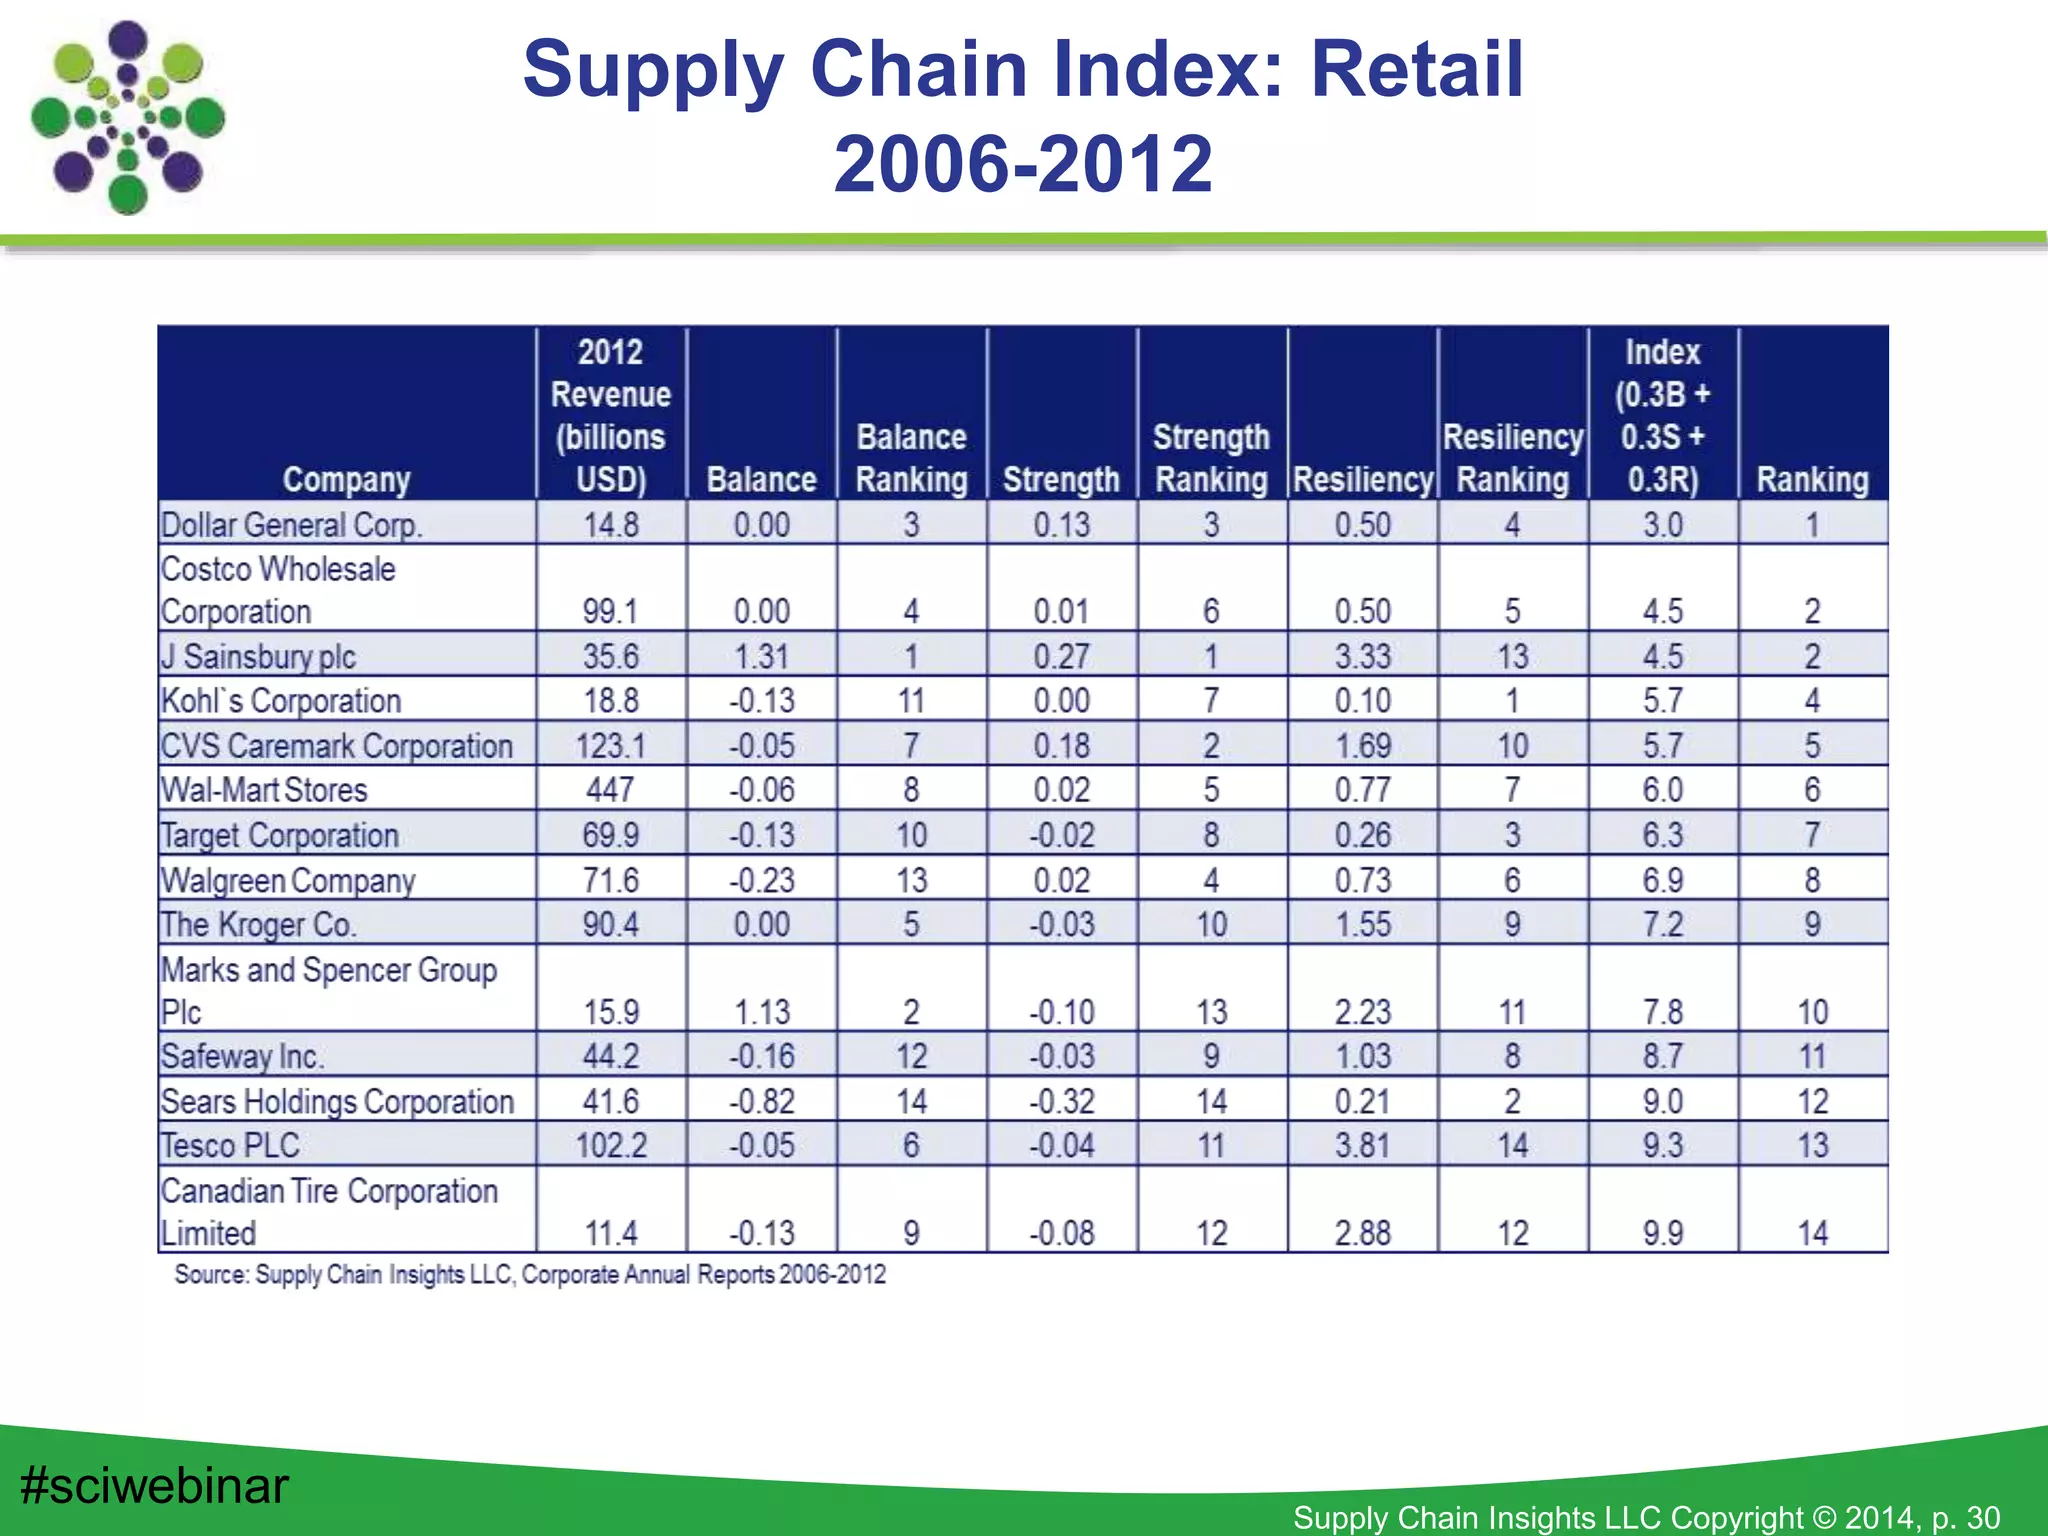
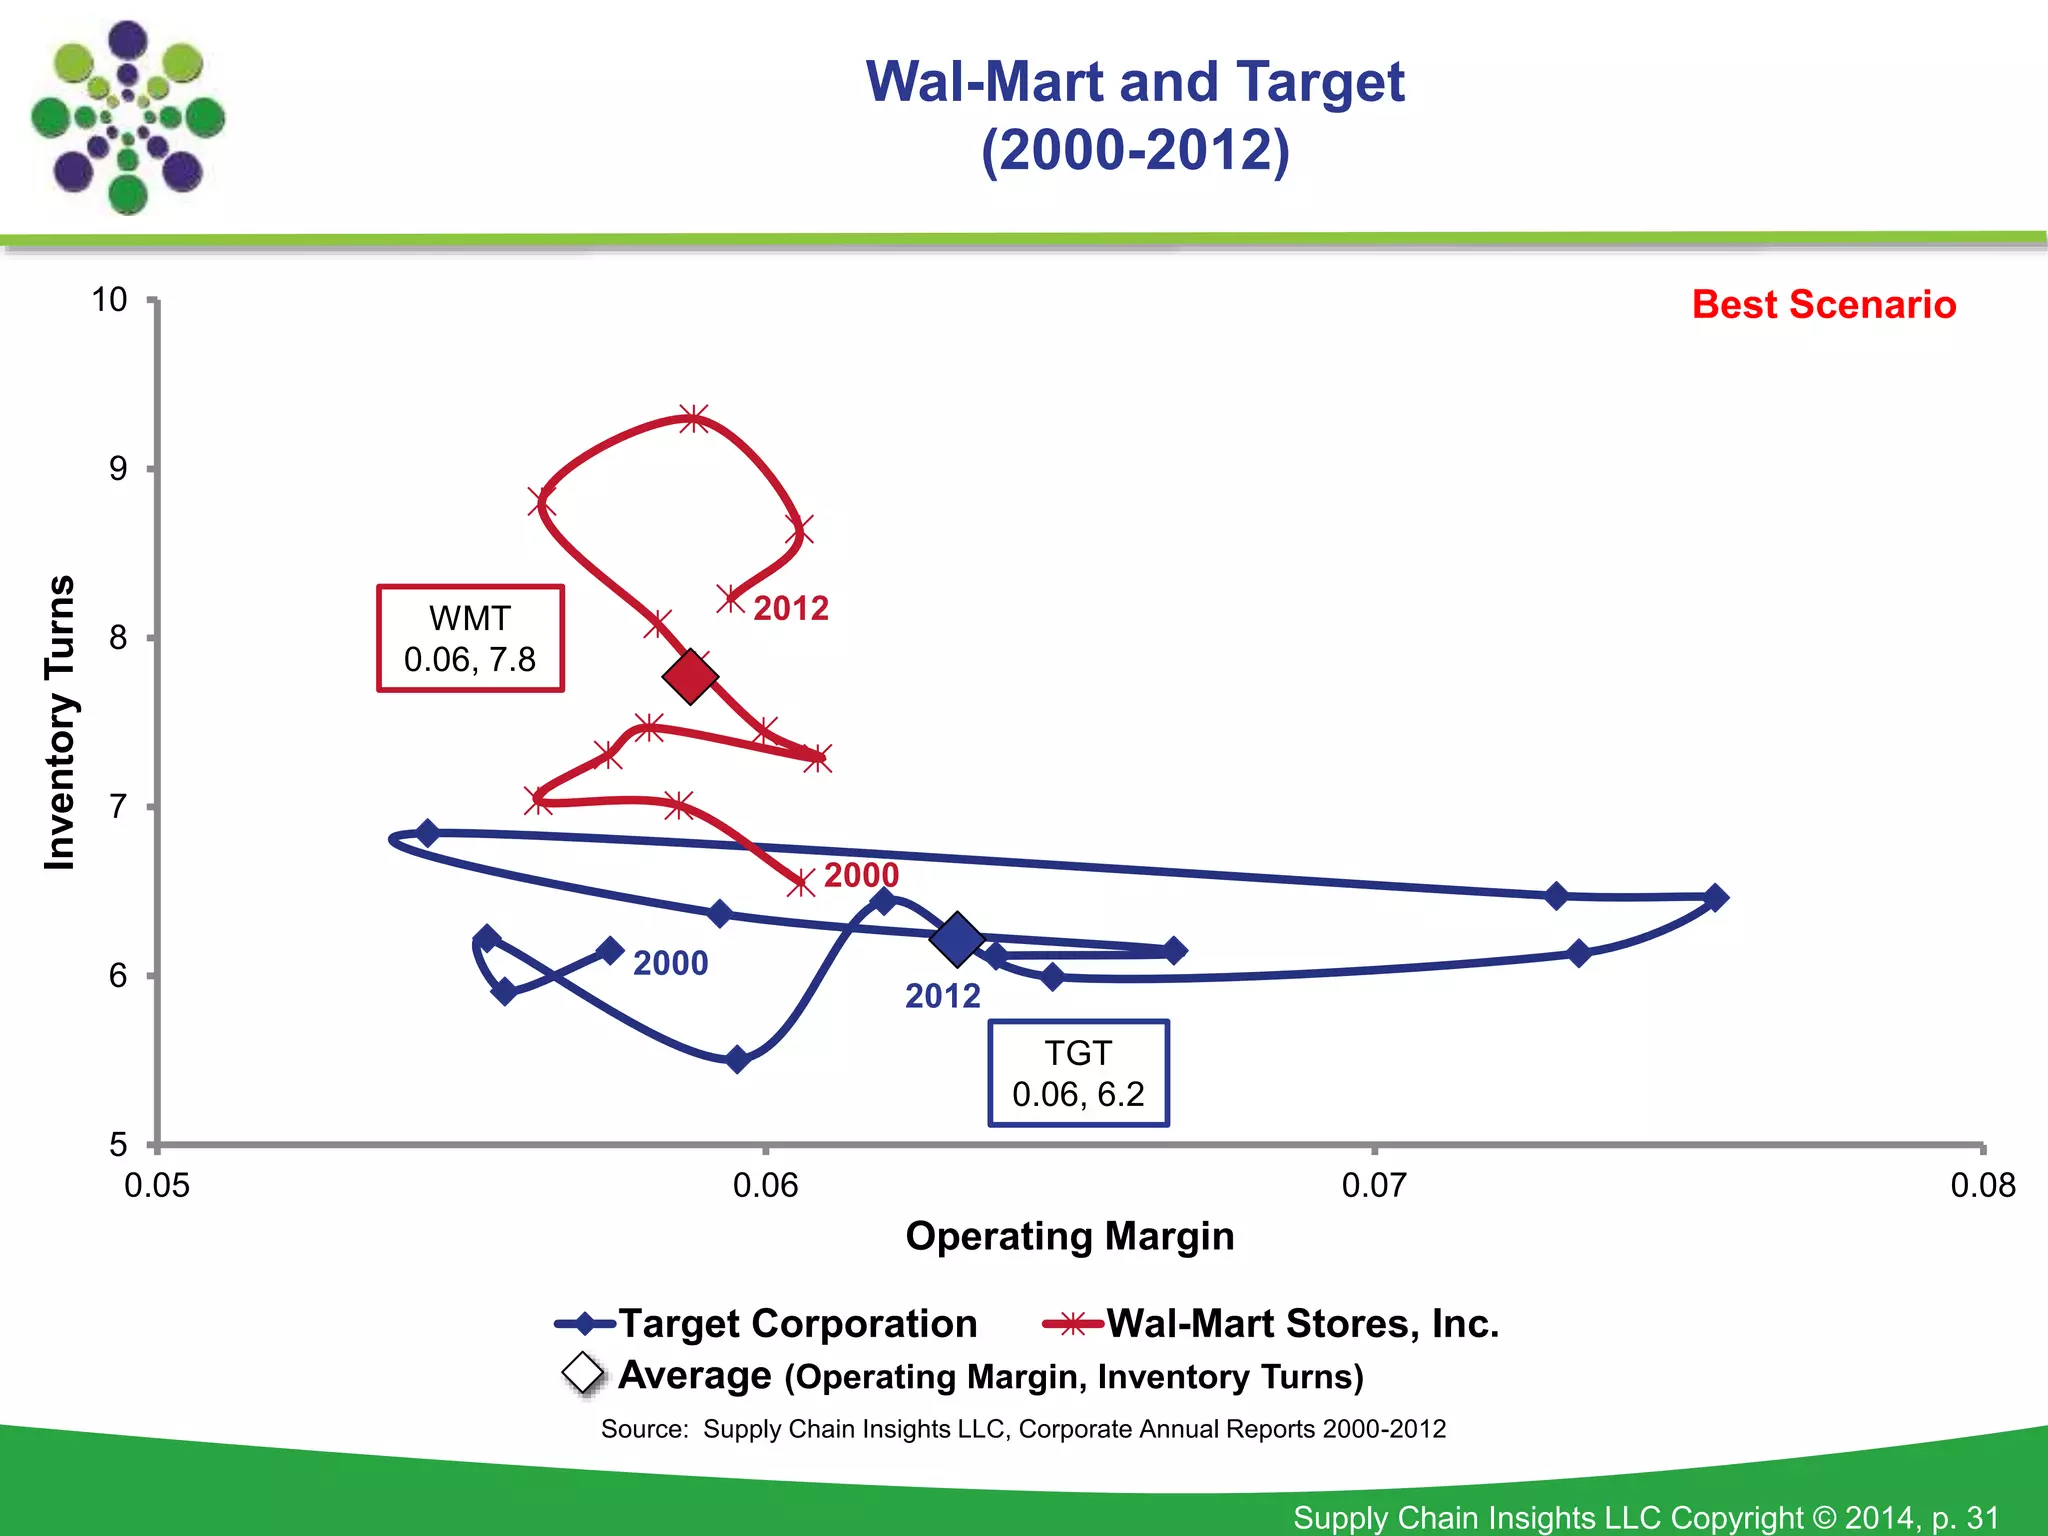
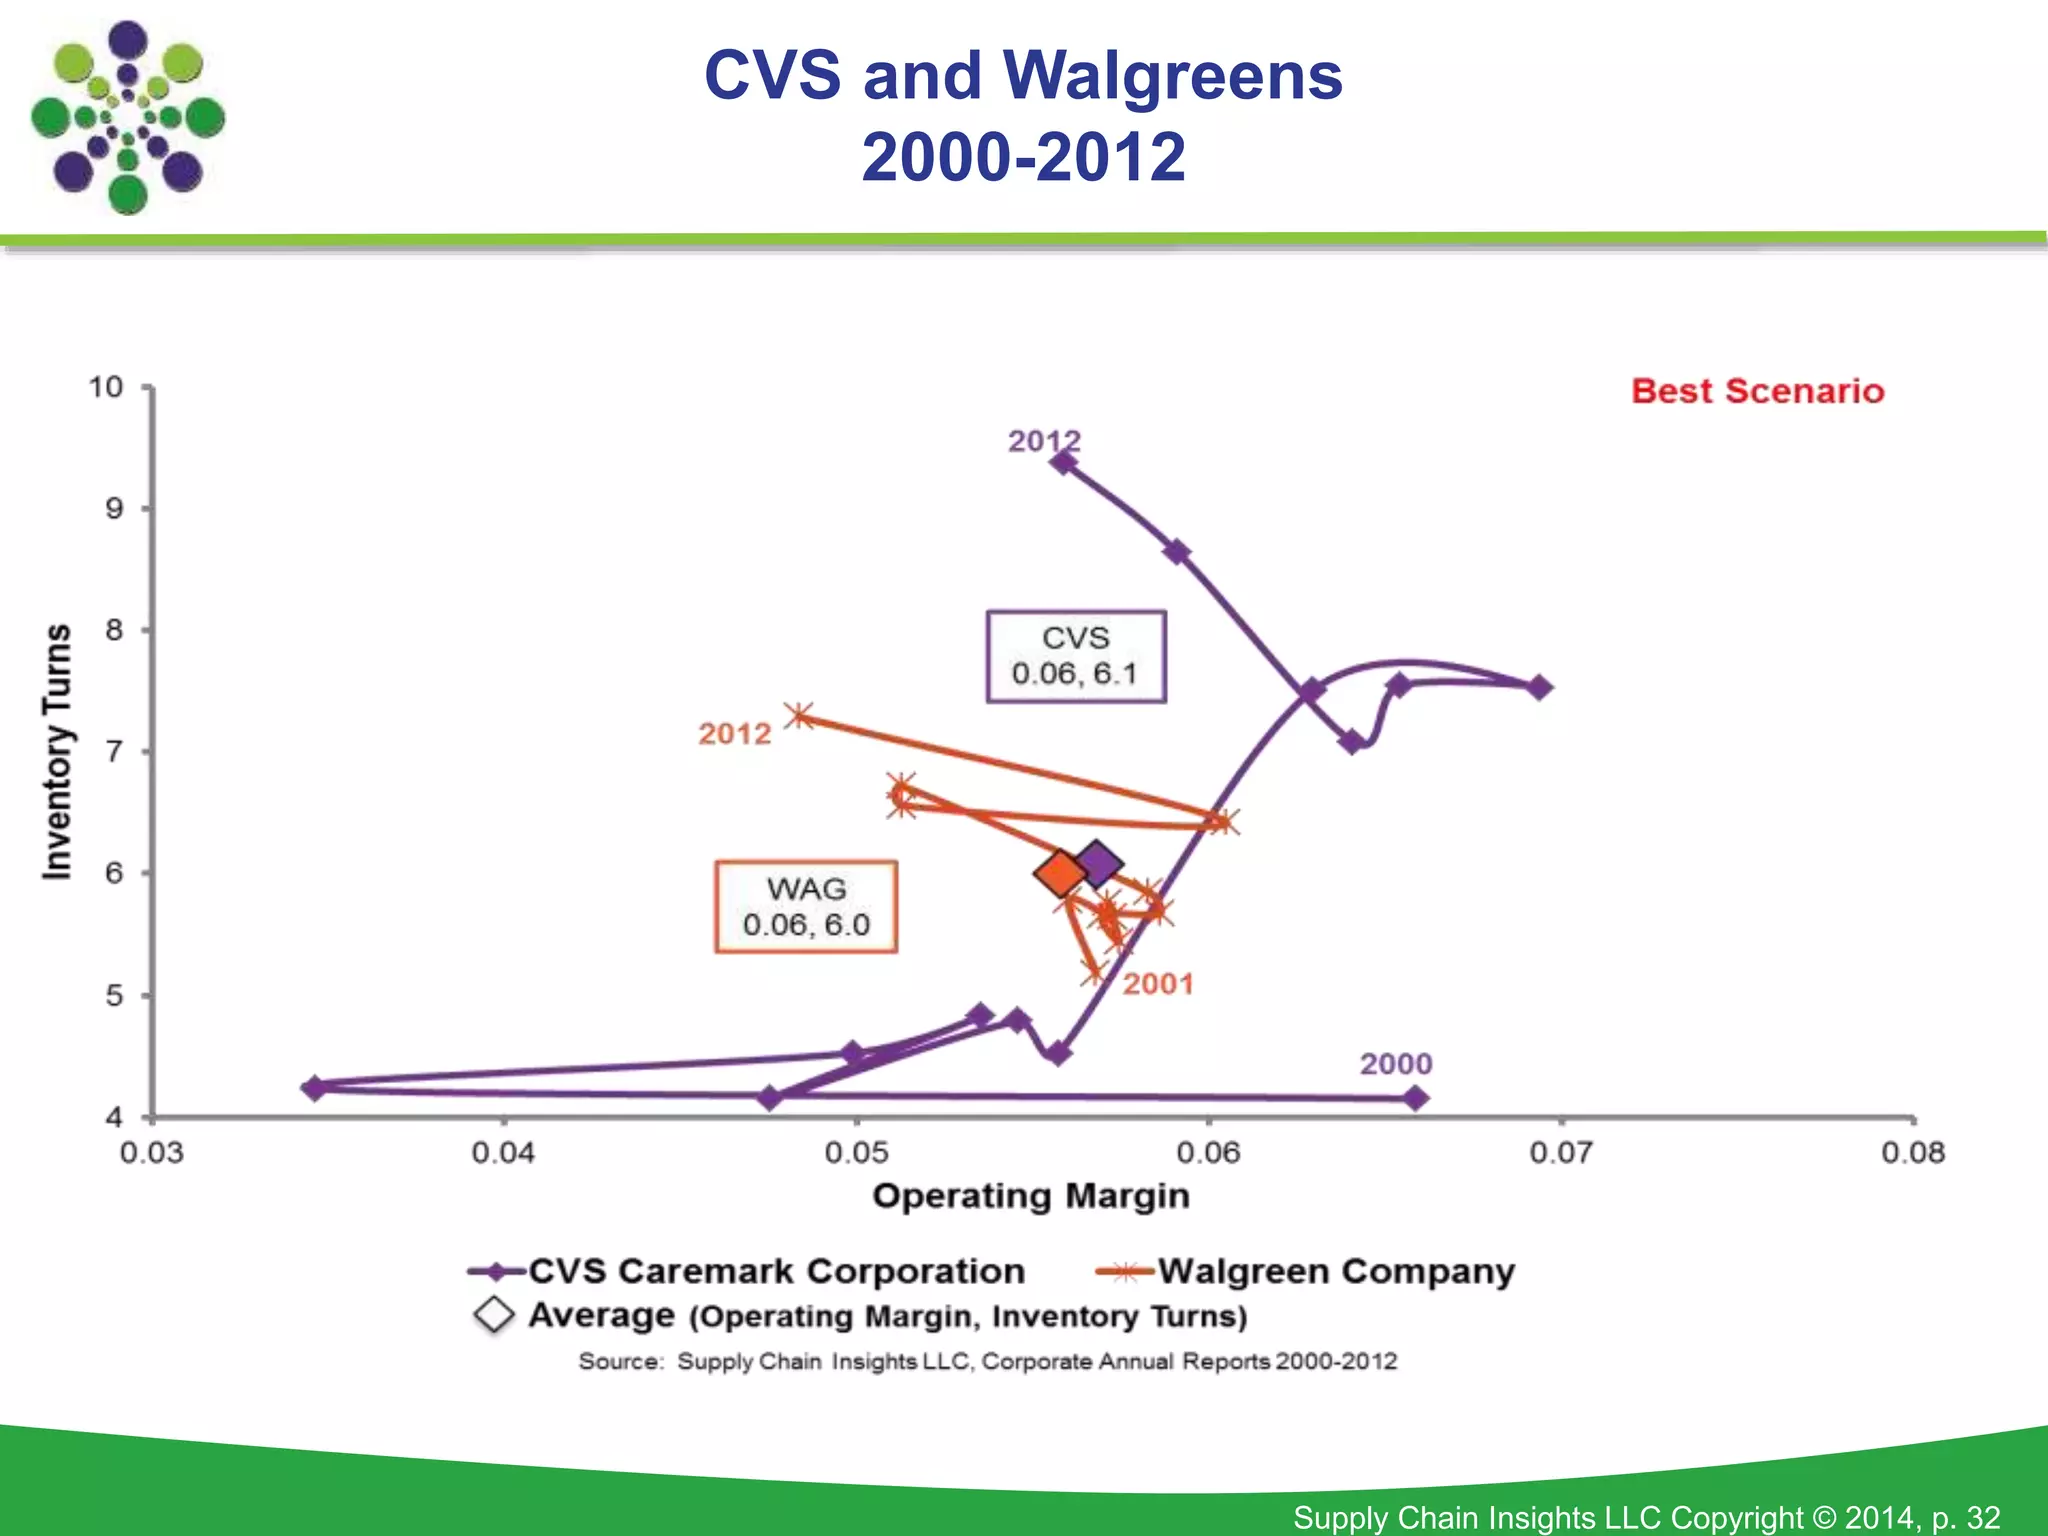
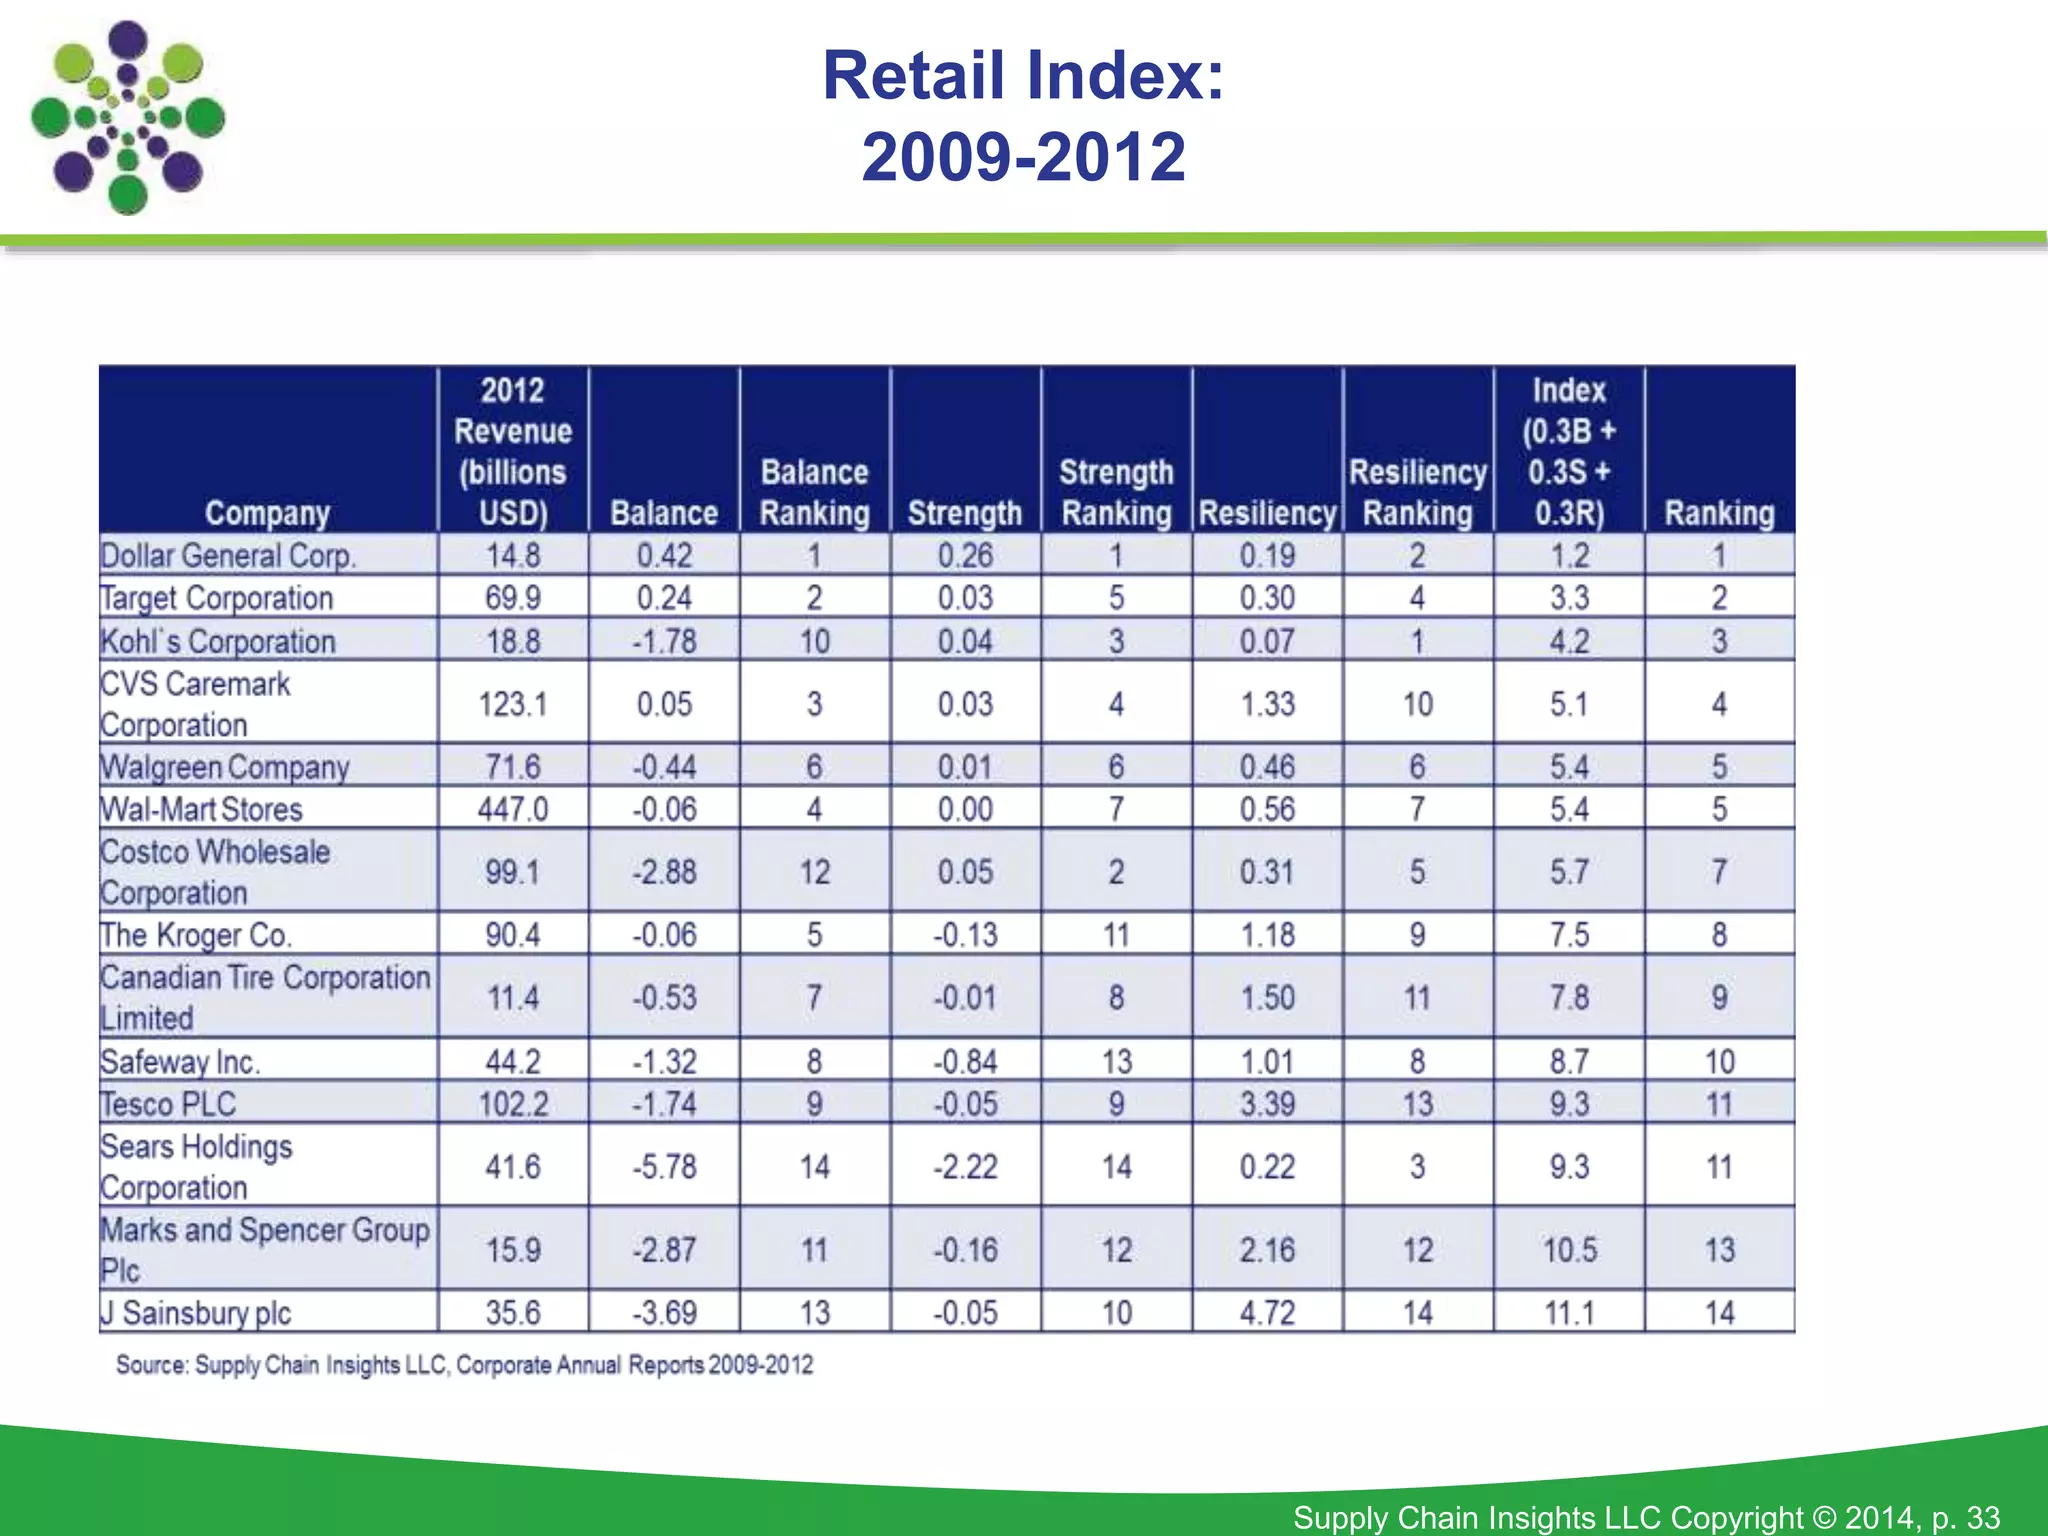
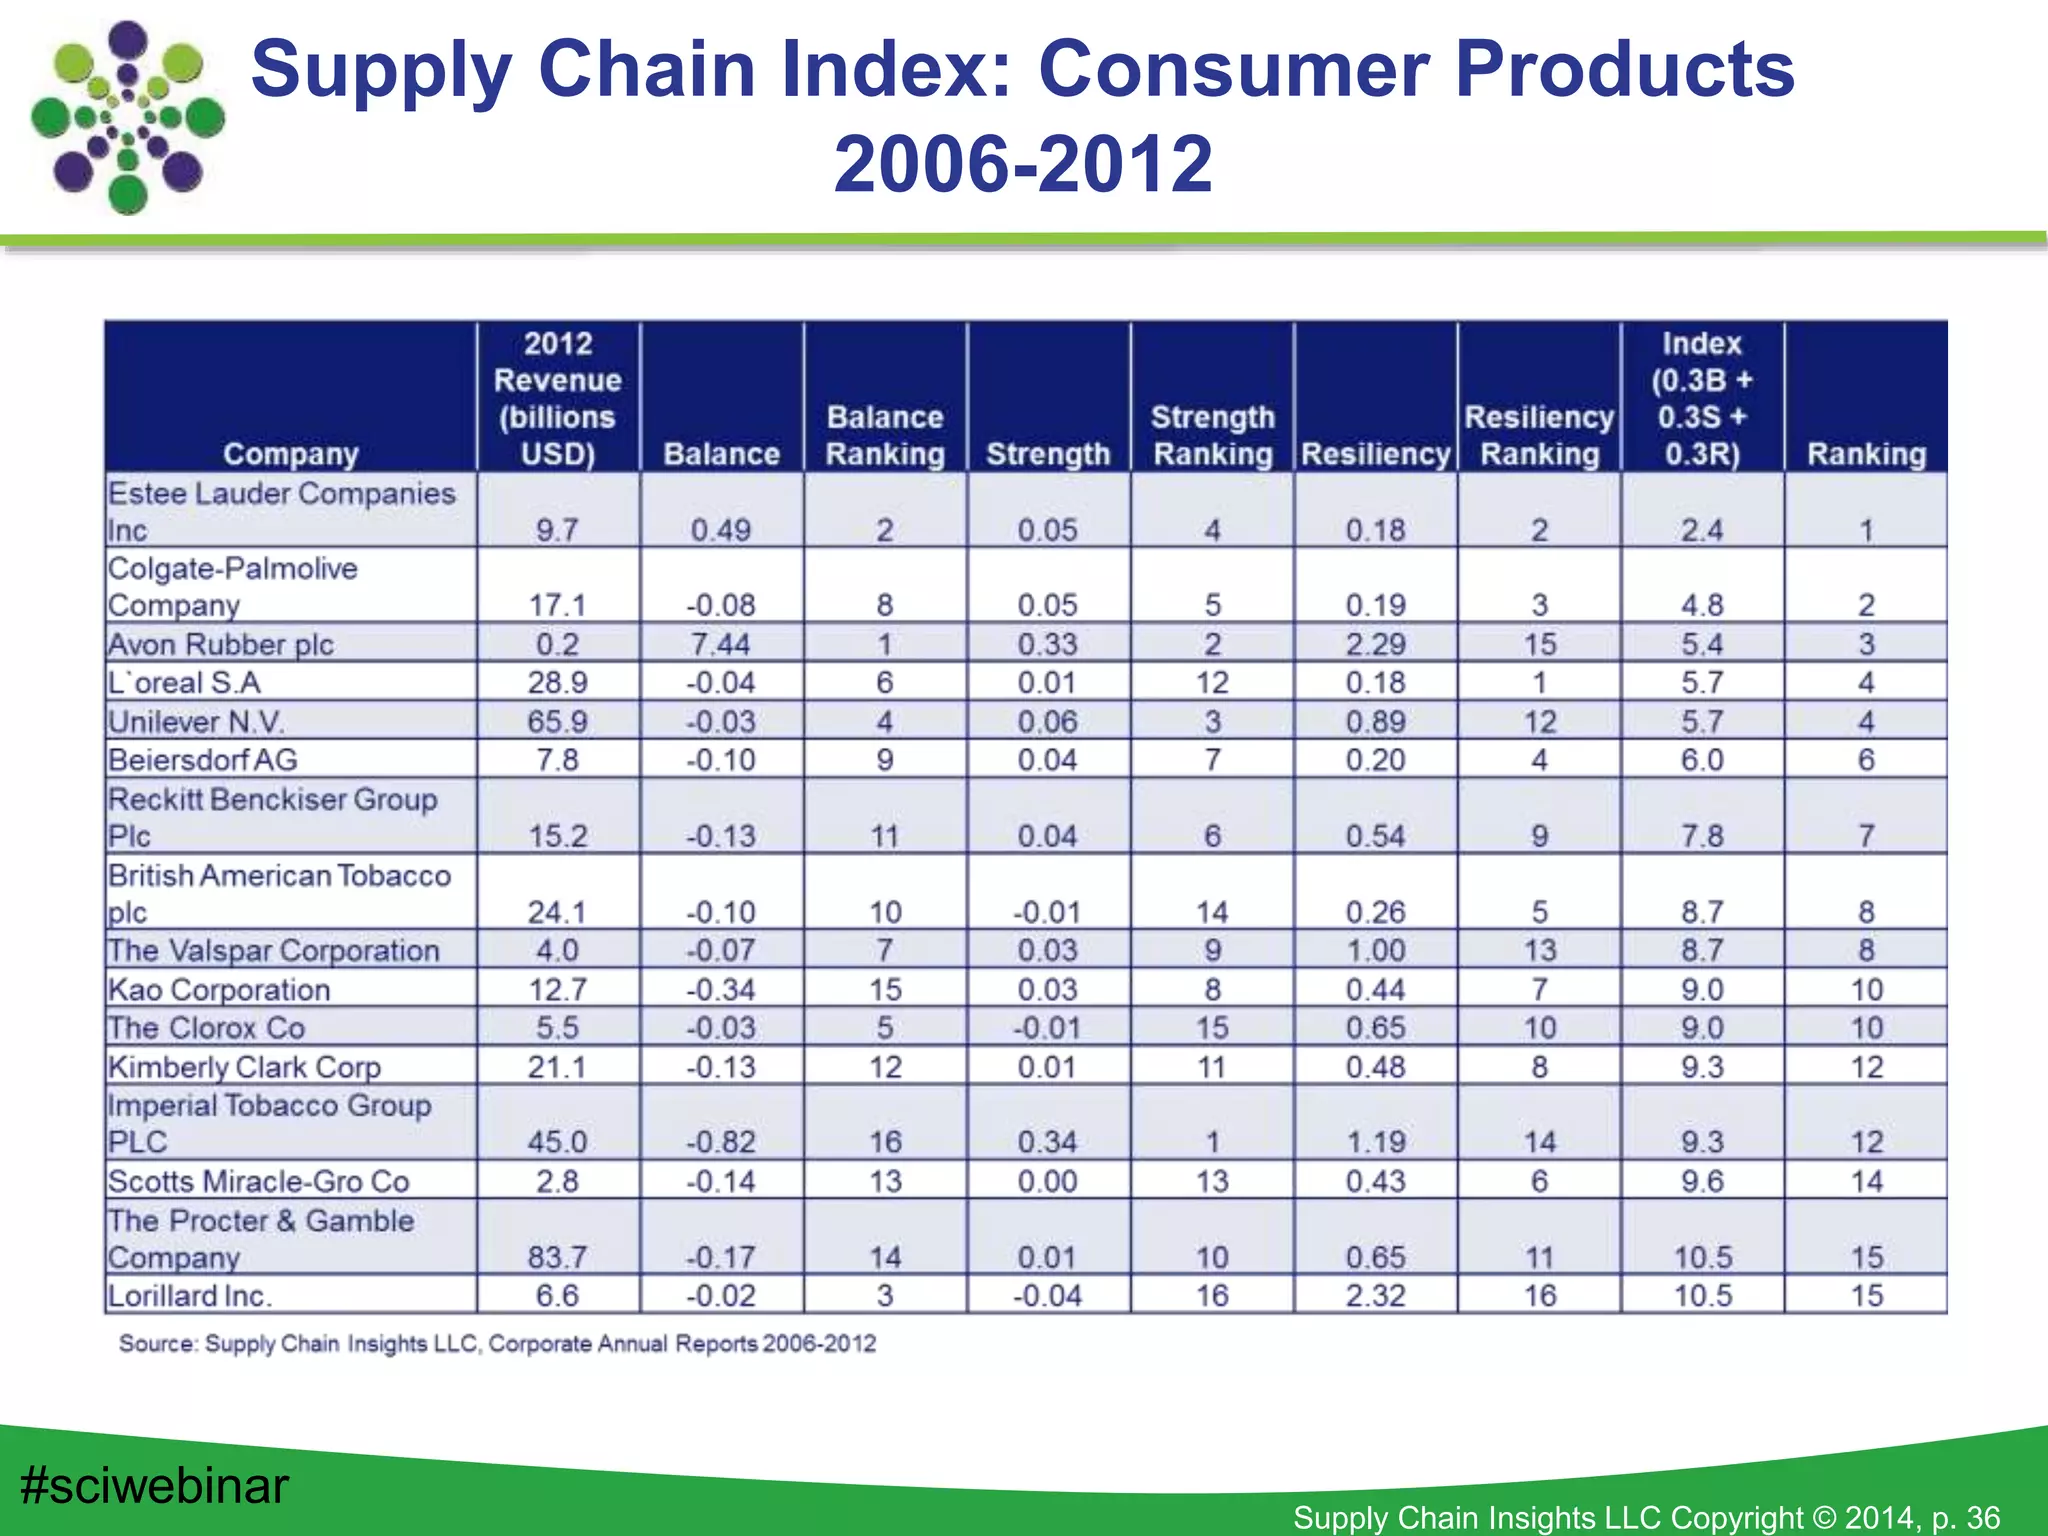
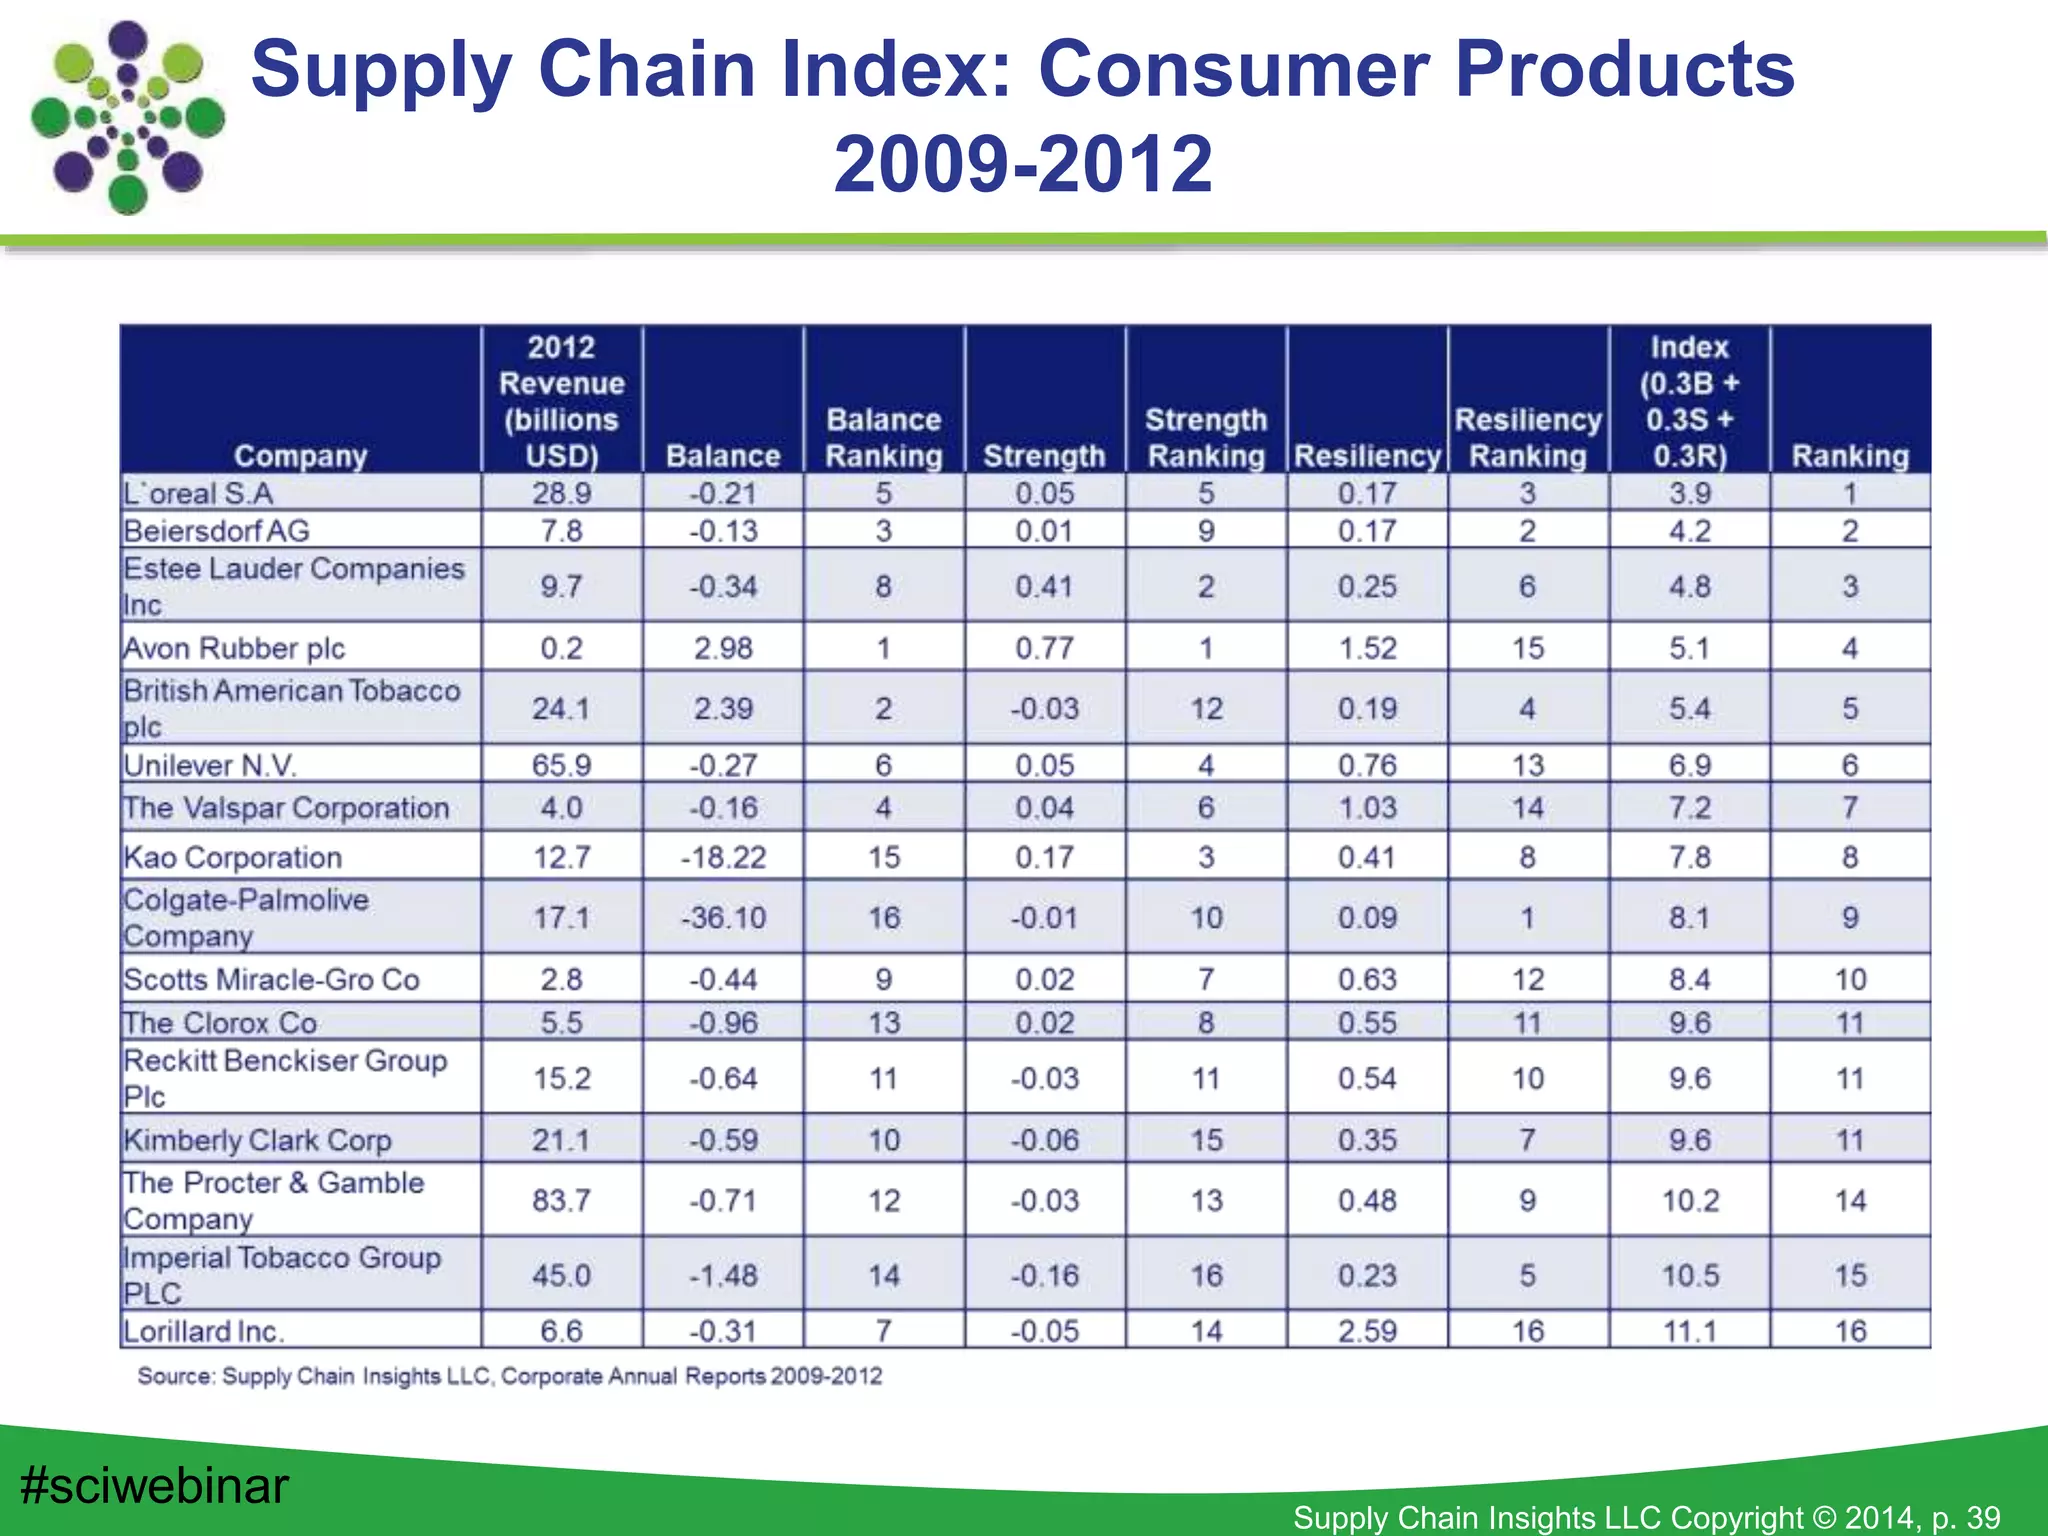
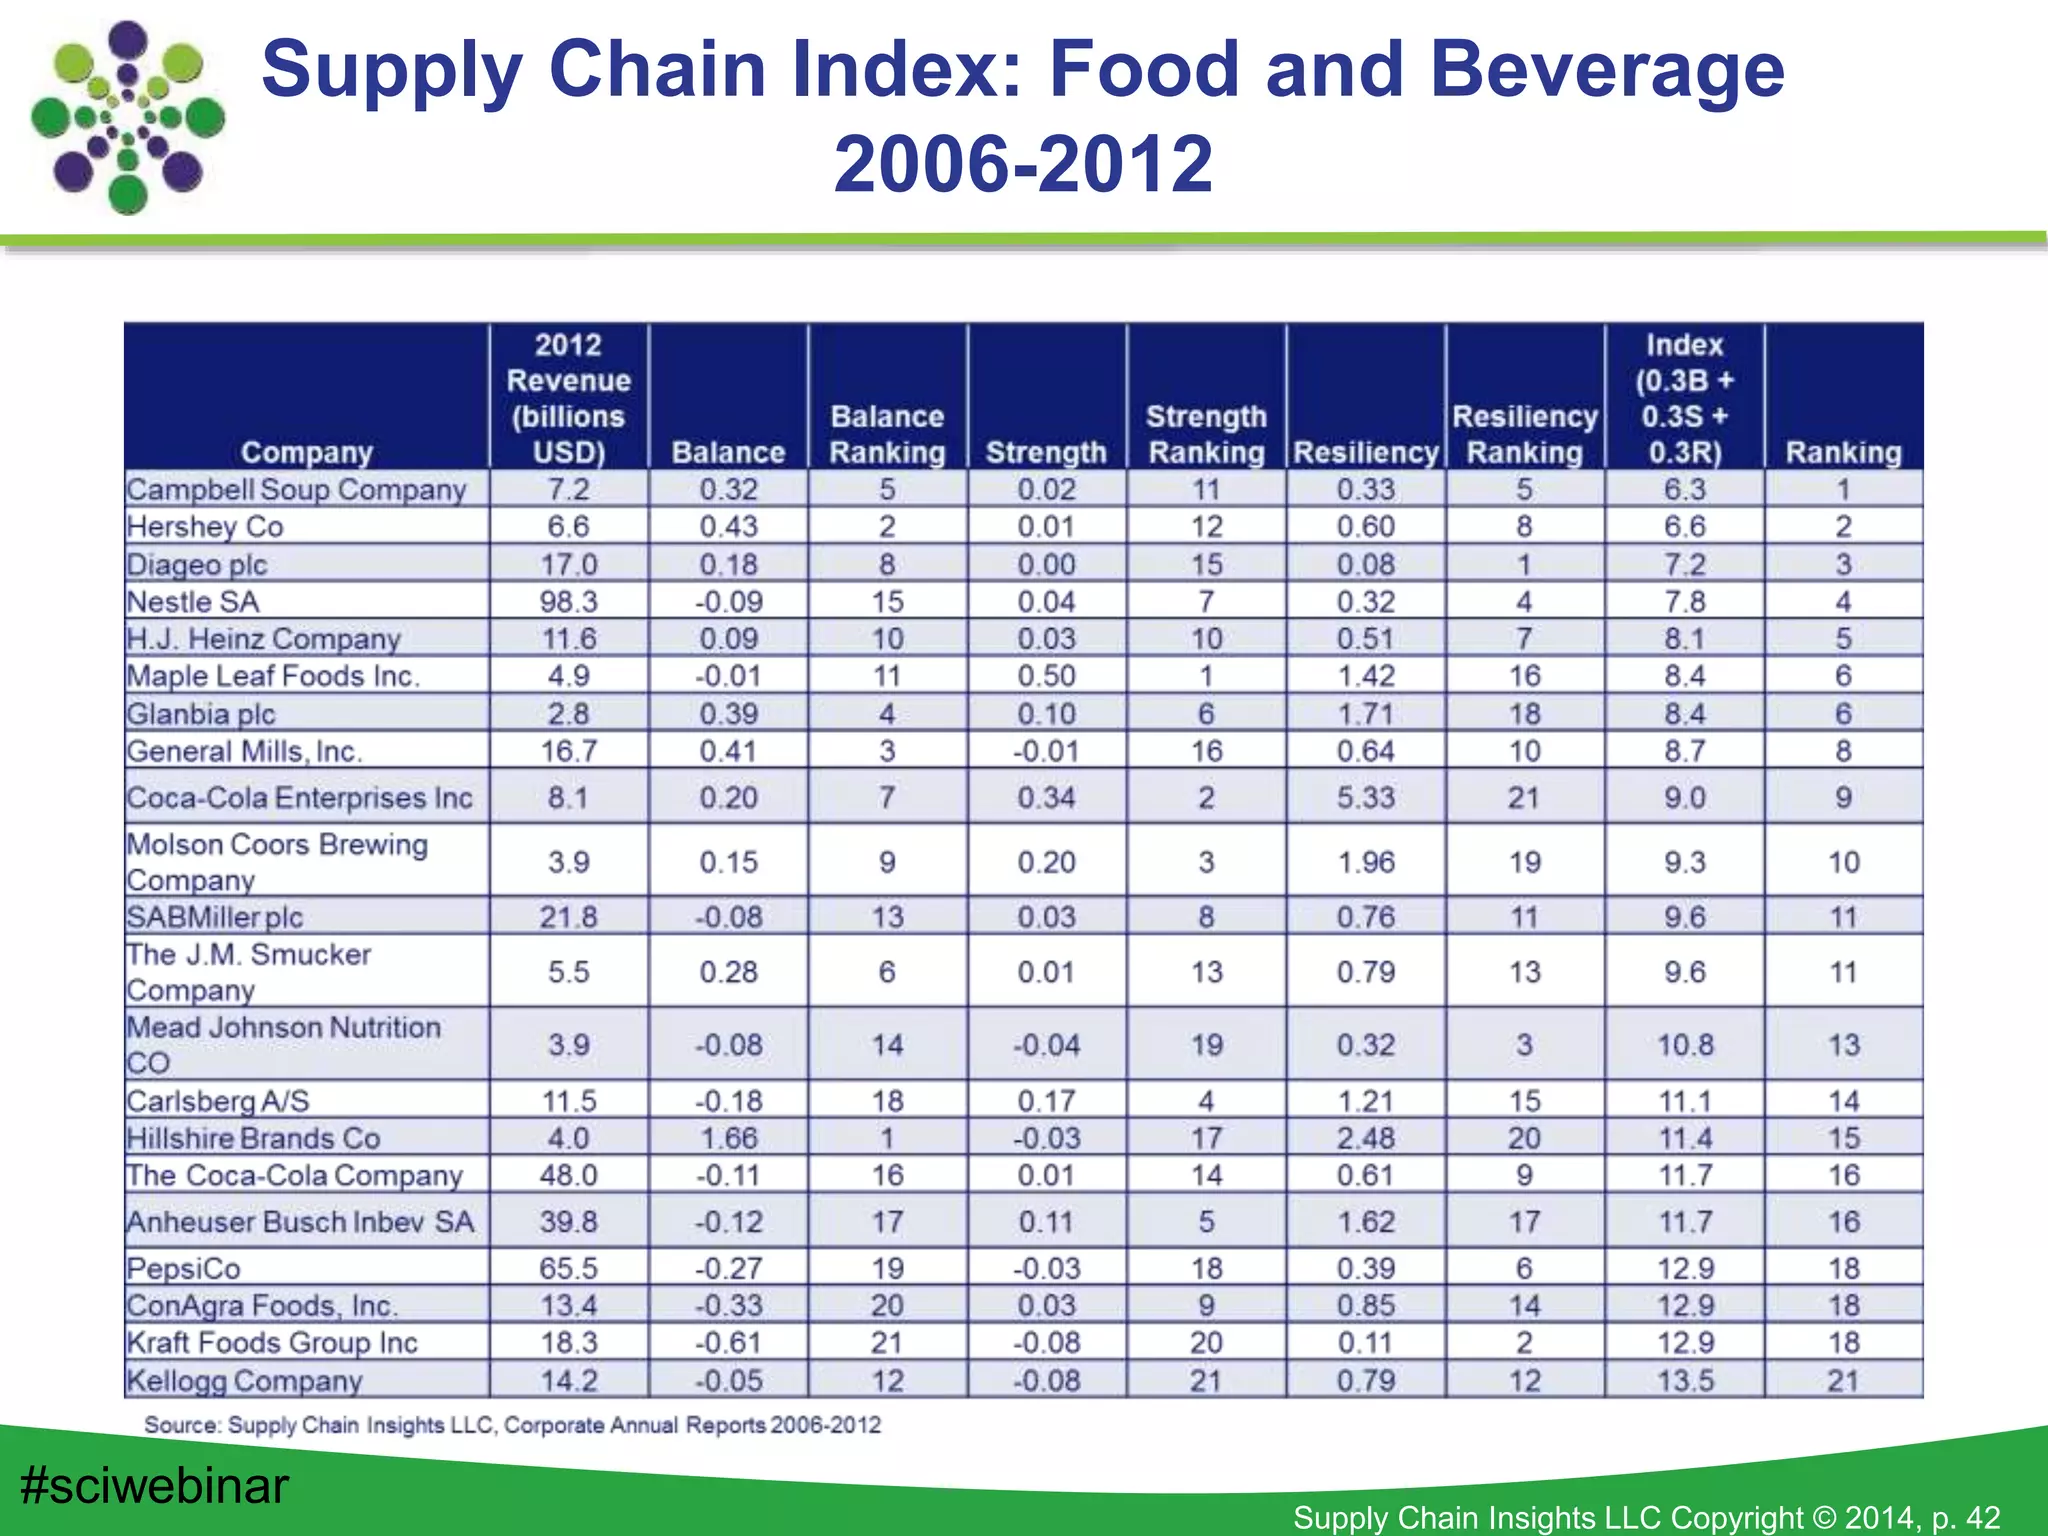
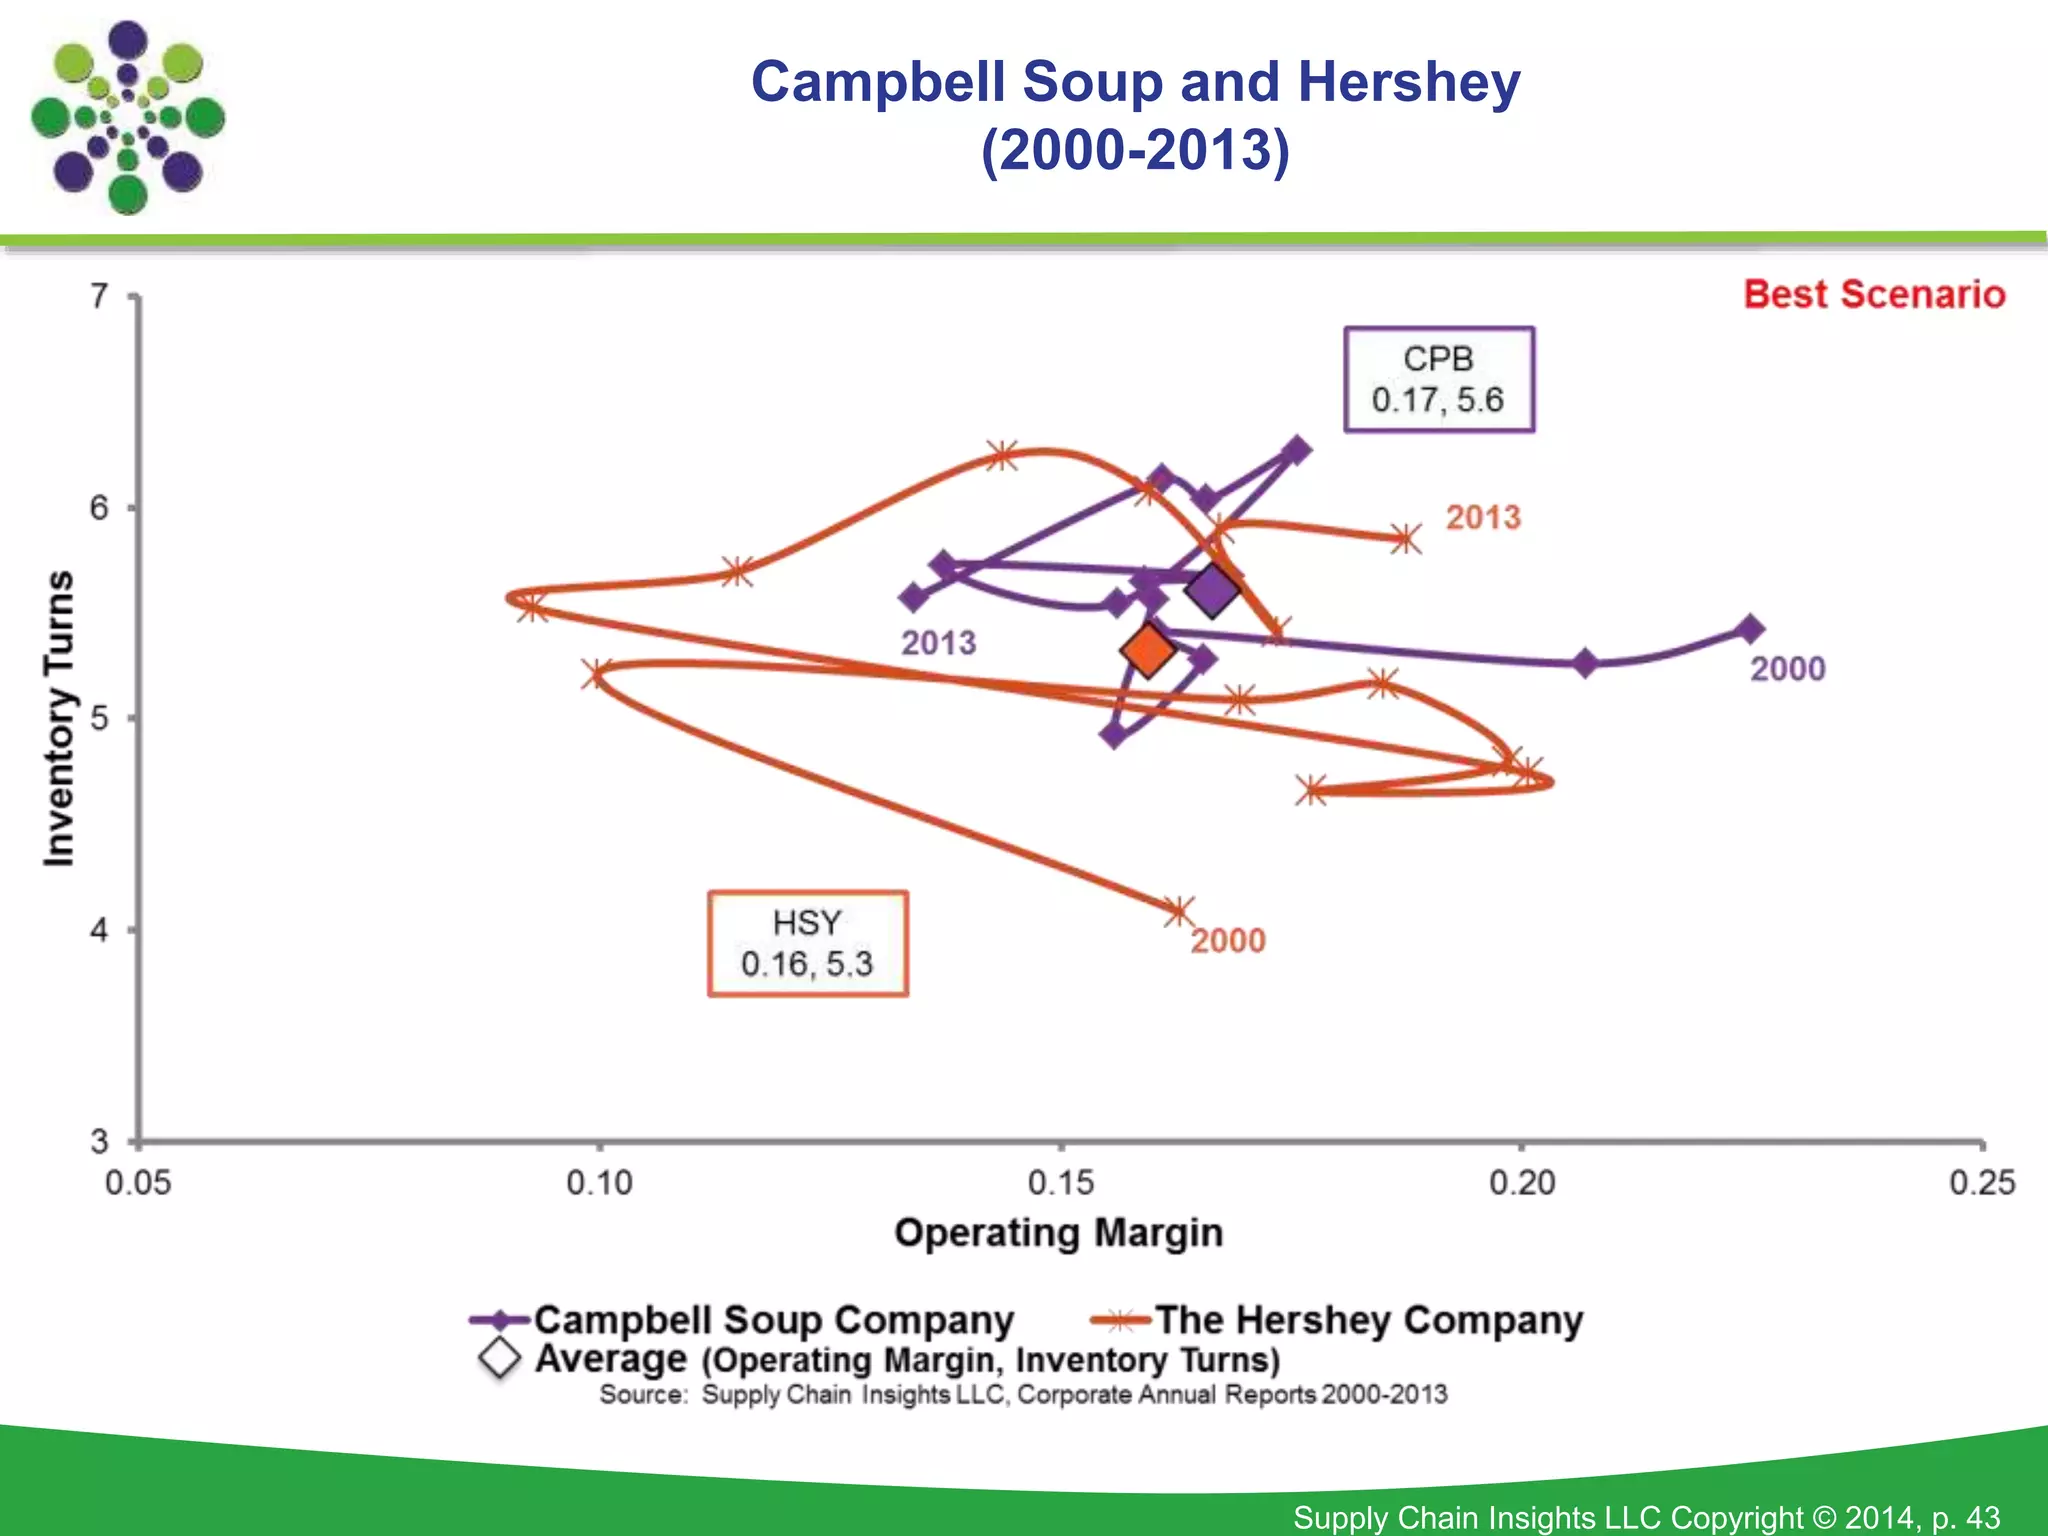
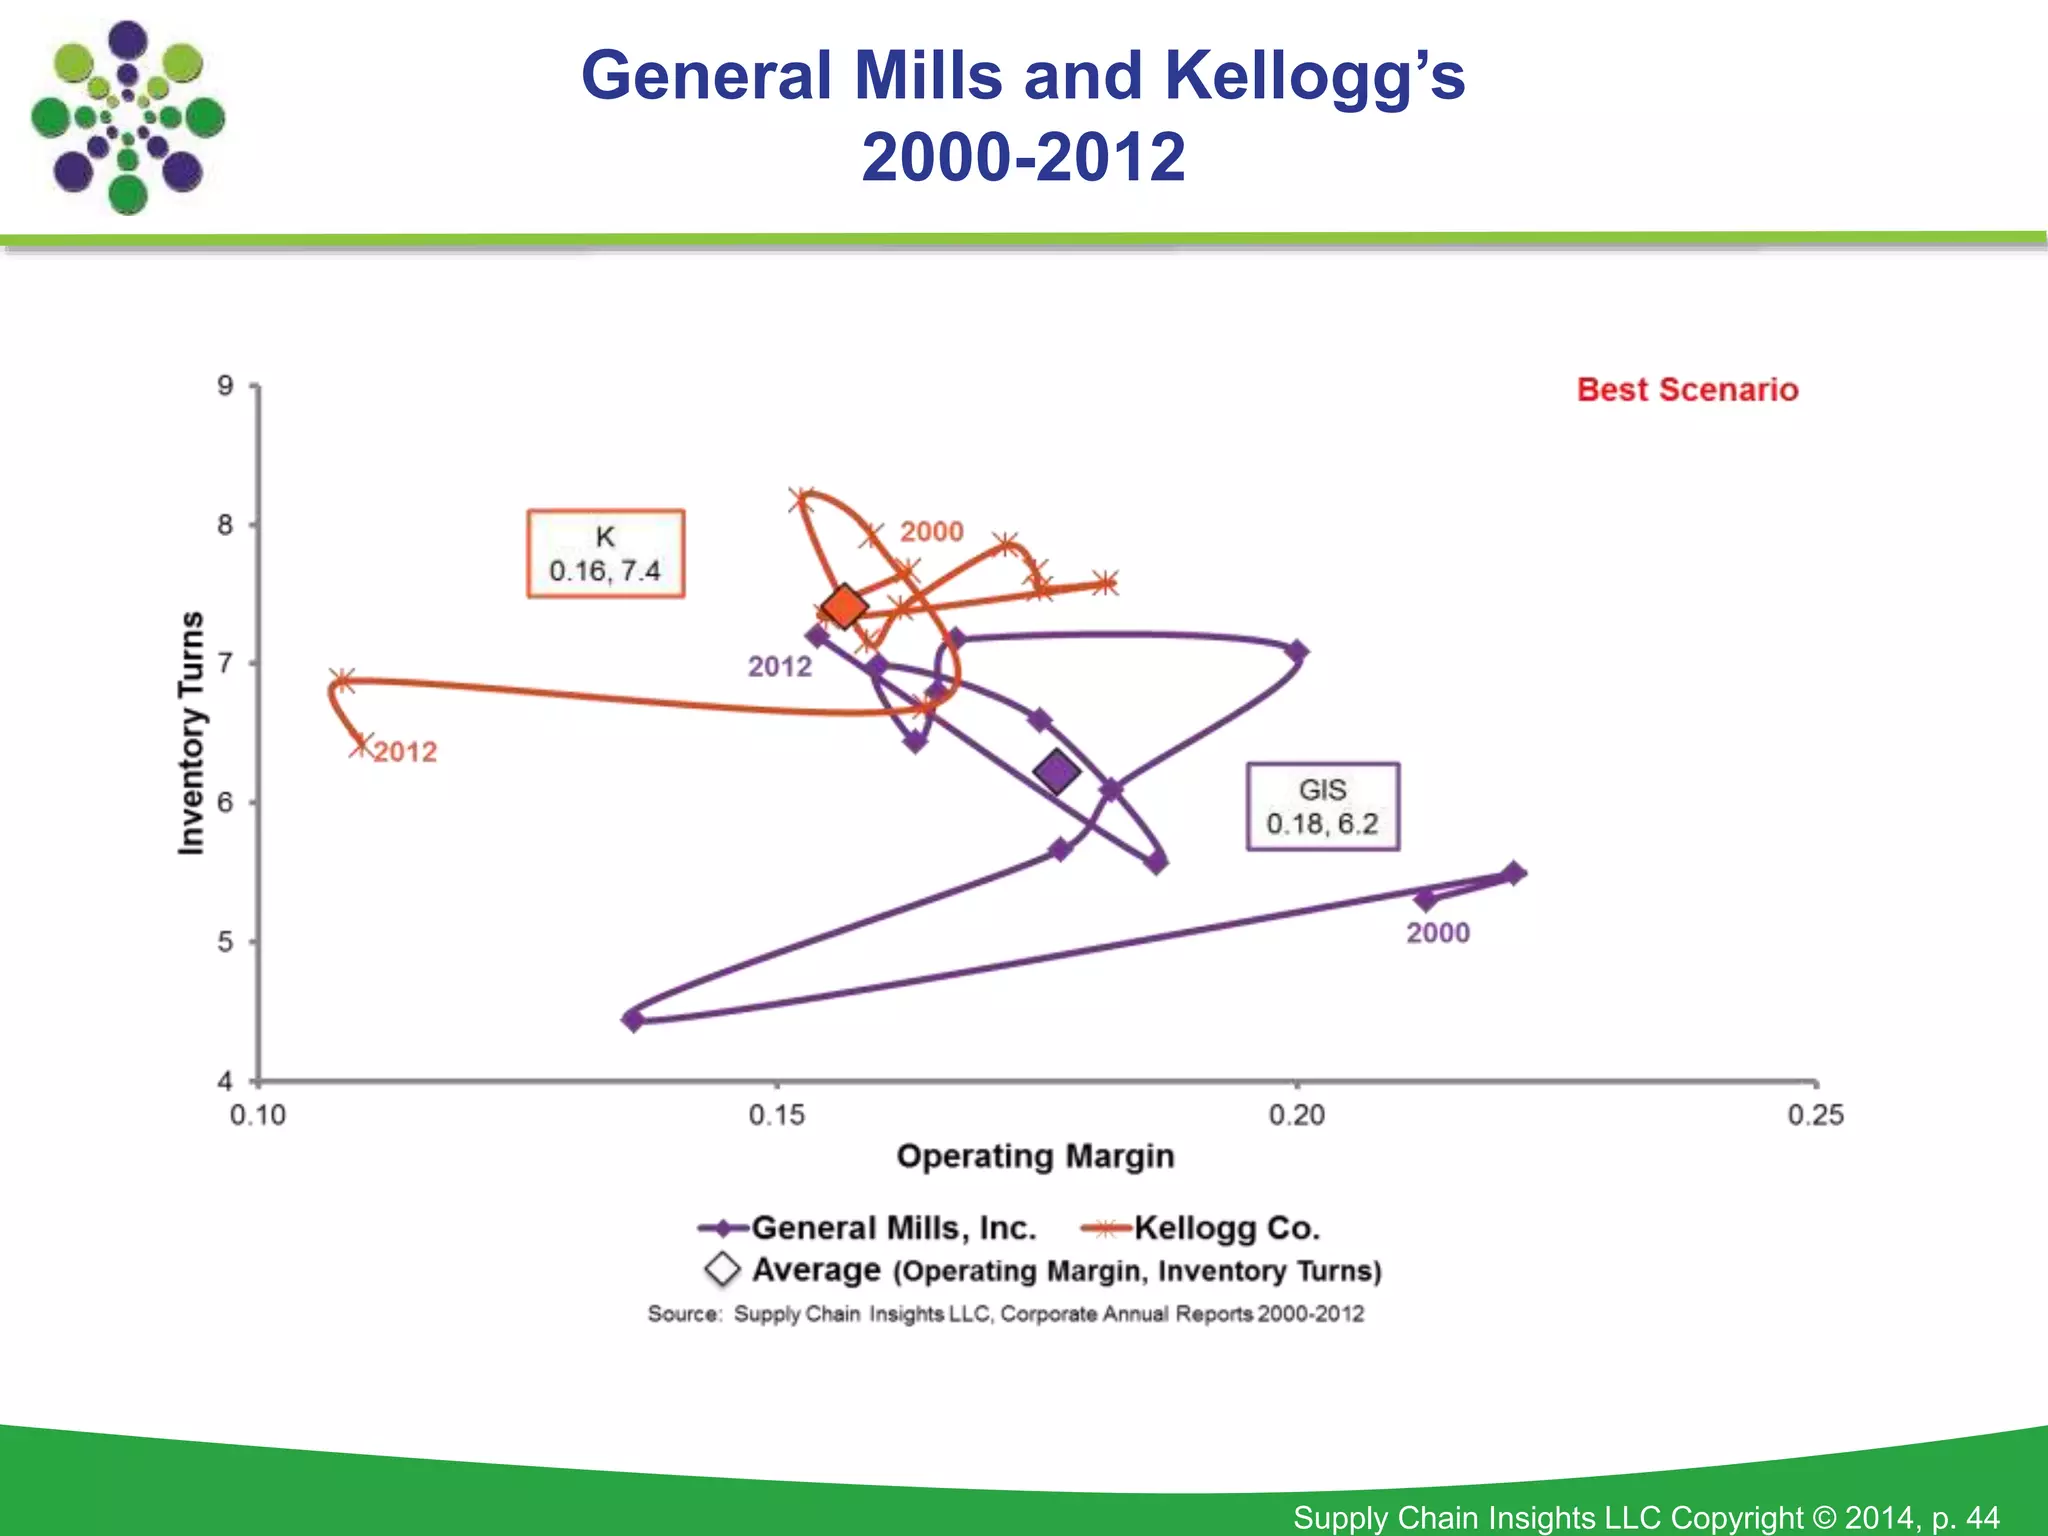
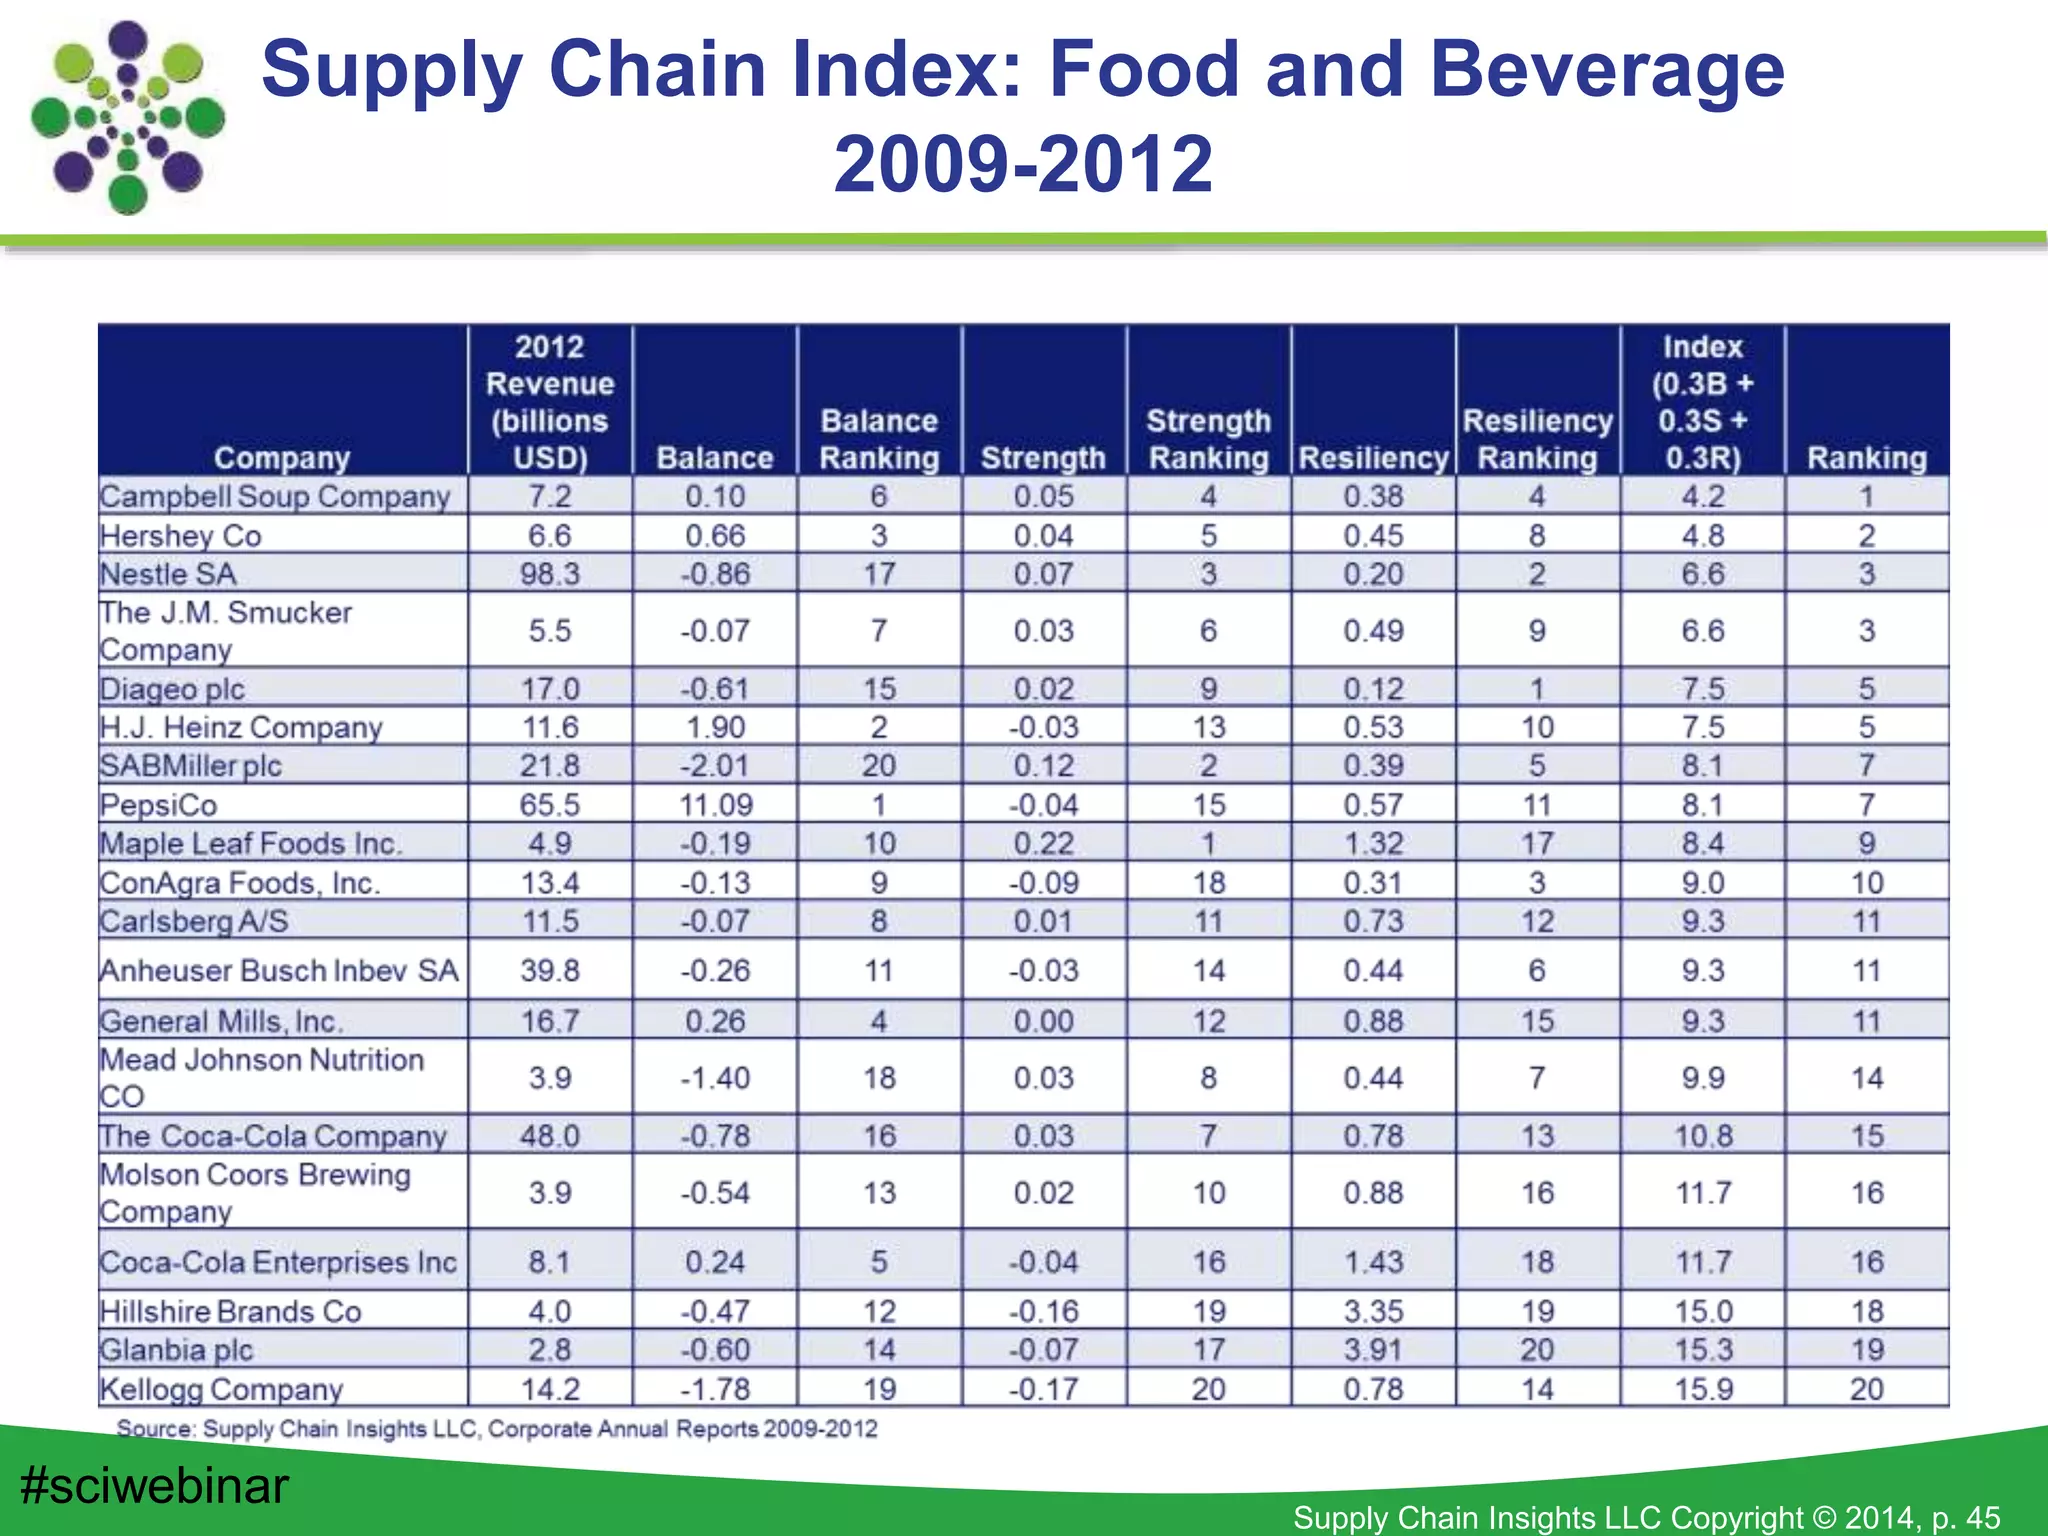
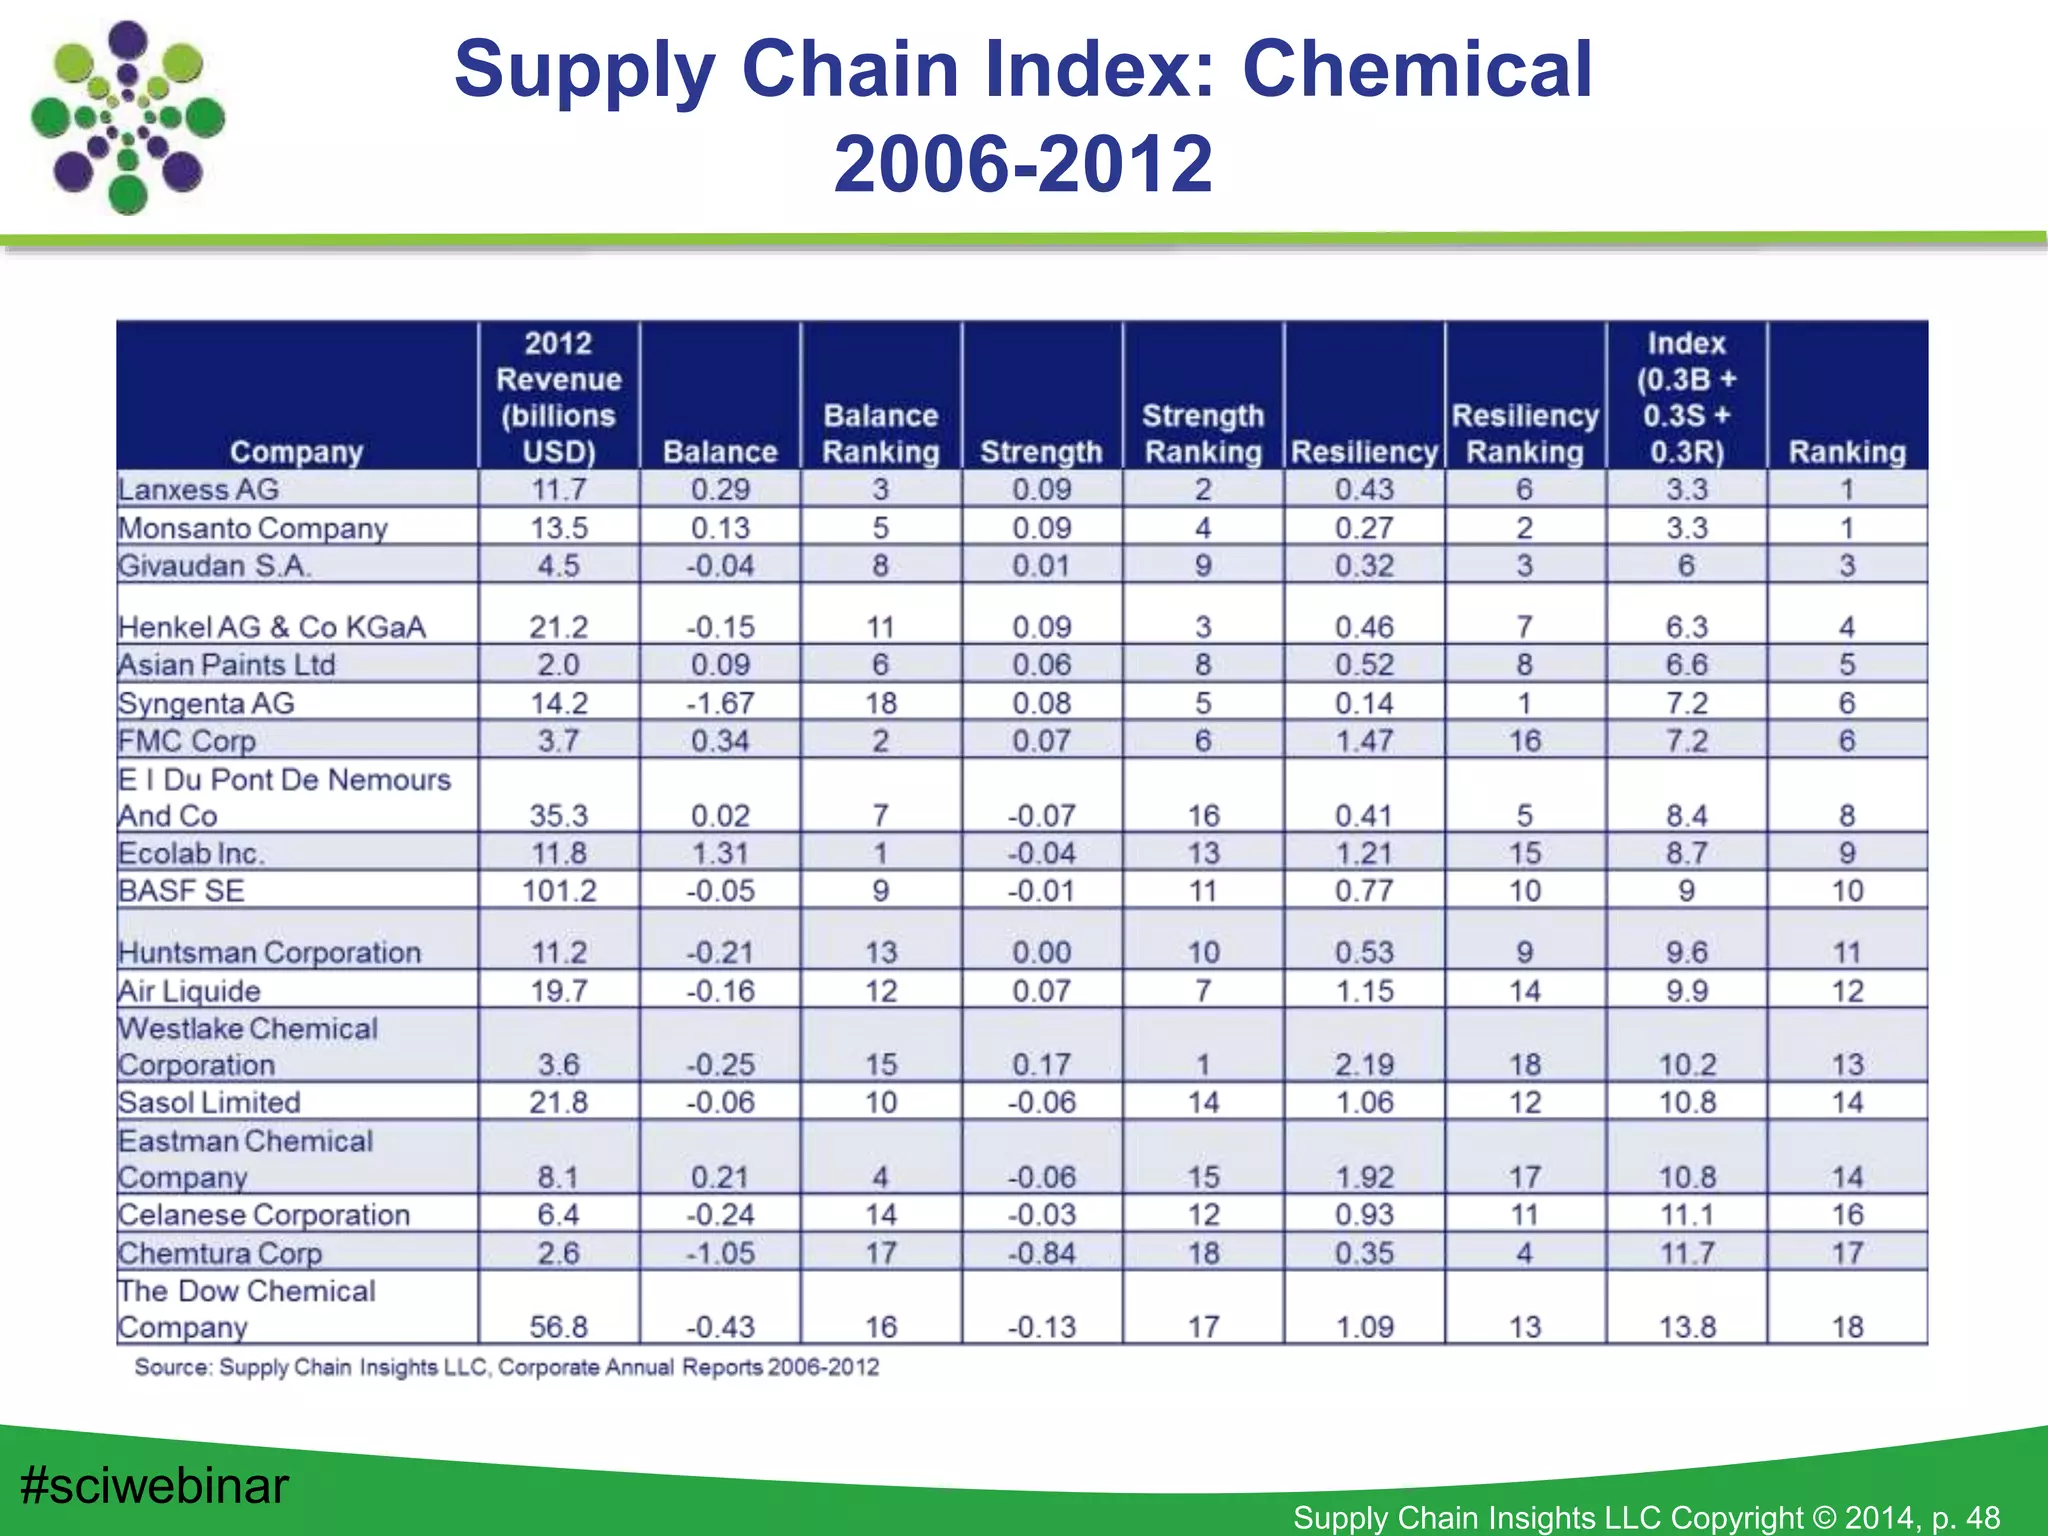
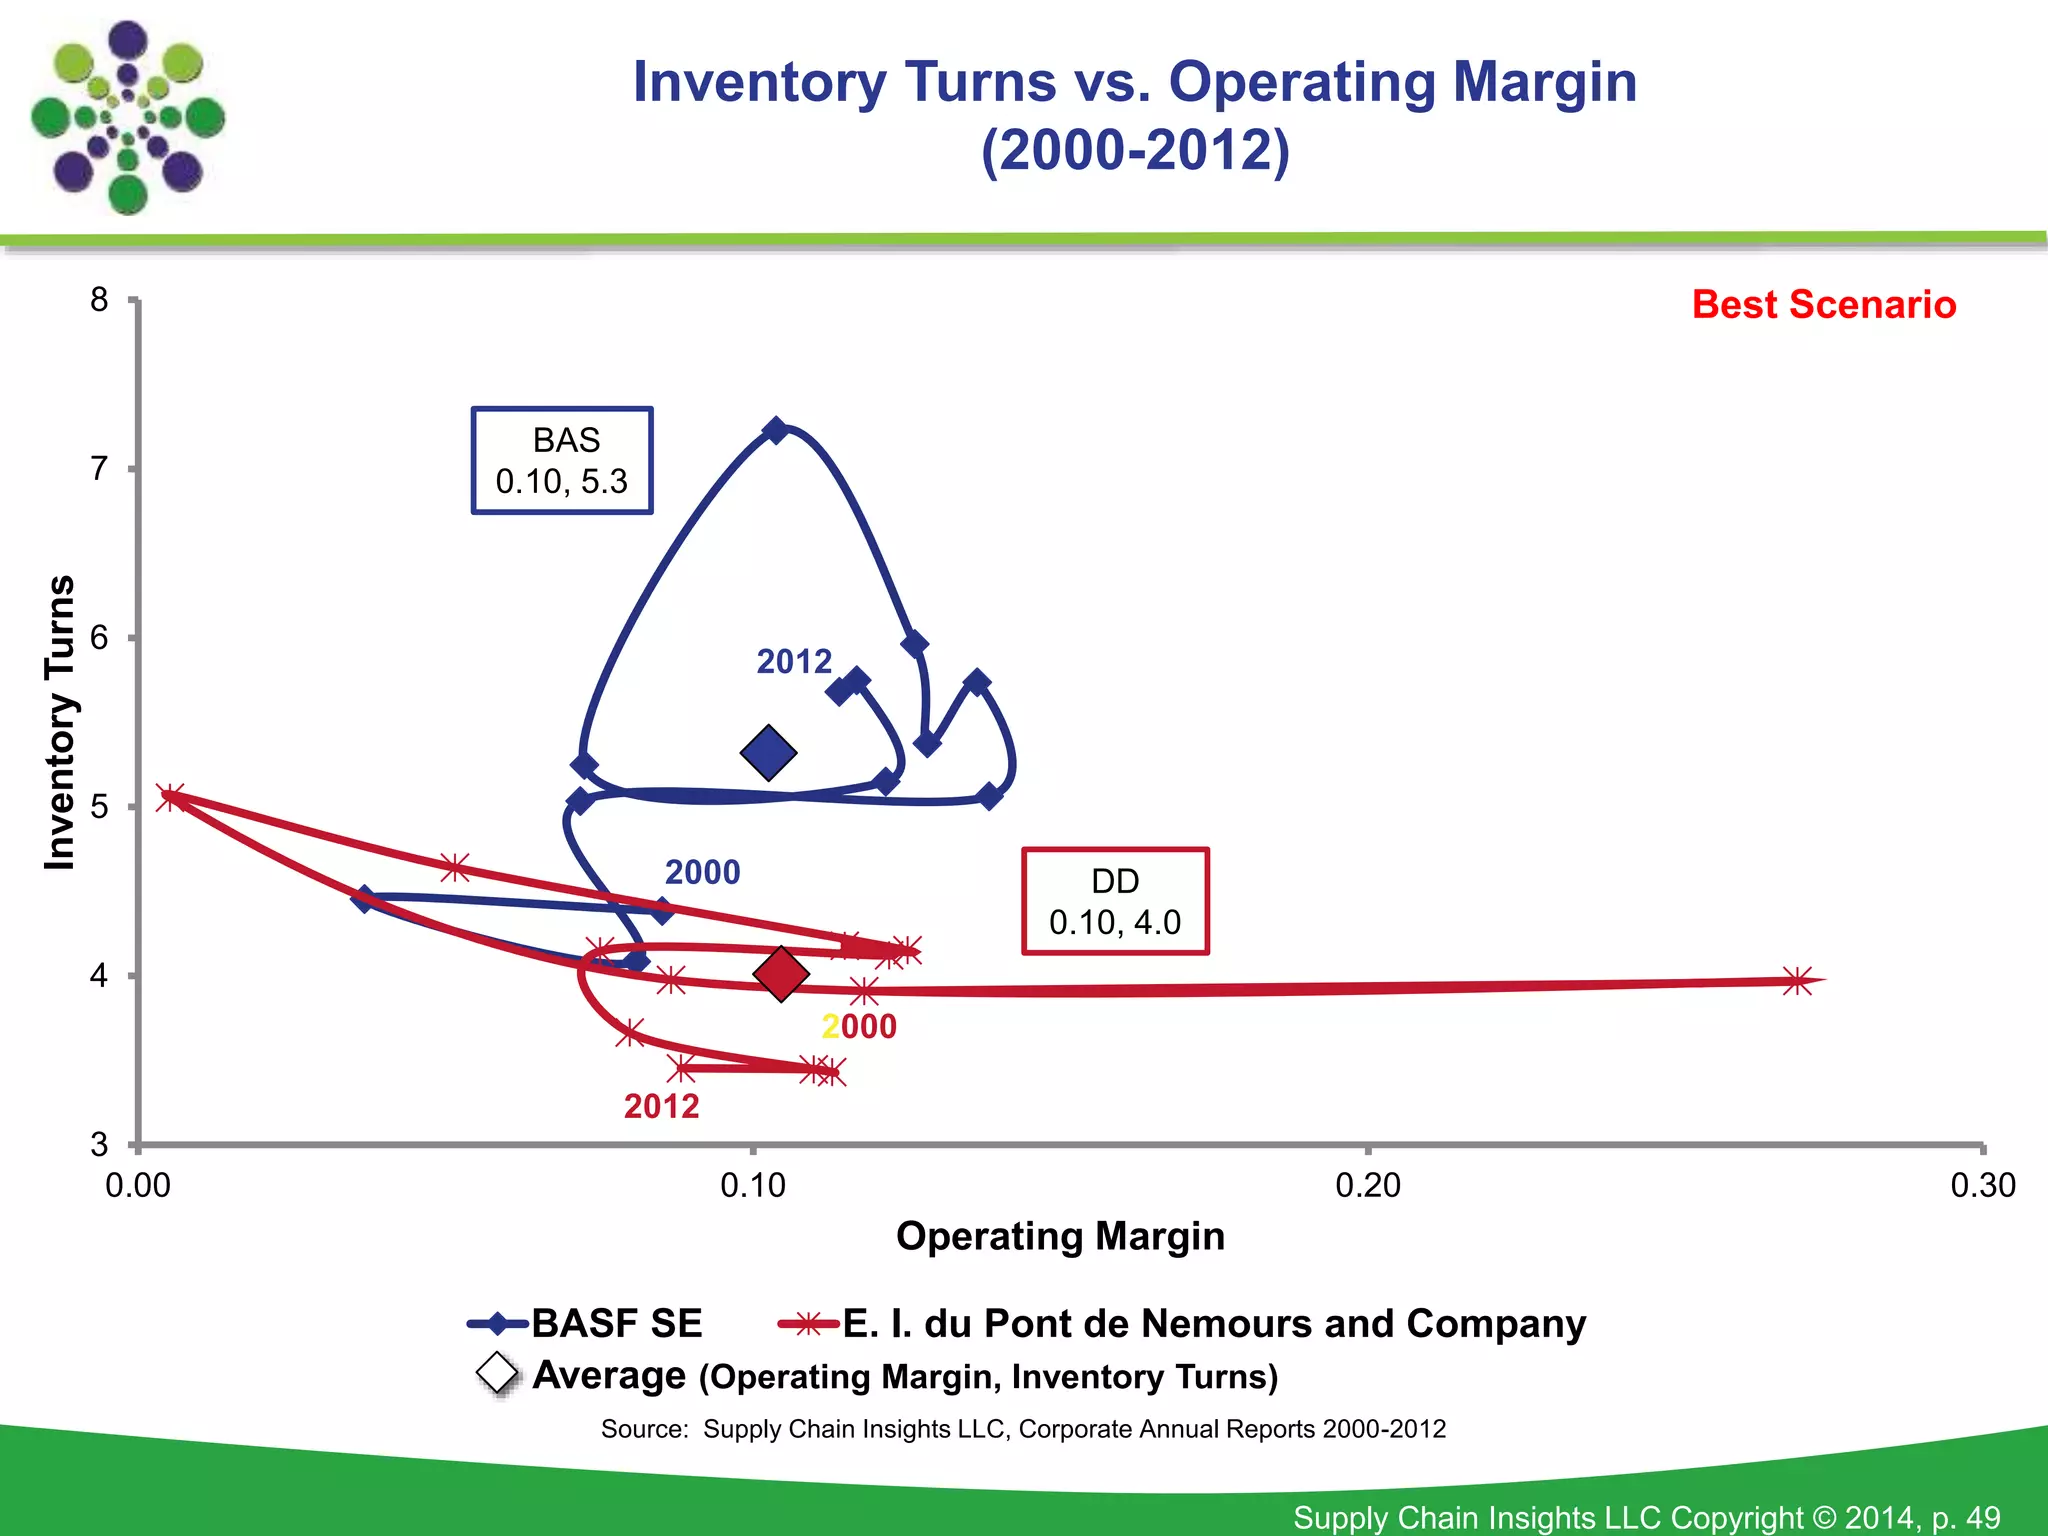
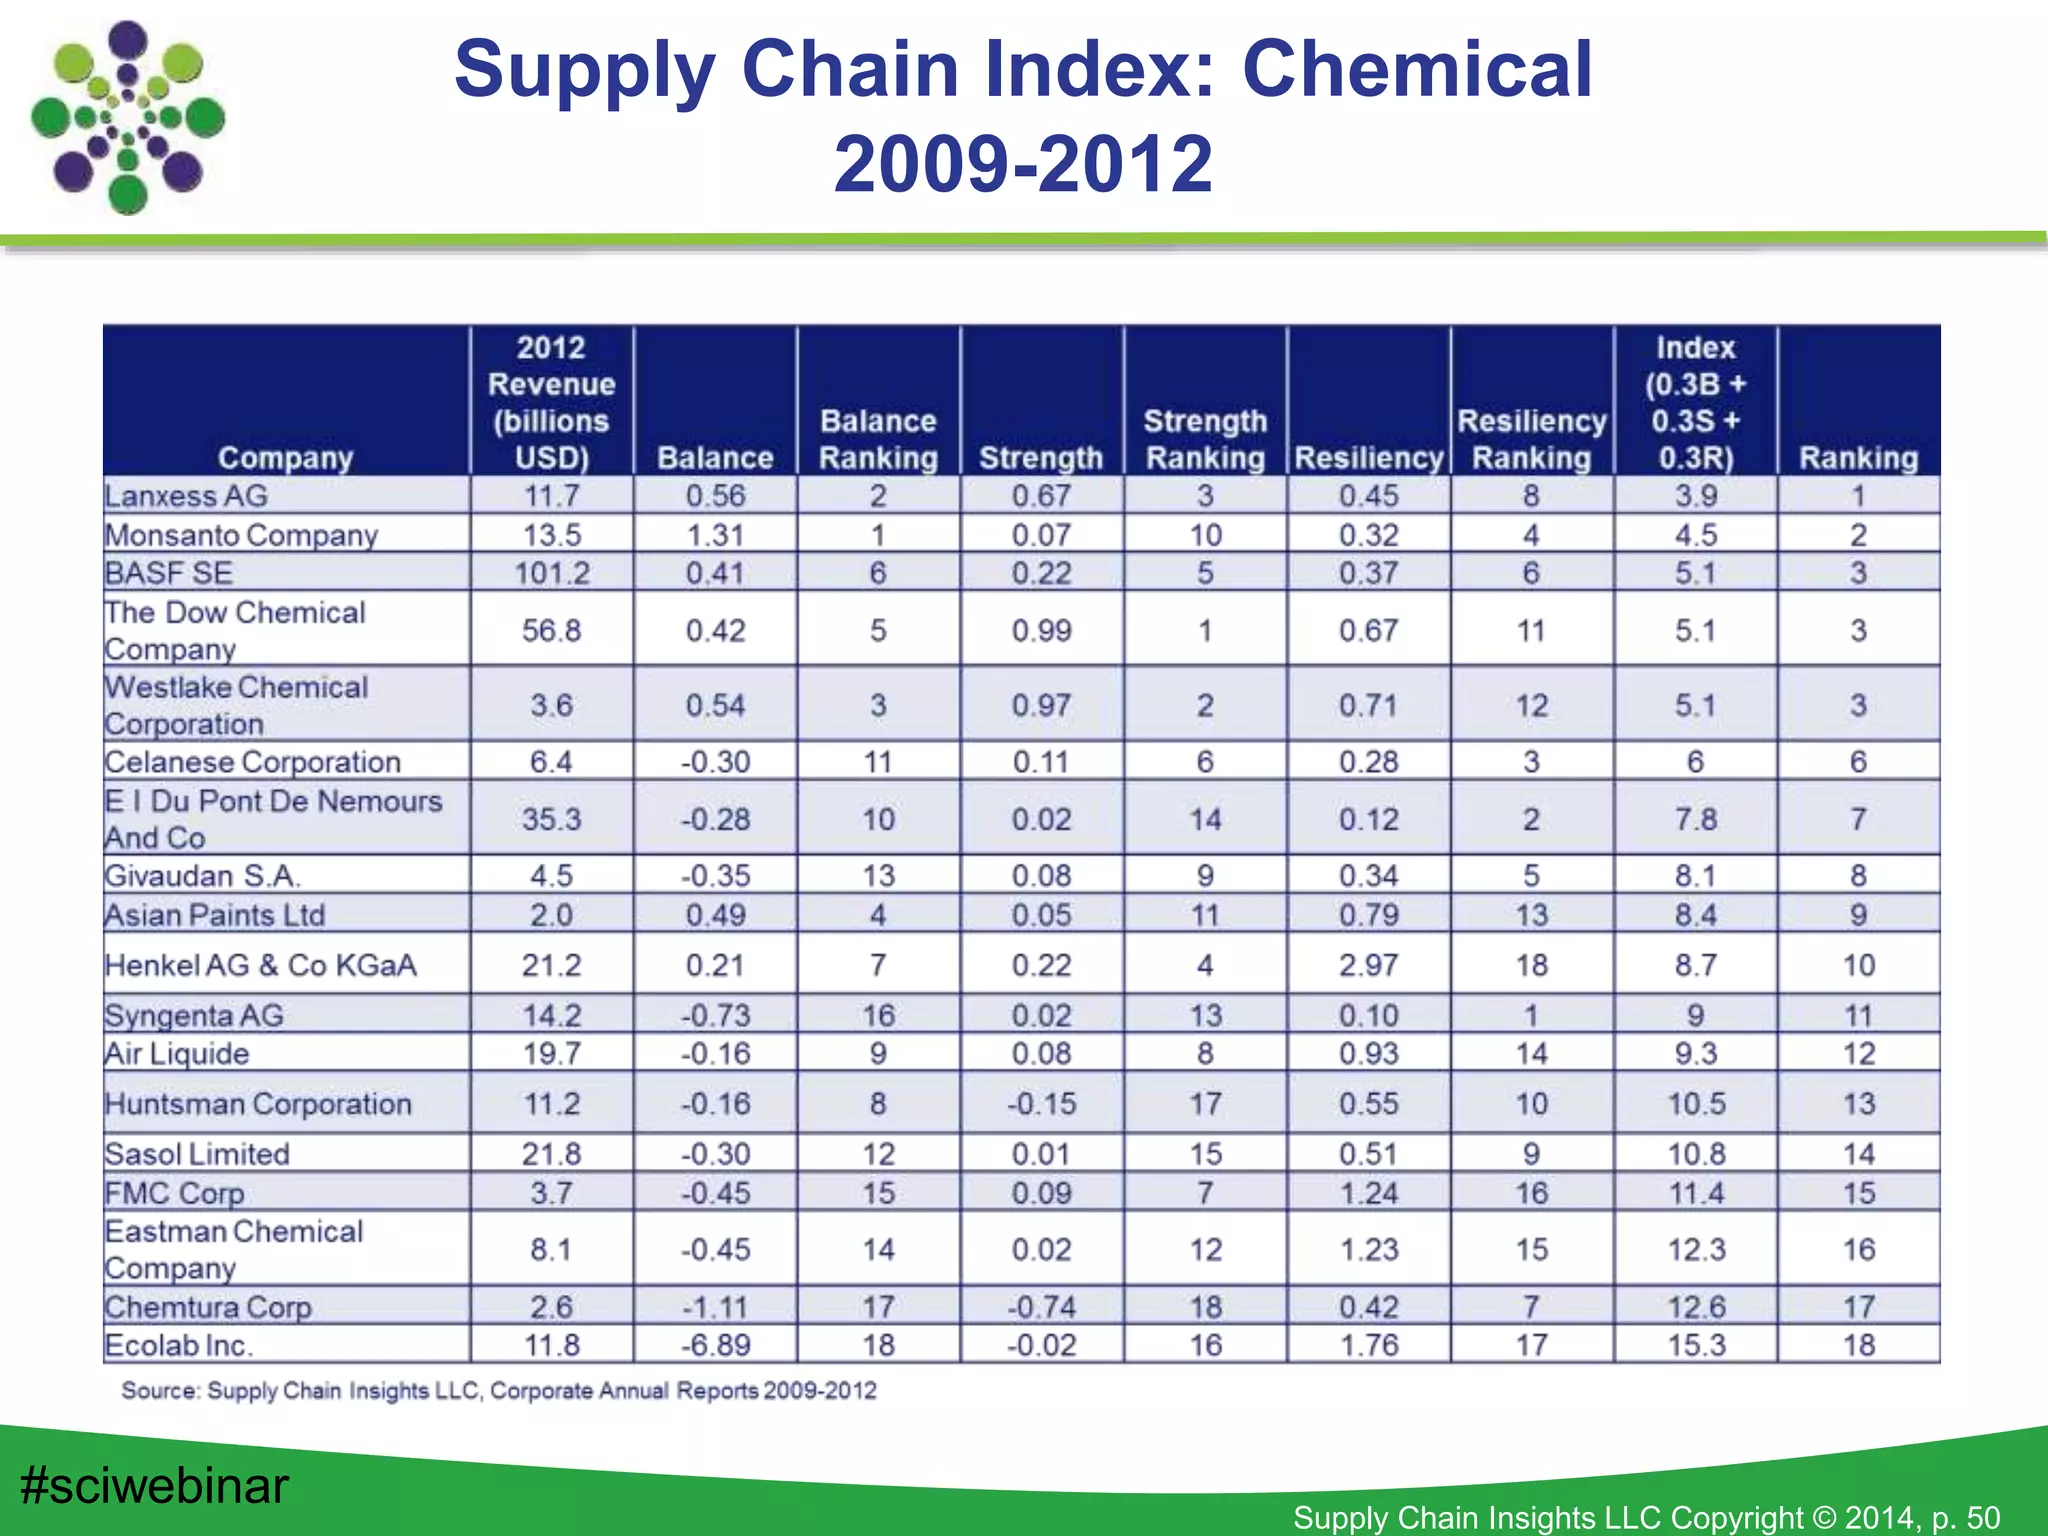
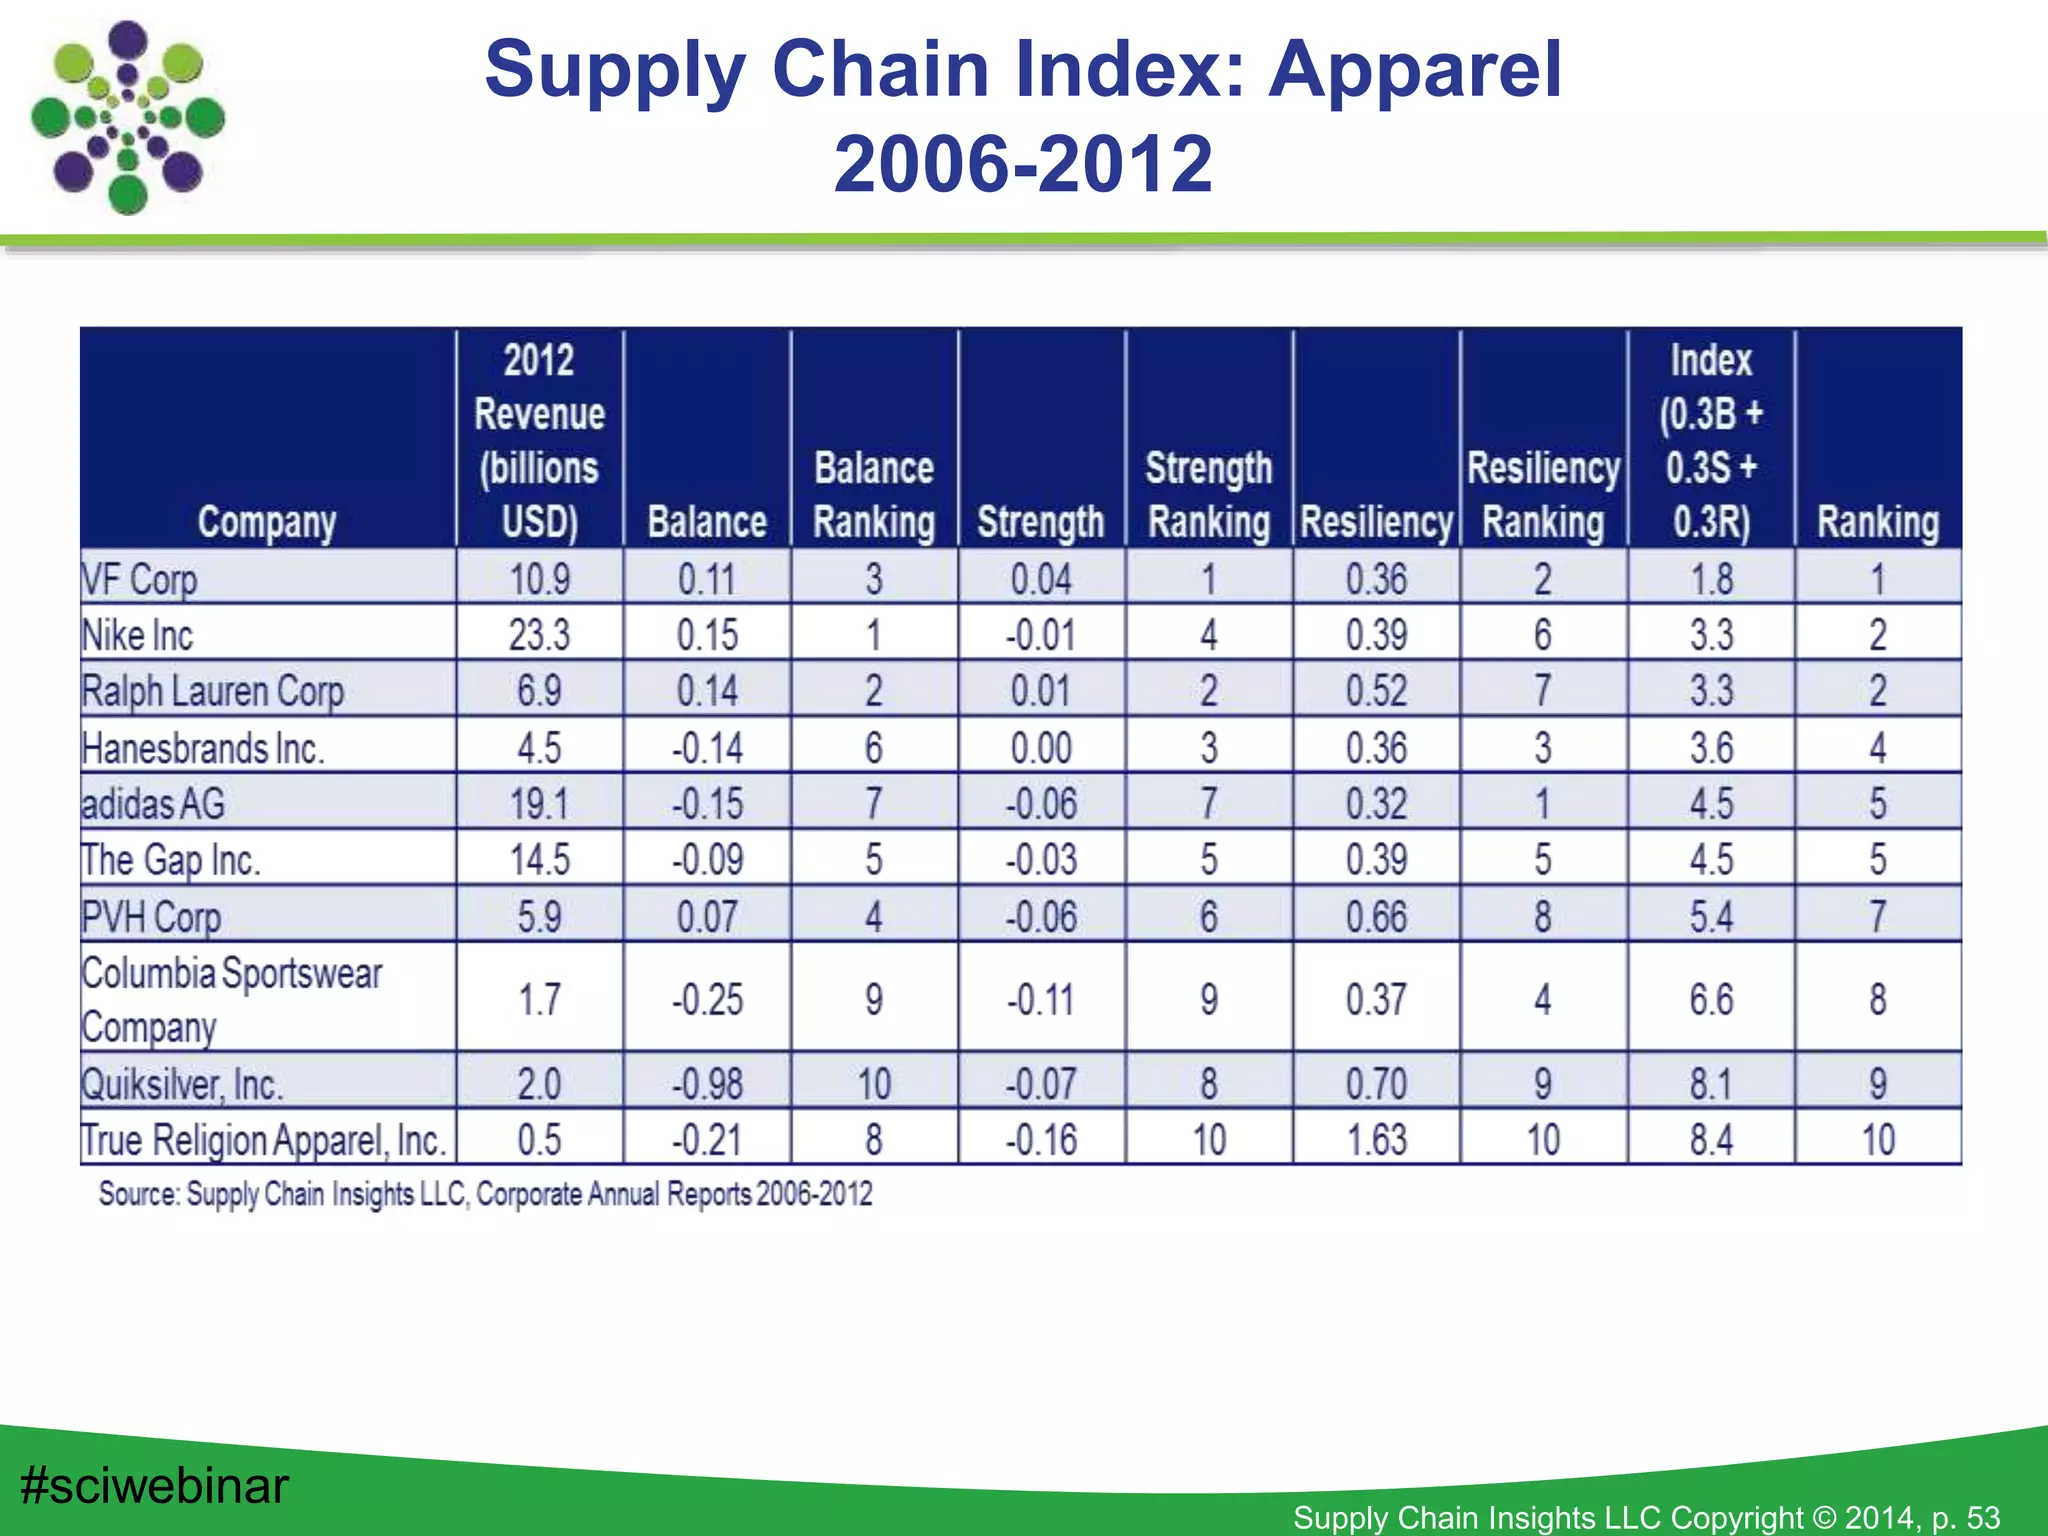
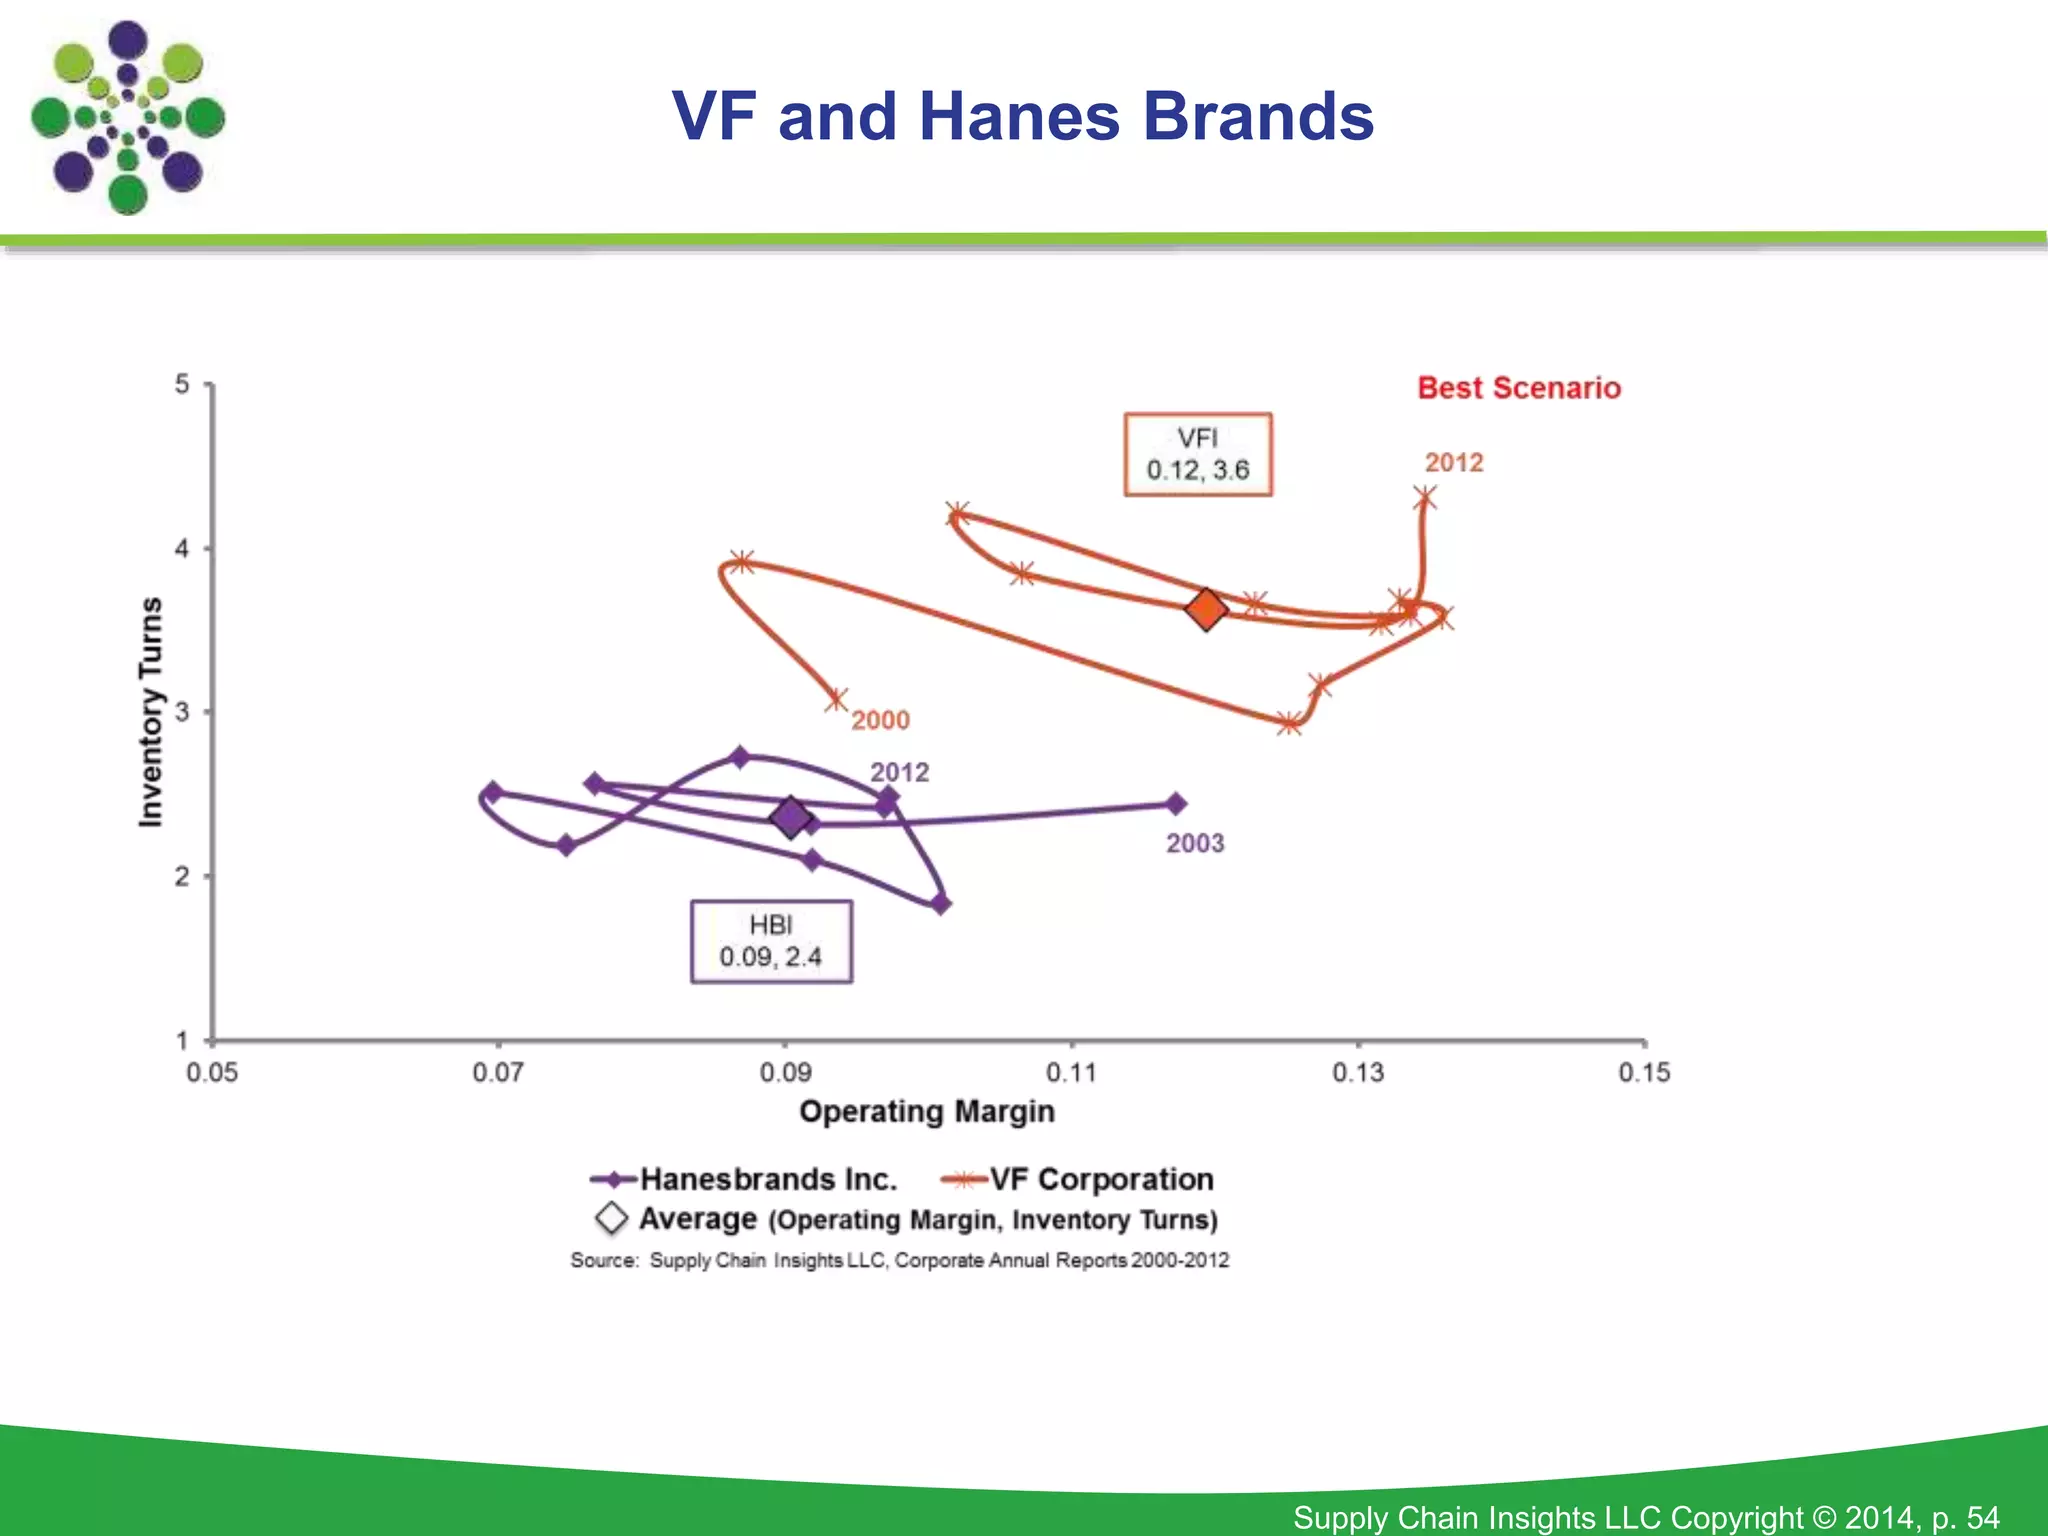
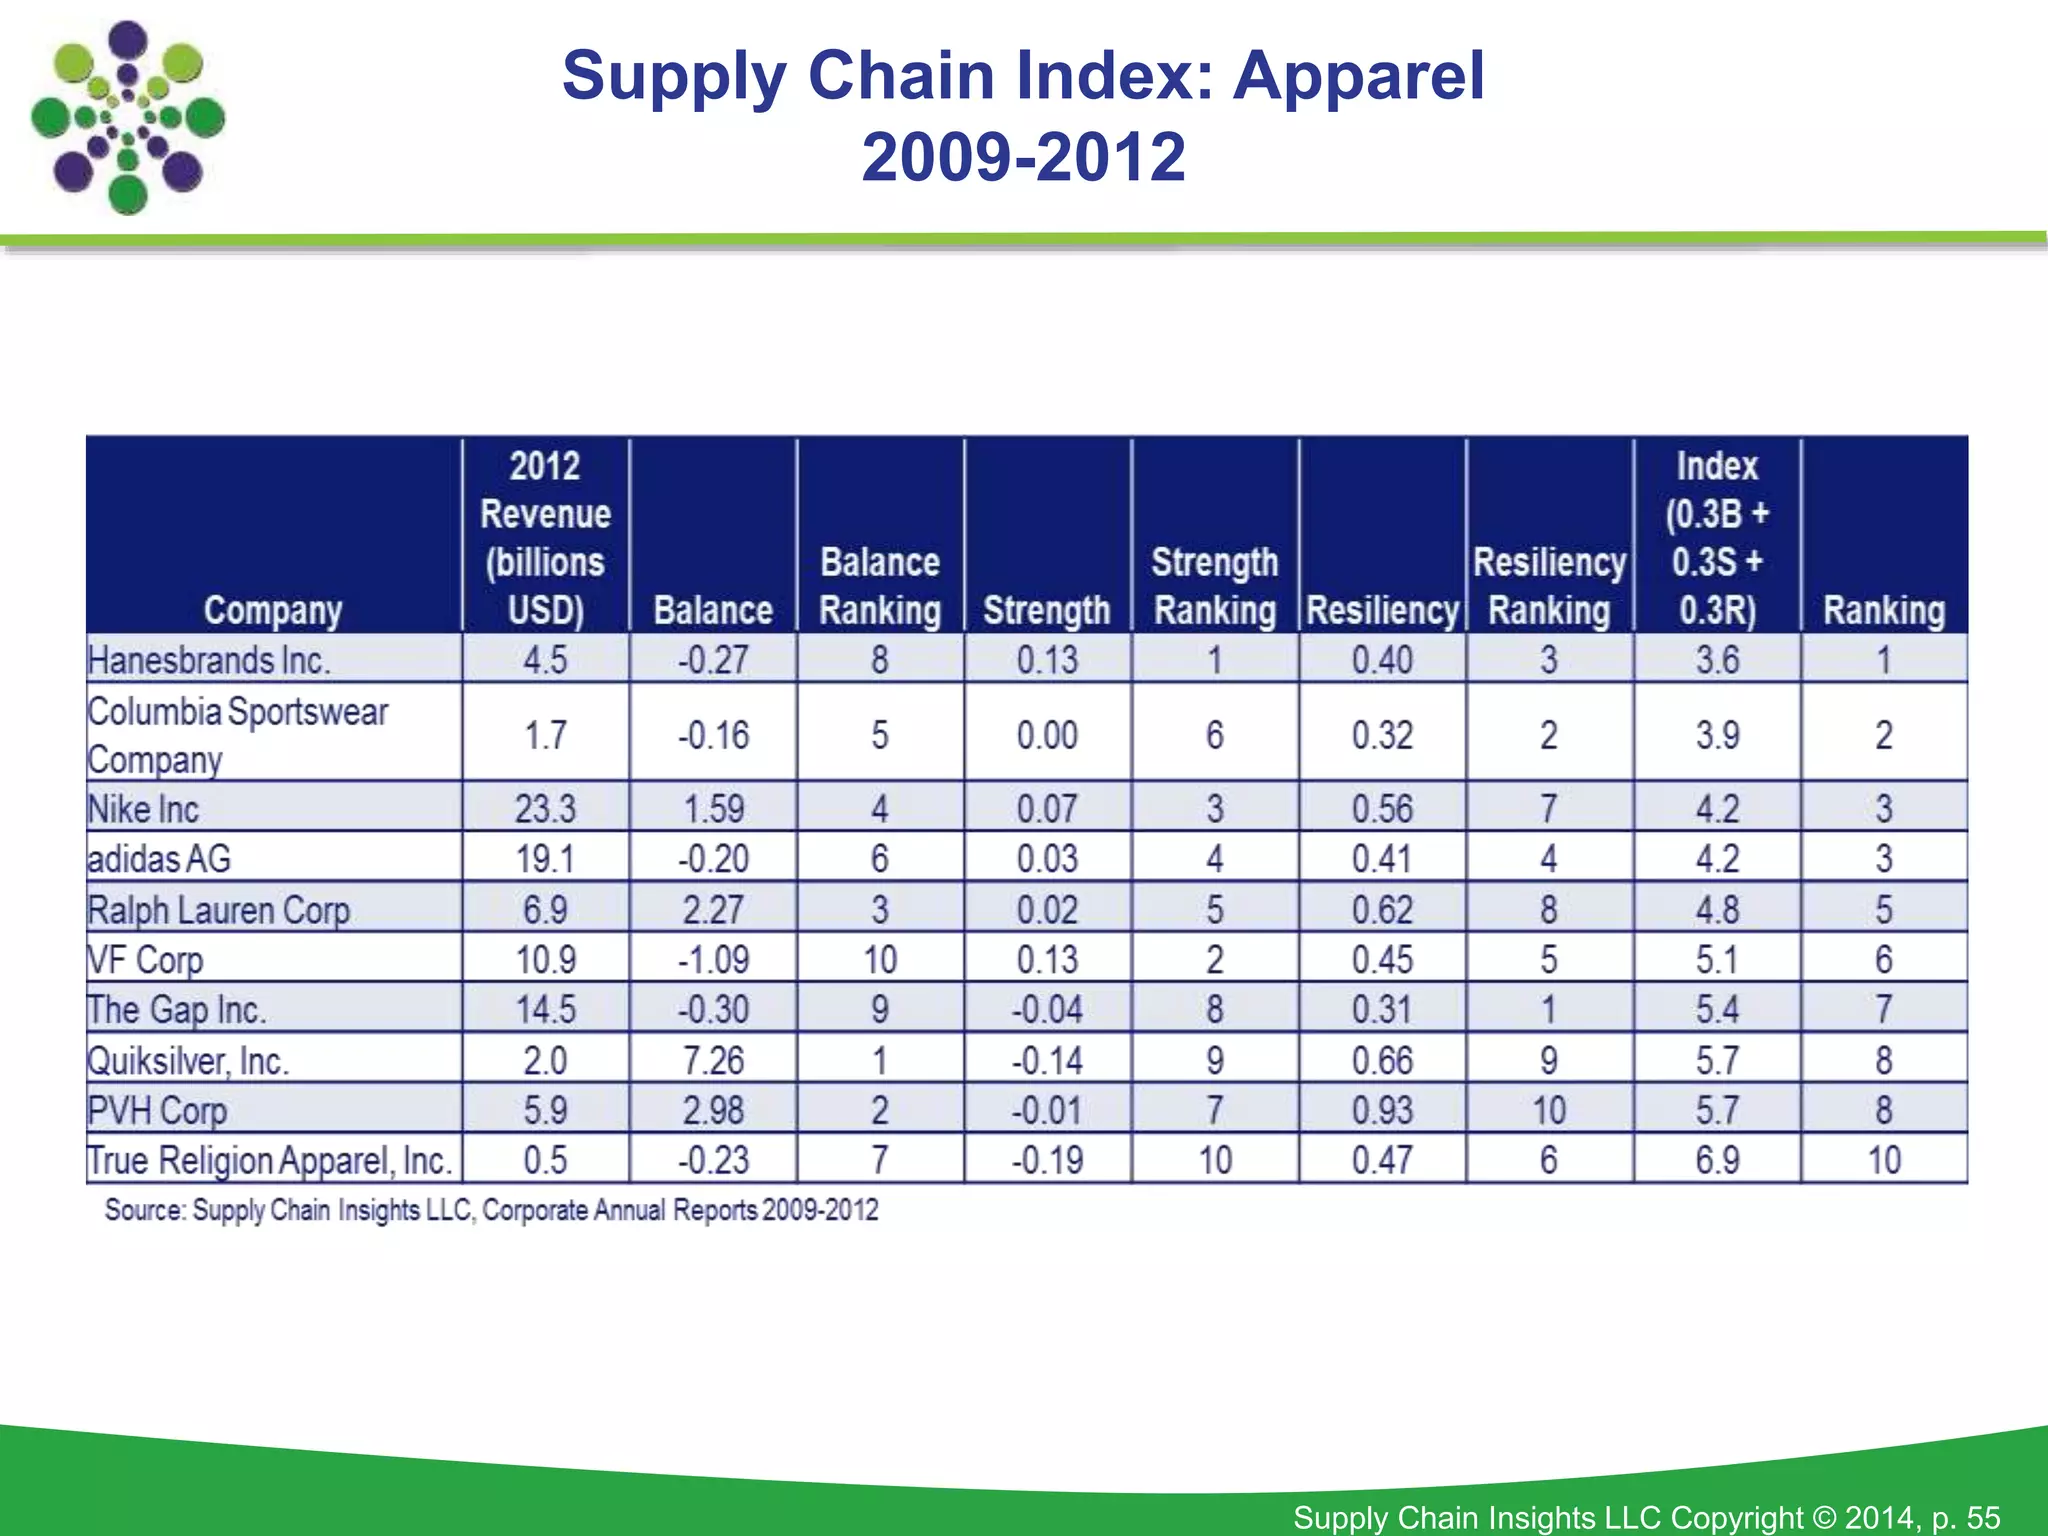
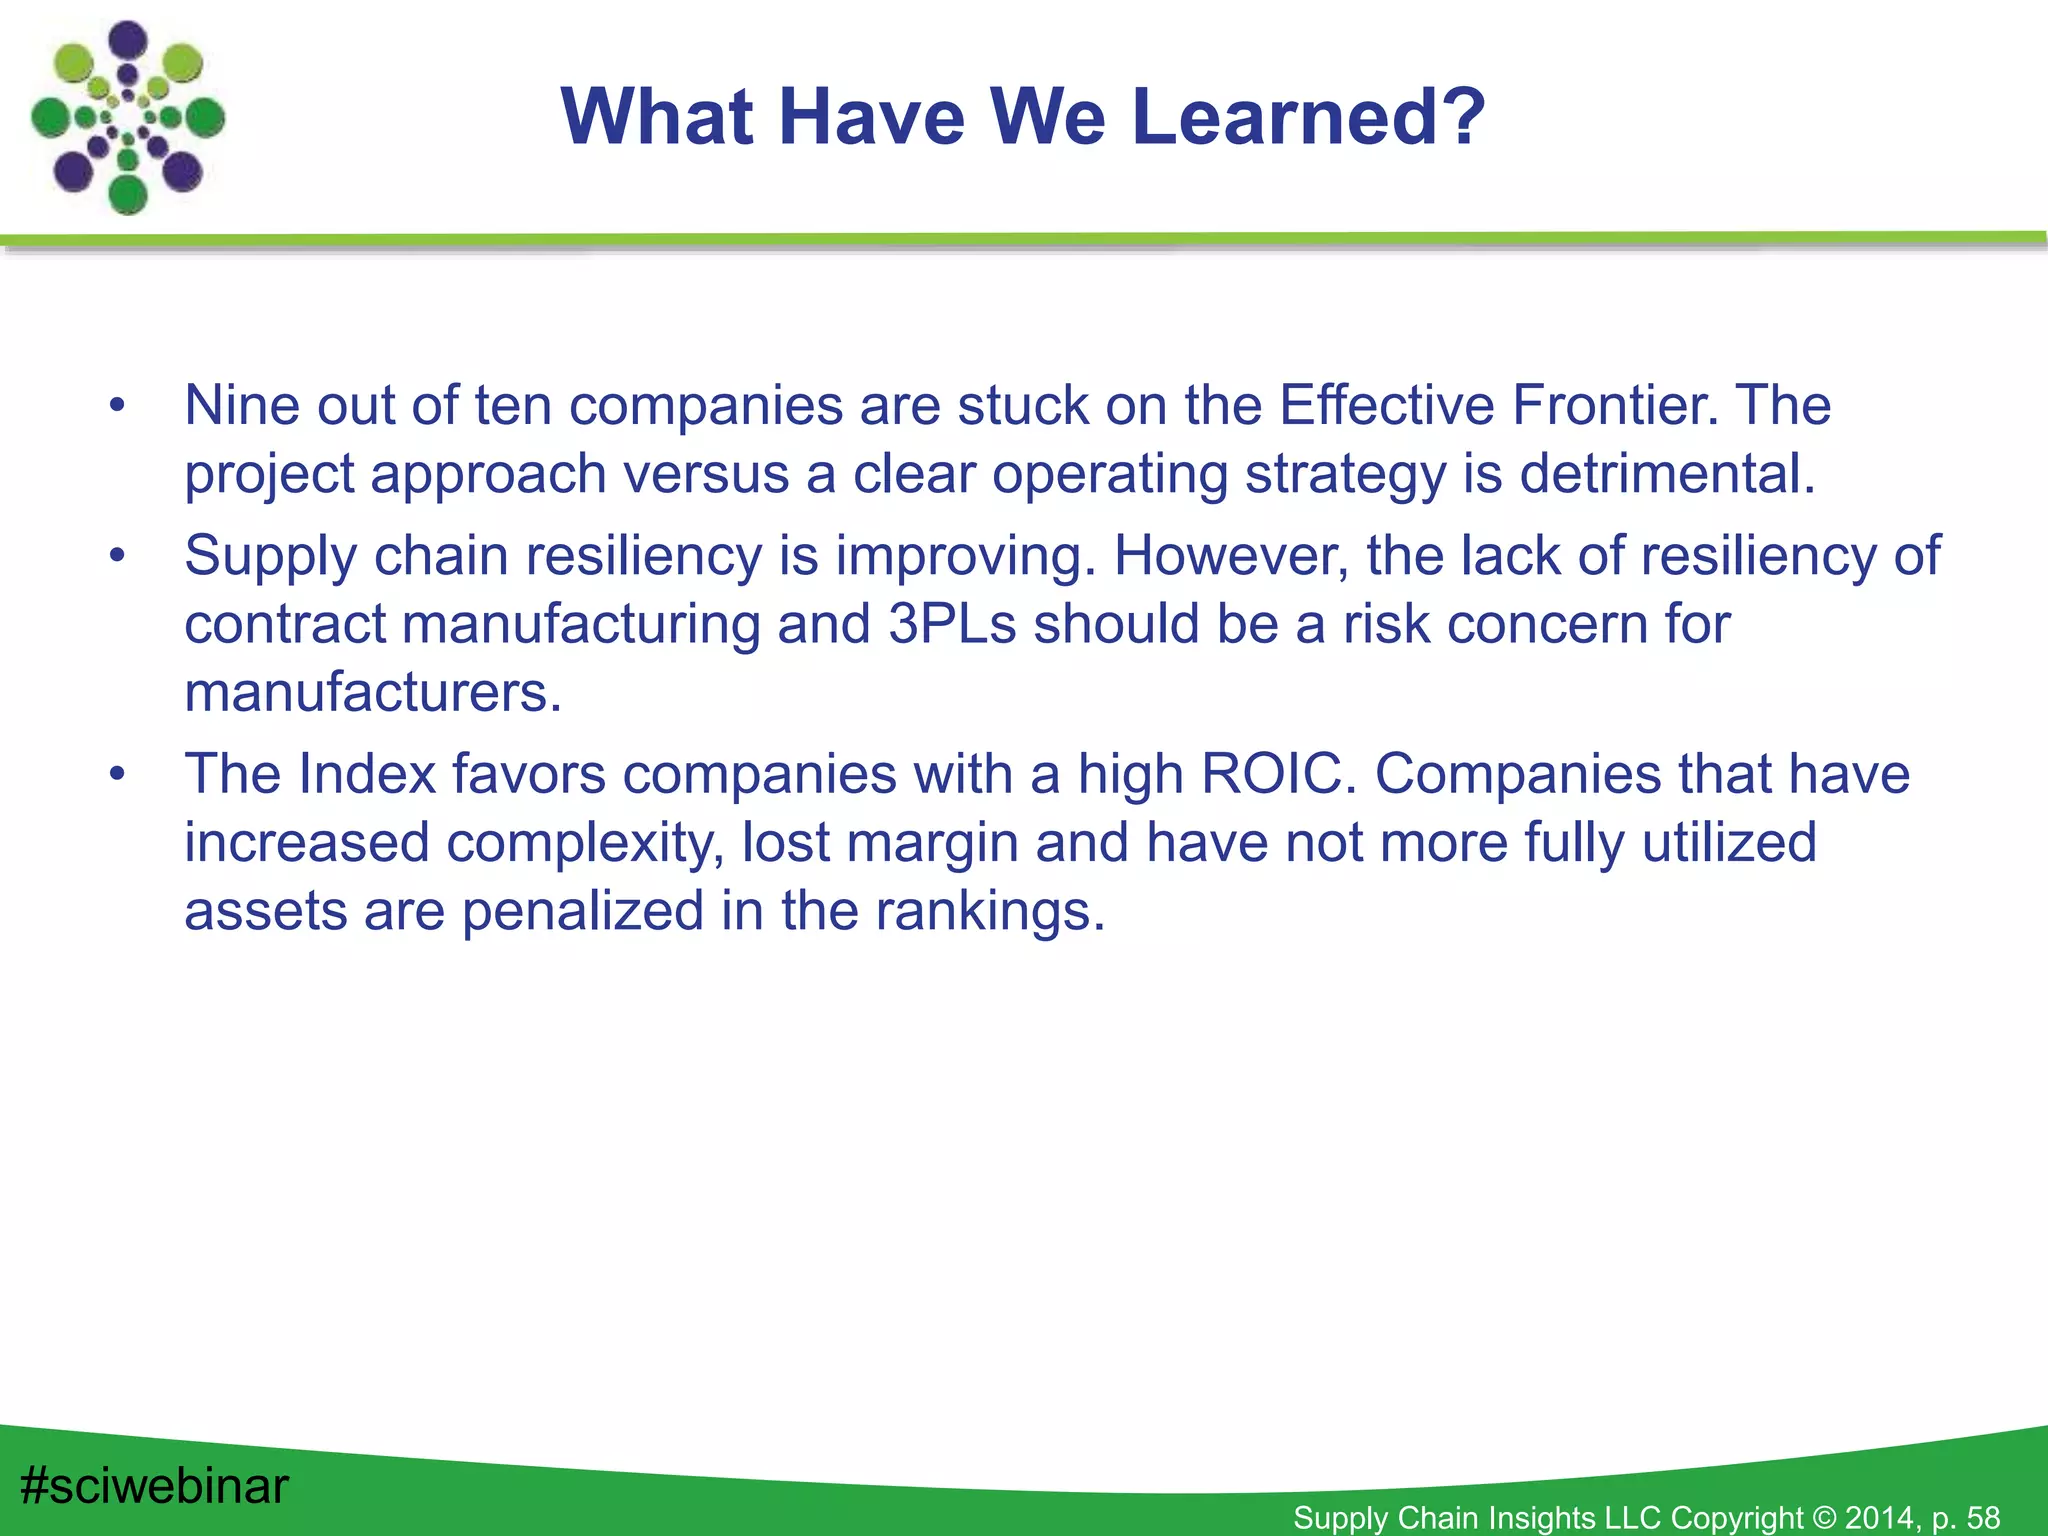
Consumer Value Networks:
How Do You Measure UP?
The Supply Chain Index
#sciwebinar
Supply Chain Insights LLC Copyright © 2014, p. 2
Supply Chain Insights is focused on delivering
independent, actionable and objective advice for
supply chain leaders.
A company dedicated to research,
turn to us when you want the latest insights
on supply chain trends, technologies to know and
metrics that matter.
About Us
#sciwebinar
Supply Chain Insights LLC Copyright © 2014, p. 3
Presenters
Abby Mayer
Research Associate
Lora Cecere
Founder and CEO
#sciwebinar
Dr. George Runger
Professor, CIDSE, ASU
Supply Chain Insights LLC Copyright © 2014, p. 4
Agenda
#sciwebinar
Supply Chain Insights LLC Copyright © 2014, p. 5
To develop a methodology to help supply chain leaders define supply
chain improvement. To be effective, it had to:
• Evaluate progress over time by peer group.
• Be objective and data driven.
• Compare progress of companies across currencies.
• Enable the comparison of progress of companies regardless of size:
very large to mid-market companies.
• Connect supply chain performance to corporate performance.
• Use standardized, and available data.
Our Vision
Supply Chain Insights LLC Copyright © 2014, p. 6
Today’s Supply Chain
#sciwebinar
Supply Chain Insights LLC Copyright © 2014, p. 7
Supply Chain Risk
#sciwebinar
Supply Chain Insights LLC Copyright © 2014, p. 8
A Supply Chain
is a Complex System
with Complex
Processes
with Increasing
Complexity
Our Belief
#sciwebinar
Supply Chain Insights LLC Copyright © 2014, p. 9
 Resilient and predictable
 Balanced across the set of metrics
to maximize value
 Showing year-over-year strength
against peer group
Desired Corporate Performance
#sciwebinar
Supply Chain Insights LLC Copyright © 2014, p. 10
The Supply Chain Effective Frontier:
First Representation
#sciwebinar
Supply Chain Insights LLC Copyright © 2014, p. 11
While we like this framework, there is no good
source of consistent and accurate data for:
– Forecast Accuracy
– Case Fill Rate
– Corporate Social Responsibility
Problem with this Framework
#sciwebinar
Supply Chain Insights LLC Copyright © 2014, p. 12
The Supply Chain Effective Frontier:
Second Representation
#sciwebinar
In most supply chains, complexity has risen throwing the
supply chain out of balance. We find that nine out of ten
companies are stuck at the intersection of inventory turns
and operating margin.
Supply Chain Insights LLC Copyright © 2014, p. 13
Industry Overview: 2006-2012
#sciwebinar
Supply Chain Insights LLC Copyright © 2014, p. 14
Intersection of Operating Margin and
Inventory Turns
#sciwebinar
Supply Chain Insights LLC Copyright © 2014, p. 15
Companies Get More Serious
With A Recession
#sciwebinar
Supply Chain Insights LLC Copyright © 2014, p. 16
Agenda
#sciwebinar
Supply Chain Insights LLC Copyright © 2014, p. 17
Mining 20 Years of Financial Data
#sciwebinar
Supply Chain Insights LLC Copyright © 2014, p. 18
Correlations to Market Capitalization
#sciwebinar
Supply Chain Insights LLC Copyright © 2014, p. 19
How to Read an Orbit Chart
#sciwebinar
Supply Chain Insights LLC Copyright © 2014, p. 20
Supply Chain Metrics That Matter Reports
#sciwebinar
Supply Chain Insights LLC Copyright © 2014, p. 21
Agenda
#sciwebinar
Supply Chain Insights LLC Copyright © 2014, p. 22
Supply Chain Metrics That Matter Reports
#sciwebinar
What is Resiliency?
Tightness of the Pattern
on the Orbit Chart for
Operating Margin and
Inventory Turns
Supply Chain Insights LLC Copyright © 2014, p. 23
Resiliency 2000-2012
#sciwebinar
Supply Chain Insights LLC Copyright © 2014, p. 24
Agenda
#sciwebinar
Supply Chain Insights LLC Copyright © 2014, p. 25
Overall Ranking per Company
• Balance: Return on Invested Capital & Revenue Growth Vector Trajectory (30%)
• Strength: Inventory Turns & Operating Margin Vector Trajectory (30%)
• Resiliency: Inventory Turns & Operating Margin Mean Distance (30%)
• Peer: Peer Rankings by Industry (10%)
The Supply Chain Index
A new way to measure relative
supply chain performance by
industry, based on 4 components:
balance, strength, resiliency and
peer rankings.
Supply Chain Index: A Measure of Supply
Chain Improvement
#sciwebinar
Supply Chain Insights LLC Copyright © 2014, p. 26
The Index Framework
#sciwebinar
Supply Chain Insights LLC Copyright © 2014, p. 27
Supply Chain Index
30% 30% 30% 10%
#sciwebinar
What is the right weighting?
What is the right time period?
Supply Chain Insights LLC Copyright © 2014, p. 28
An exclusive, invitation-only group
of senior supply chain leaders
(330 at present):
• Two private networking events/year
• One-on-one networking as needed
• Invitations to rank companies for the
Supply Chain Index (one per company)
• Monthly calls on specific topics
Shaman’s Circle
Retail
Supply Chain Insights LLC Copyright © 2014, p. 30
Supply Chain Index: Retail
2006-2012
#sciwebinar
Supply Chain Insights LLC Copyright © 2014, p. 31
Wal-Mart and Target
(2000-2012)
Source: Supply Chain Insights LLC, Corporate Annual Reports 2000-2012
2000
2012
2000
2012
5
6
7
8
9
10
0.05 0.06 0.07 0.08
InventoryTurns
Operating Margin
Target Corporation Wal-Mart Stores, Inc.
Best Scenario
TGT
0.06, 6.2
WMT
0.06, 7.8
Average (Operating Margin, Inventory Turns)
Supply Chain Insights LLC Copyright © 2014, p. 32
CVS and Walgreens
2000-2012
Supply Chain Insights LLC Copyright © 2014, p. 33
Retail Index:
2009-2012
Supply Chain Insights LLC Copyright © 2014, p. 34
• Drug channel rises.
• Kroger and Target make progress. Sainsbury and Costco fall.
Retail Summary
Consumer Packaged Goods
Supply Chain Insights LLC Copyright © 2014, p. 36
Supply Chain Index: Consumer Products
2006-2012
#sciwebinar
Supply Chain Insights LLC Copyright © 2014, p. 37
Colgate and P&G
(2000-2012)
Source: Supply Chain Insights LLC, Corporate Annual Reports 2000-2012
2000
2012
2000
2012
4
5
6
7
0.10 0.15 0.20 0.25
InventoryTurns
Operating Margin
Colgate-Palmolive Company Procter & Gamble Company
Best Scenario
CL
0.21, 5.7
PG
0.18, 5.7
Average (Operating Margin, Inventory Turns)
Supply Chain Insights LLC Copyright © 2014, p. 38
P&G and Unilever
2000-2012
Supply Chain Insights LLC Copyright © 2014, p. 39
Supply Chain Index: Consumer Products
2009-2012
#sciwebinar
Supply Chain Insights LLC Copyright © 2014, p. 40
• Beauty category gains ground. Heavier CPG products lose ground as
the cost of transportation increases.
• L’Oreal, Beiersdorf and Unilever improve. Colgate falls.
Consumer Products Comparison
Food and Beverage
Supply Chain Insights LLC Copyright © 2014, p. 42
Supply Chain Index: Food and Beverage
2006-2012
#sciwebinar
Supply Chain Insights LLC Copyright © 2014, p. 43
Campbell Soup and Hershey
(2000-2013)
Supply Chain Insights LLC Copyright © 2014, p. 44
General Mills and Kellogg’s
2000-2012
Supply Chain Insights LLC Copyright © 2014, p. 45
Supply Chain Index: Food and Beverage
2009-2012
#sciwebinar
Supply Chain Insights LLC Copyright © 2014, p. 46
• Nestle, Smuckers, PepsiCo, Inbev and Conagra make significant
gains.
• General Mills and Coca-Cola Enterprises fall.
Food and Beverage Comparison
Chemical
Supply Chain Insights LLC Copyright © 2014, p. 48
Supply Chain Index: Chemical
2006-2012
#sciwebinar
Supply Chain Insights LLC Copyright © 2014, p. 49
Inventory Turns vs. Operating Margin
(2000-2012)
Source: Supply Chain Insights LLC, Corporate Annual Reports 2000-2012
2000
2012
2000
2012
3
4
5
6
7
8
0.00 0.10 0.20 0.30
InventoryTurns
Operating Margin
BASF SE E. I. du Pont de Nemours and Company
Best Scenario
BAS
0.10, 5.3
DD
0.10, 4.0
Average (Operating Margin, Inventory Turns)
Supply Chain Insights LLC Copyright © 2014, p. 50
Supply Chain Index: Chemical
2009-2012
#sciwebinar
Supply Chain Insights LLC Copyright © 2014, p. 51
• BASF and Dow Chemical move up the stack.
• Dow improves post Rohm and Haas acquisition.
• DuPont, FMC and Ecolab drop in the rankings.
Insights on Chemical
Apparel
Supply Chain Insights LLC Copyright © 2014, p. 53
Supply Chain Index: Apparel
2006-2012
#sciwebinar
Supply Chain Insights LLC Copyright © 2014, p. 54
VF and Hanes Brands
Supply Chain Insights LLC Copyright © 2014, p. 55
Supply Chain Index: Apparel
2009-2012
Supply Chain Insights LLC Copyright © 2014, p. 56
• Hanes, Nike and Columbia Sportswear rise in the ranking. VF falls
due to M&A and coalition rationalization strategies.
Insights on Apparel
Supply Chain Insights LLC Copyright © 2014, p. 57
• Retail: Dollar General and Kohl’s
• CPG: L’Oreal, Beiersdorf and Estee Lauder
• Food: Campbell’s, Hershey and Nestle
• Chemical: Lanxess, Monsanto, and BASF
• Apparel: Hanes, Columbia Sportswear and VF
Our Winners Circle
Supply Chain Insights LLC Copyright © 2014, p. 58
• Nine out of ten companies are stuck on the Effective Frontier. The
project approach versus a clear operating strategy is detrimental.
• Supply chain resiliency is improving. However, the lack of resiliency of
contract manufacturing and 3PLs should be a risk concern for
manufacturers.
• The Index favors companies with a high ROIC. Companies that have
increased complexity, lost margin and have not more fully utilized
assets are penalized in the rankings.
What Have We Learned?
#sciwebinar
Supply Chain Insights LLC Copyright © 2014, p. 59
Agenda
#sciwebinar
Supply Chain Insights LLC Copyright © 2014, p. 60
Next Steps
#sciwebinar
• Supply Chain Index Webinars
• July 17- Healthcare Value Network
• August 12- Industrial Value Network
• Monthly Research Reports
• June 17- Consumer Value Network
• July 22- Healthcare Value Network
• August 19- Industrial Value Network
• Final analysis of companies to be revealed at the 2014
Supply Chain Insights Global Summit
#sciwebinar
Supply Chain Insights LLC Copyright © 2014, p. 62
Annual Event
Supply Chain Insights LLC Copyright © 2014, p. 63
Metrics That Matter
• Lora Cecere’s 2nd book:
Metrics That Matter
• To publish in Fall 2014
http://tinyurl.com/metricsthatmatter
Pre-orders available on Amazon:
#sciwebinar
Supply Chain Insights LLC Copyright © 2014, p. 64
What’s Happening at
Supply Chain Insights?
www.supplychaininsights.com
#sciwebinar
Supply Chain Insights LLC Copyright © 2014, p. 65
About Lora Cecere
• Founder of Supply Chain Insights
• Invited to be a “LinkedIn Influencer”
• Invited to write a guest blog for Forbes
• Author of 2 books: Bricks Matter (2012) and
Metrics That Matter (to publish Fall of 2014)
• Partner at Altimeter Group (leader in open research)
• 7 years of Management Experience leading Analyst Teams at Gartner and
AMR Research
• 8 years Experience in Marketing and Selling Supply Chain Software at
Descartes Systems Group and Manugistics (now JDA)
• 15 Years Leading teams in Manufacturing and Distribution operations for
Clorox, Kraft/General Foods, Nestle/Dreyers Grand Ice Cream and
Procter & Gamble.
Contact Information:
• Email: lora.cecere@supplychaininsights.com
• Blog: www.supplychainshaman.com (6000 pageviews/month)
• Forbes: http://www.forbes.com/search/?q=lora+cecere
• Twitter: lcecere (4800 followers)
• LinkedIn: linkedin.com/pub/lora-cecere/0/196/573 (7000 in the network)
#sciwebinar

Supply chain index webinar june 11 final

  • 1.
    Consumer Value Networks: HowDo You Measure UP? The Supply Chain Index #sciwebinar
  • 2.
    Supply Chain InsightsLLC Copyright © 2014, p. 2 Supply Chain Insights is focused on delivering independent, actionable and objective advice for supply chain leaders. A company dedicated to research, turn to us when you want the latest insights on supply chain trends, technologies to know and metrics that matter. About Us #sciwebinar
  • 3.
    Supply Chain InsightsLLC Copyright © 2014, p. 3 Presenters Abby Mayer Research Associate Lora Cecere Founder and CEO #sciwebinar Dr. George Runger Professor, CIDSE, ASU
  • 4.
    Supply Chain InsightsLLC Copyright © 2014, p. 4 Agenda #sciwebinar
  • 5.
    Supply Chain InsightsLLC Copyright © 2014, p. 5 To develop a methodology to help supply chain leaders define supply chain improvement. To be effective, it had to: • Evaluate progress over time by peer group. • Be objective and data driven. • Compare progress of companies across currencies. • Enable the comparison of progress of companies regardless of size: very large to mid-market companies. • Connect supply chain performance to corporate performance. • Use standardized, and available data. Our Vision
  • 6.
    Supply Chain InsightsLLC Copyright © 2014, p. 6 Today’s Supply Chain #sciwebinar
  • 7.
    Supply Chain InsightsLLC Copyright © 2014, p. 7 Supply Chain Risk #sciwebinar
  • 8.
    Supply Chain InsightsLLC Copyright © 2014, p. 8 A Supply Chain is a Complex System with Complex Processes with Increasing Complexity Our Belief #sciwebinar
  • 9.
    Supply Chain InsightsLLC Copyright © 2014, p. 9  Resilient and predictable  Balanced across the set of metrics to maximize value  Showing year-over-year strength against peer group Desired Corporate Performance #sciwebinar
  • 10.
    Supply Chain InsightsLLC Copyright © 2014, p. 10 The Supply Chain Effective Frontier: First Representation #sciwebinar
  • 11.
    Supply Chain InsightsLLC Copyright © 2014, p. 11 While we like this framework, there is no good source of consistent and accurate data for: – Forecast Accuracy – Case Fill Rate – Corporate Social Responsibility Problem with this Framework #sciwebinar
  • 12.
    Supply Chain InsightsLLC Copyright © 2014, p. 12 The Supply Chain Effective Frontier: Second Representation #sciwebinar In most supply chains, complexity has risen throwing the supply chain out of balance. We find that nine out of ten companies are stuck at the intersection of inventory turns and operating margin.
  • 13.
    Supply Chain InsightsLLC Copyright © 2014, p. 13 Industry Overview: 2006-2012 #sciwebinar
  • 14.
    Supply Chain InsightsLLC Copyright © 2014, p. 14 Intersection of Operating Margin and Inventory Turns #sciwebinar
  • 15.
    Supply Chain InsightsLLC Copyright © 2014, p. 15 Companies Get More Serious With A Recession #sciwebinar
  • 16.
    Supply Chain InsightsLLC Copyright © 2014, p. 16 Agenda #sciwebinar
  • 17.
    Supply Chain InsightsLLC Copyright © 2014, p. 17 Mining 20 Years of Financial Data #sciwebinar
  • 18.
    Supply Chain InsightsLLC Copyright © 2014, p. 18 Correlations to Market Capitalization #sciwebinar
  • 19.
    Supply Chain InsightsLLC Copyright © 2014, p. 19 How to Read an Orbit Chart #sciwebinar
  • 20.
    Supply Chain InsightsLLC Copyright © 2014, p. 20 Supply Chain Metrics That Matter Reports #sciwebinar
  • 21.
    Supply Chain InsightsLLC Copyright © 2014, p. 21 Agenda #sciwebinar
  • 22.
    Supply Chain InsightsLLC Copyright © 2014, p. 22 Supply Chain Metrics That Matter Reports #sciwebinar What is Resiliency? Tightness of the Pattern on the Orbit Chart for Operating Margin and Inventory Turns
  • 23.
    Supply Chain InsightsLLC Copyright © 2014, p. 23 Resiliency 2000-2012 #sciwebinar
  • 24.
    Supply Chain InsightsLLC Copyright © 2014, p. 24 Agenda #sciwebinar
  • 25.
    Supply Chain InsightsLLC Copyright © 2014, p. 25 Overall Ranking per Company • Balance: Return on Invested Capital & Revenue Growth Vector Trajectory (30%) • Strength: Inventory Turns & Operating Margin Vector Trajectory (30%) • Resiliency: Inventory Turns & Operating Margin Mean Distance (30%) • Peer: Peer Rankings by Industry (10%) The Supply Chain Index A new way to measure relative supply chain performance by industry, based on 4 components: balance, strength, resiliency and peer rankings. Supply Chain Index: A Measure of Supply Chain Improvement #sciwebinar
  • 26.
    Supply Chain InsightsLLC Copyright © 2014, p. 26 The Index Framework #sciwebinar
  • 27.
    Supply Chain InsightsLLC Copyright © 2014, p. 27 Supply Chain Index 30% 30% 30% 10% #sciwebinar What is the right weighting? What is the right time period?
  • 28.
    Supply Chain InsightsLLC Copyright © 2014, p. 28 An exclusive, invitation-only group of senior supply chain leaders (330 at present): • Two private networking events/year • One-on-one networking as needed • Invitations to rank companies for the Supply Chain Index (one per company) • Monthly calls on specific topics Shaman’s Circle
  • 29.
  • 30.
    Supply Chain InsightsLLC Copyright © 2014, p. 30 Supply Chain Index: Retail 2006-2012 #sciwebinar
  • 31.
    Supply Chain InsightsLLC Copyright © 2014, p. 31 Wal-Mart and Target (2000-2012) Source: Supply Chain Insights LLC, Corporate Annual Reports 2000-2012 2000 2012 2000 2012 5 6 7 8 9 10 0.05 0.06 0.07 0.08 InventoryTurns Operating Margin Target Corporation Wal-Mart Stores, Inc. Best Scenario TGT 0.06, 6.2 WMT 0.06, 7.8 Average (Operating Margin, Inventory Turns)
  • 32.
    Supply Chain InsightsLLC Copyright © 2014, p. 32 CVS and Walgreens 2000-2012
  • 33.
    Supply Chain InsightsLLC Copyright © 2014, p. 33 Retail Index: 2009-2012
  • 34.
    Supply Chain InsightsLLC Copyright © 2014, p. 34 • Drug channel rises. • Kroger and Target make progress. Sainsbury and Costco fall. Retail Summary
  • 35.
  • 36.
    Supply Chain InsightsLLC Copyright © 2014, p. 36 Supply Chain Index: Consumer Products 2006-2012 #sciwebinar
  • 37.
    Supply Chain InsightsLLC Copyright © 2014, p. 37 Colgate and P&G (2000-2012) Source: Supply Chain Insights LLC, Corporate Annual Reports 2000-2012 2000 2012 2000 2012 4 5 6 7 0.10 0.15 0.20 0.25 InventoryTurns Operating Margin Colgate-Palmolive Company Procter & Gamble Company Best Scenario CL 0.21, 5.7 PG 0.18, 5.7 Average (Operating Margin, Inventory Turns)
  • 38.
    Supply Chain InsightsLLC Copyright © 2014, p. 38 P&G and Unilever 2000-2012
  • 39.
    Supply Chain InsightsLLC Copyright © 2014, p. 39 Supply Chain Index: Consumer Products 2009-2012 #sciwebinar
  • 40.
    Supply Chain InsightsLLC Copyright © 2014, p. 40 • Beauty category gains ground. Heavier CPG products lose ground as the cost of transportation increases. • L’Oreal, Beiersdorf and Unilever improve. Colgate falls. Consumer Products Comparison
  • 41.
  • 42.
    Supply Chain InsightsLLC Copyright © 2014, p. 42 Supply Chain Index: Food and Beverage 2006-2012 #sciwebinar
  • 43.
    Supply Chain InsightsLLC Copyright © 2014, p. 43 Campbell Soup and Hershey (2000-2013)
  • 44.
    Supply Chain InsightsLLC Copyright © 2014, p. 44 General Mills and Kellogg’s 2000-2012
  • 45.
    Supply Chain InsightsLLC Copyright © 2014, p. 45 Supply Chain Index: Food and Beverage 2009-2012 #sciwebinar
  • 46.
    Supply Chain InsightsLLC Copyright © 2014, p. 46 • Nestle, Smuckers, PepsiCo, Inbev and Conagra make significant gains. • General Mills and Coca-Cola Enterprises fall. Food and Beverage Comparison
  • 47.
  • 48.
    Supply Chain InsightsLLC Copyright © 2014, p. 48 Supply Chain Index: Chemical 2006-2012 #sciwebinar
  • 49.
    Supply Chain InsightsLLC Copyright © 2014, p. 49 Inventory Turns vs. Operating Margin (2000-2012) Source: Supply Chain Insights LLC, Corporate Annual Reports 2000-2012 2000 2012 2000 2012 3 4 5 6 7 8 0.00 0.10 0.20 0.30 InventoryTurns Operating Margin BASF SE E. I. du Pont de Nemours and Company Best Scenario BAS 0.10, 5.3 DD 0.10, 4.0 Average (Operating Margin, Inventory Turns)
  • 50.
    Supply Chain InsightsLLC Copyright © 2014, p. 50 Supply Chain Index: Chemical 2009-2012 #sciwebinar
  • 51.
    Supply Chain InsightsLLC Copyright © 2014, p. 51 • BASF and Dow Chemical move up the stack. • Dow improves post Rohm and Haas acquisition. • DuPont, FMC and Ecolab drop in the rankings. Insights on Chemical
  • 52.
  • 53.
    Supply Chain InsightsLLC Copyright © 2014, p. 53 Supply Chain Index: Apparel 2006-2012 #sciwebinar
  • 54.
    Supply Chain InsightsLLC Copyright © 2014, p. 54 VF and Hanes Brands
  • 55.
    Supply Chain InsightsLLC Copyright © 2014, p. 55 Supply Chain Index: Apparel 2009-2012
  • 56.
    Supply Chain InsightsLLC Copyright © 2014, p. 56 • Hanes, Nike and Columbia Sportswear rise in the ranking. VF falls due to M&A and coalition rationalization strategies. Insights on Apparel
  • 57.
    Supply Chain InsightsLLC Copyright © 2014, p. 57 • Retail: Dollar General and Kohl’s • CPG: L’Oreal, Beiersdorf and Estee Lauder • Food: Campbell’s, Hershey and Nestle • Chemical: Lanxess, Monsanto, and BASF • Apparel: Hanes, Columbia Sportswear and VF Our Winners Circle
  • 58.
    Supply Chain InsightsLLC Copyright © 2014, p. 58 • Nine out of ten companies are stuck on the Effective Frontier. The project approach versus a clear operating strategy is detrimental. • Supply chain resiliency is improving. However, the lack of resiliency of contract manufacturing and 3PLs should be a risk concern for manufacturers. • The Index favors companies with a high ROIC. Companies that have increased complexity, lost margin and have not more fully utilized assets are penalized in the rankings. What Have We Learned? #sciwebinar
  • 59.
    Supply Chain InsightsLLC Copyright © 2014, p. 59 Agenda #sciwebinar
  • 60.
    Supply Chain InsightsLLC Copyright © 2014, p. 60 Next Steps #sciwebinar • Supply Chain Index Webinars • July 17- Healthcare Value Network • August 12- Industrial Value Network • Monthly Research Reports • June 17- Consumer Value Network • July 22- Healthcare Value Network • August 19- Industrial Value Network • Final analysis of companies to be revealed at the 2014 Supply Chain Insights Global Summit
  • 61.
  • 62.
    Supply Chain InsightsLLC Copyright © 2014, p. 62 Annual Event
  • 63.
    Supply Chain InsightsLLC Copyright © 2014, p. 63 Metrics That Matter • Lora Cecere’s 2nd book: Metrics That Matter • To publish in Fall 2014 http://tinyurl.com/metricsthatmatter Pre-orders available on Amazon: #sciwebinar
  • 64.
    Supply Chain InsightsLLC Copyright © 2014, p. 64 What’s Happening at Supply Chain Insights? www.supplychaininsights.com #sciwebinar
  • 65.
    Supply Chain InsightsLLC Copyright © 2014, p. 65 About Lora Cecere • Founder of Supply Chain Insights • Invited to be a “LinkedIn Influencer” • Invited to write a guest blog for Forbes • Author of 2 books: Bricks Matter (2012) and Metrics That Matter (to publish Fall of 2014) • Partner at Altimeter Group (leader in open research) • 7 years of Management Experience leading Analyst Teams at Gartner and AMR Research • 8 years Experience in Marketing and Selling Supply Chain Software at Descartes Systems Group and Manugistics (now JDA) • 15 Years Leading teams in Manufacturing and Distribution operations for Clorox, Kraft/General Foods, Nestle/Dreyers Grand Ice Cream and Procter & Gamble. Contact Information: • Email: lora.cecere@supplychaininsights.com • Blog: www.supplychainshaman.com (6000 pageviews/month) • Forbes: http://www.forbes.com/search/?q=lora+cecere • Twitter: lcecere (4800 followers) • LinkedIn: linkedin.com/pub/lora-cecere/0/196/573 (7000 in the network) #sciwebinar