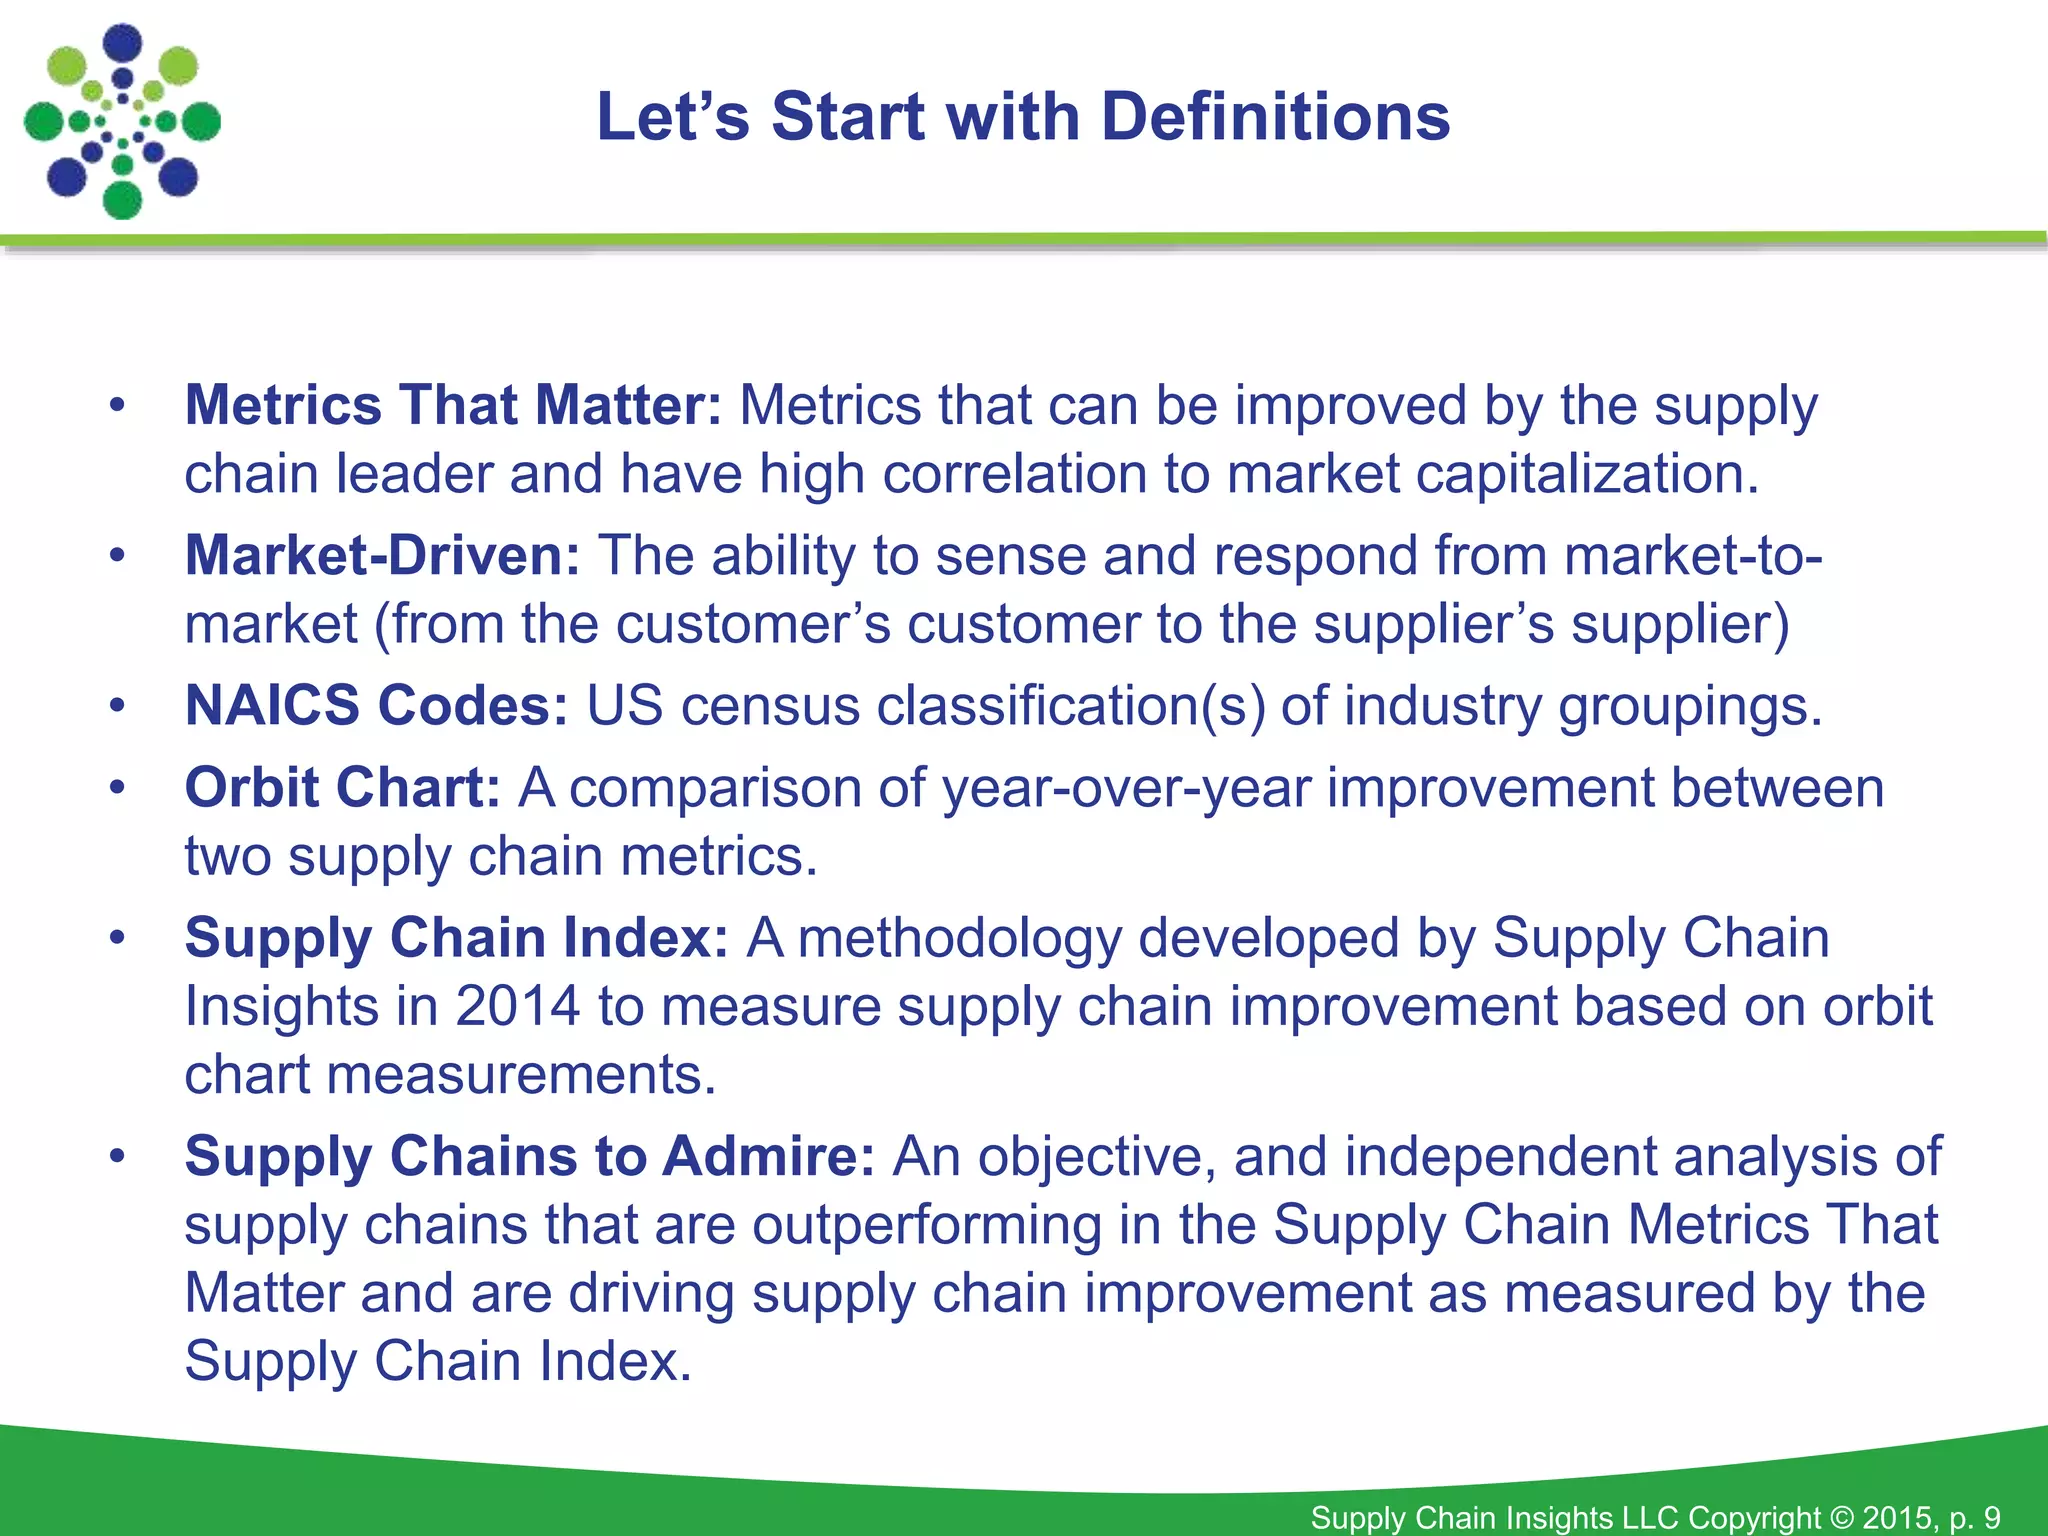
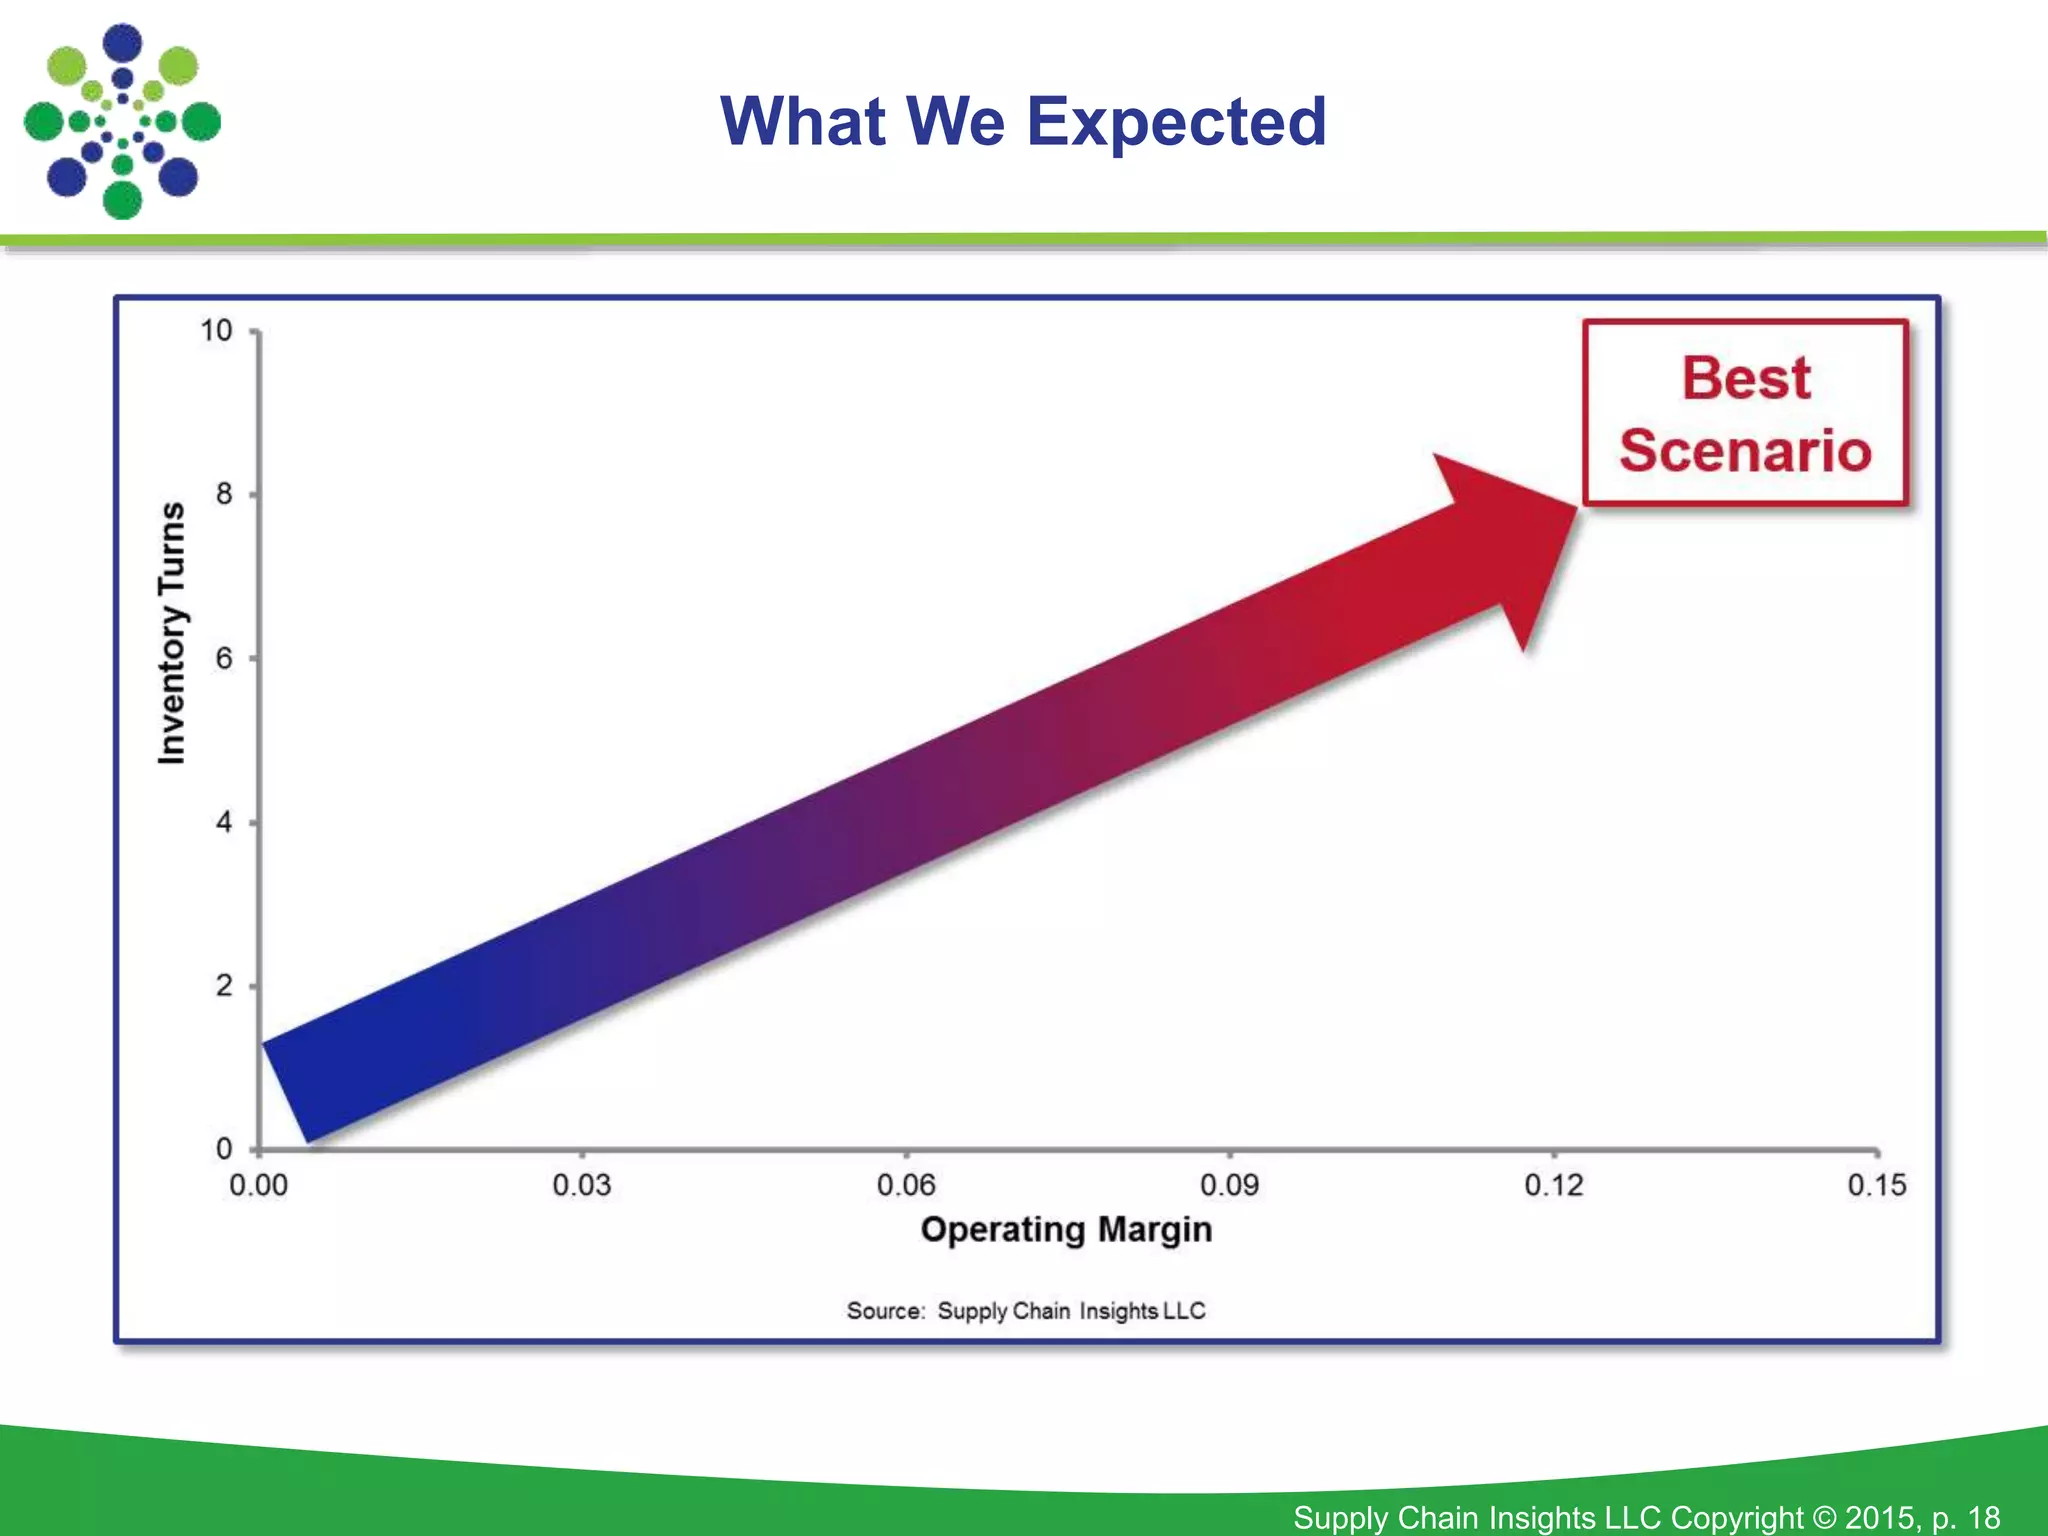
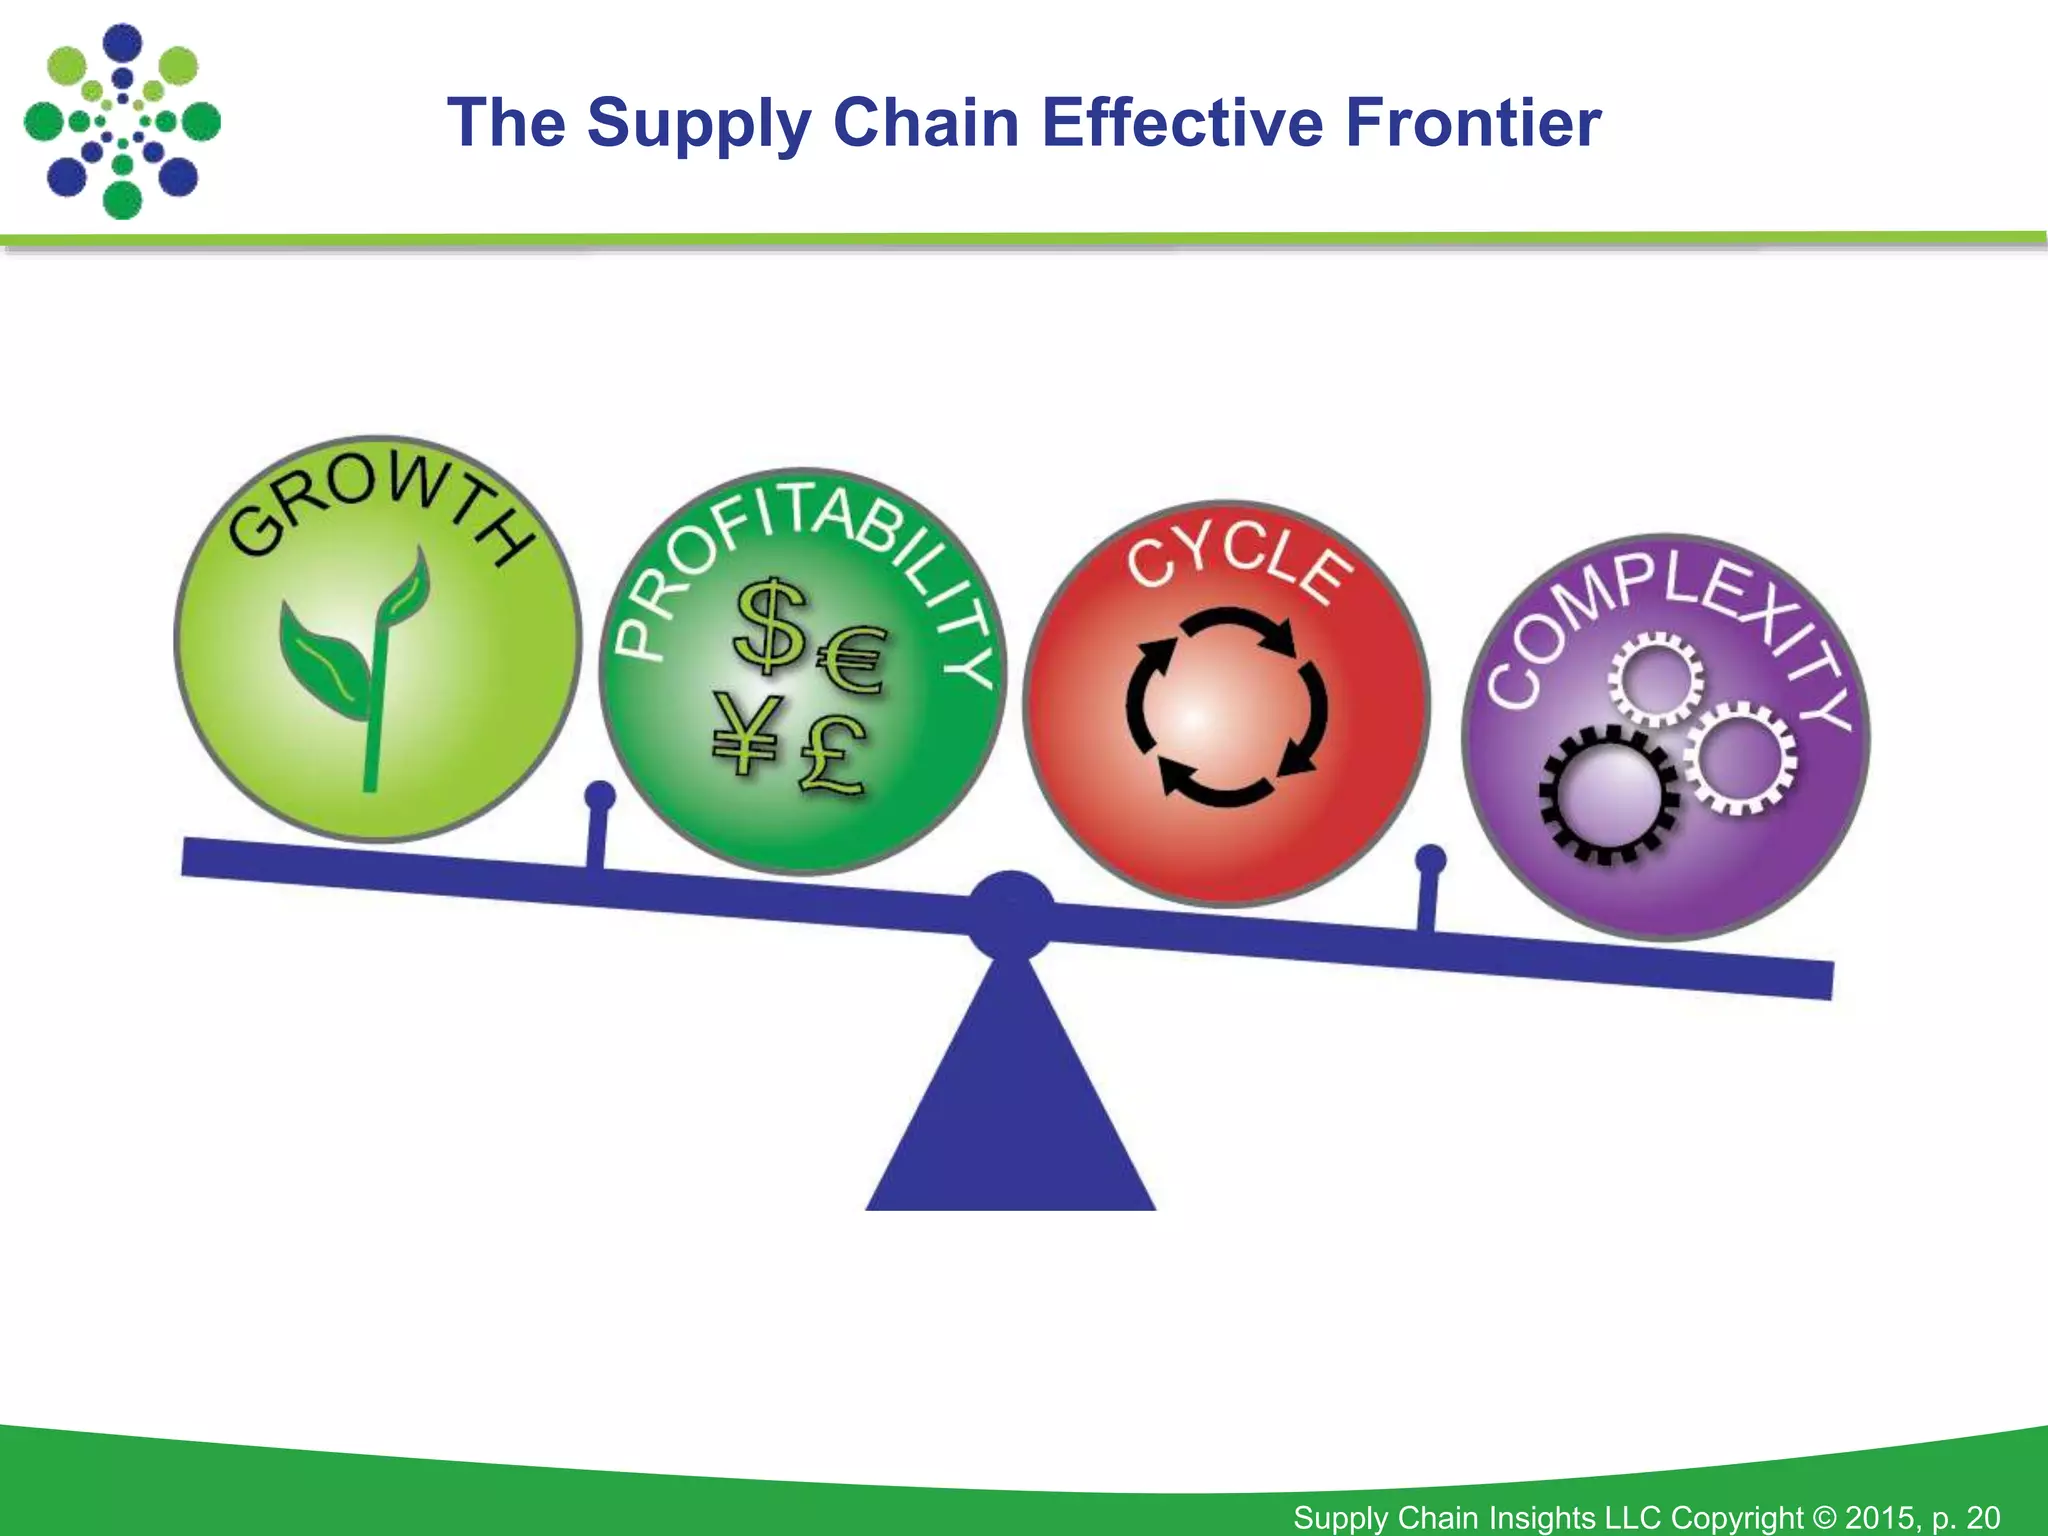
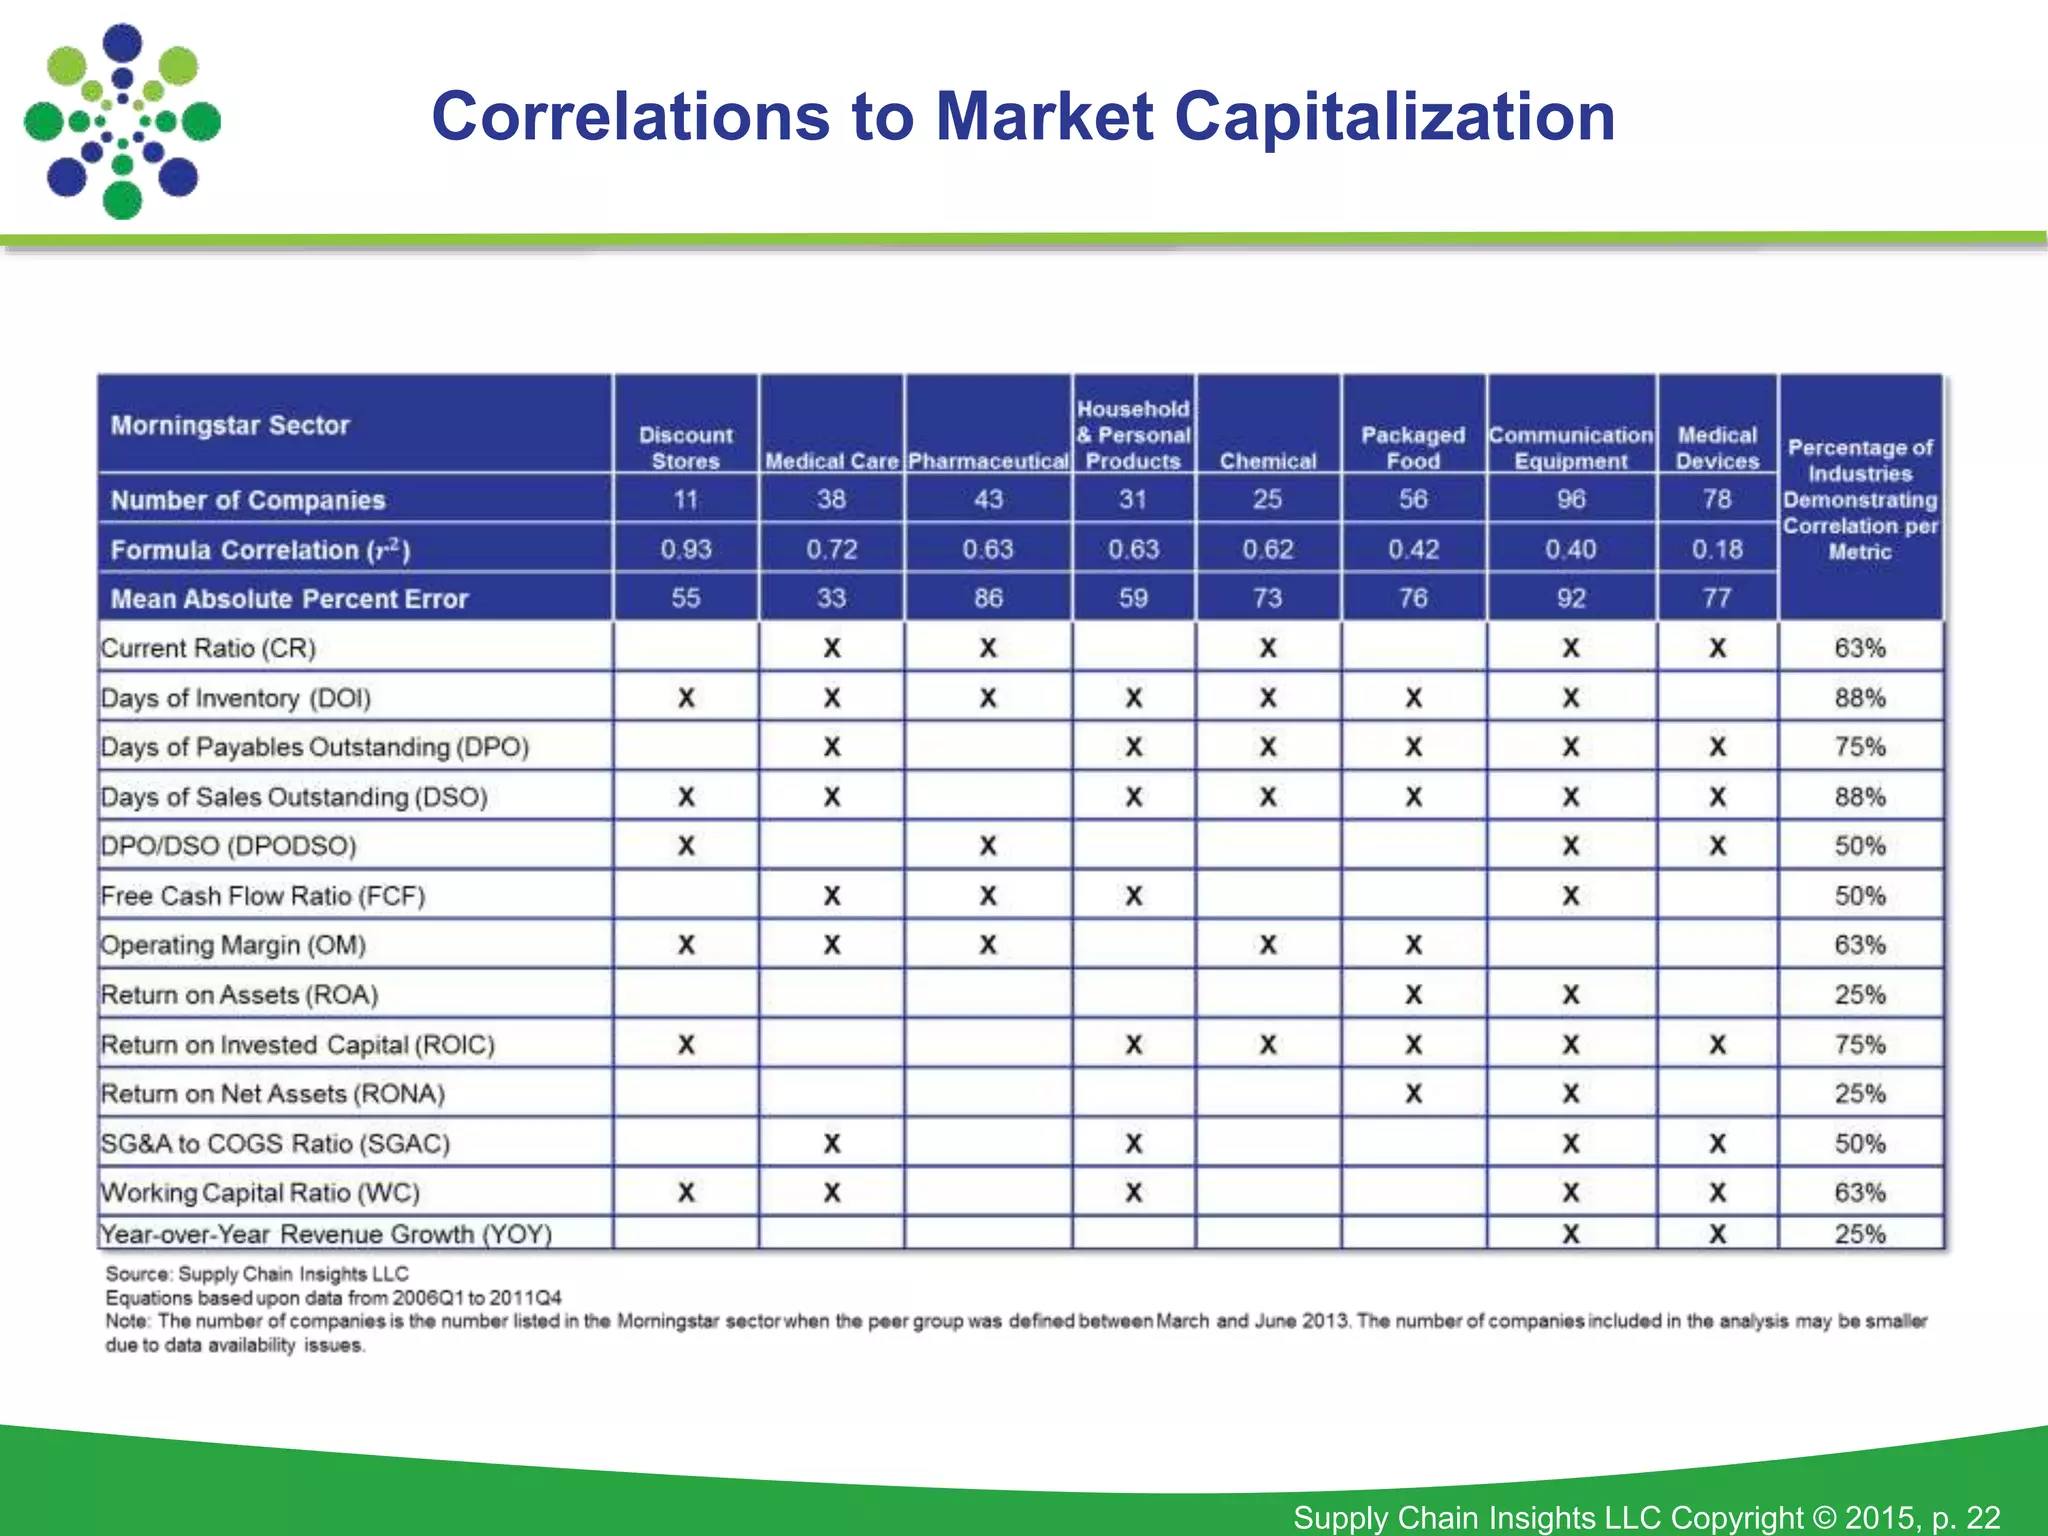
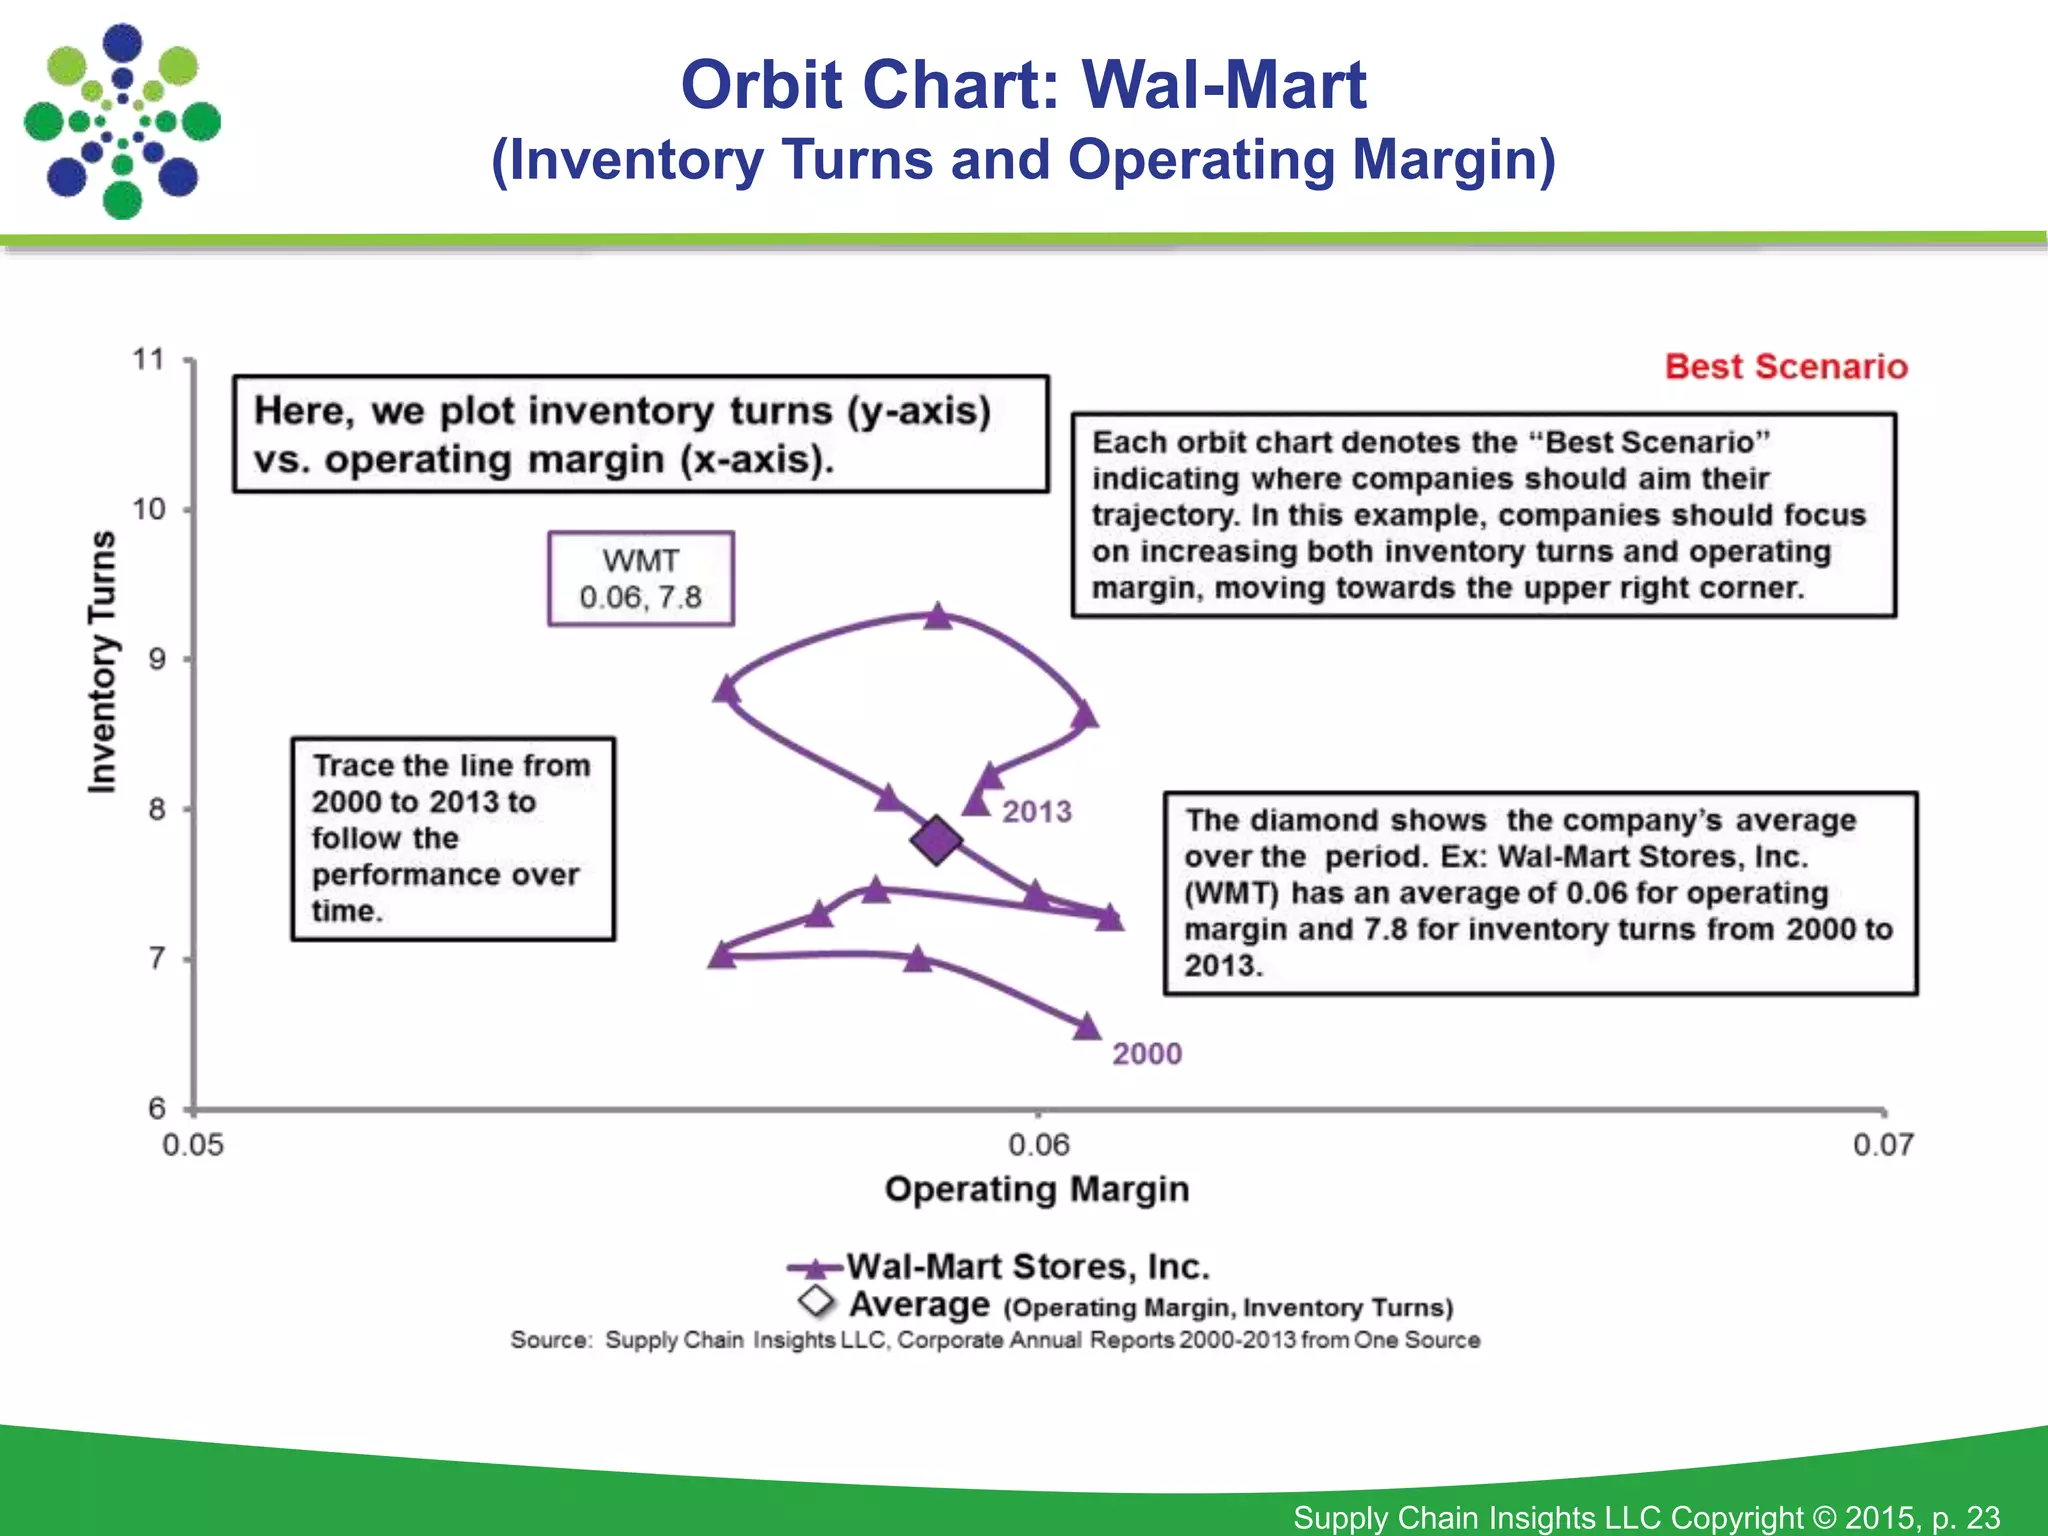
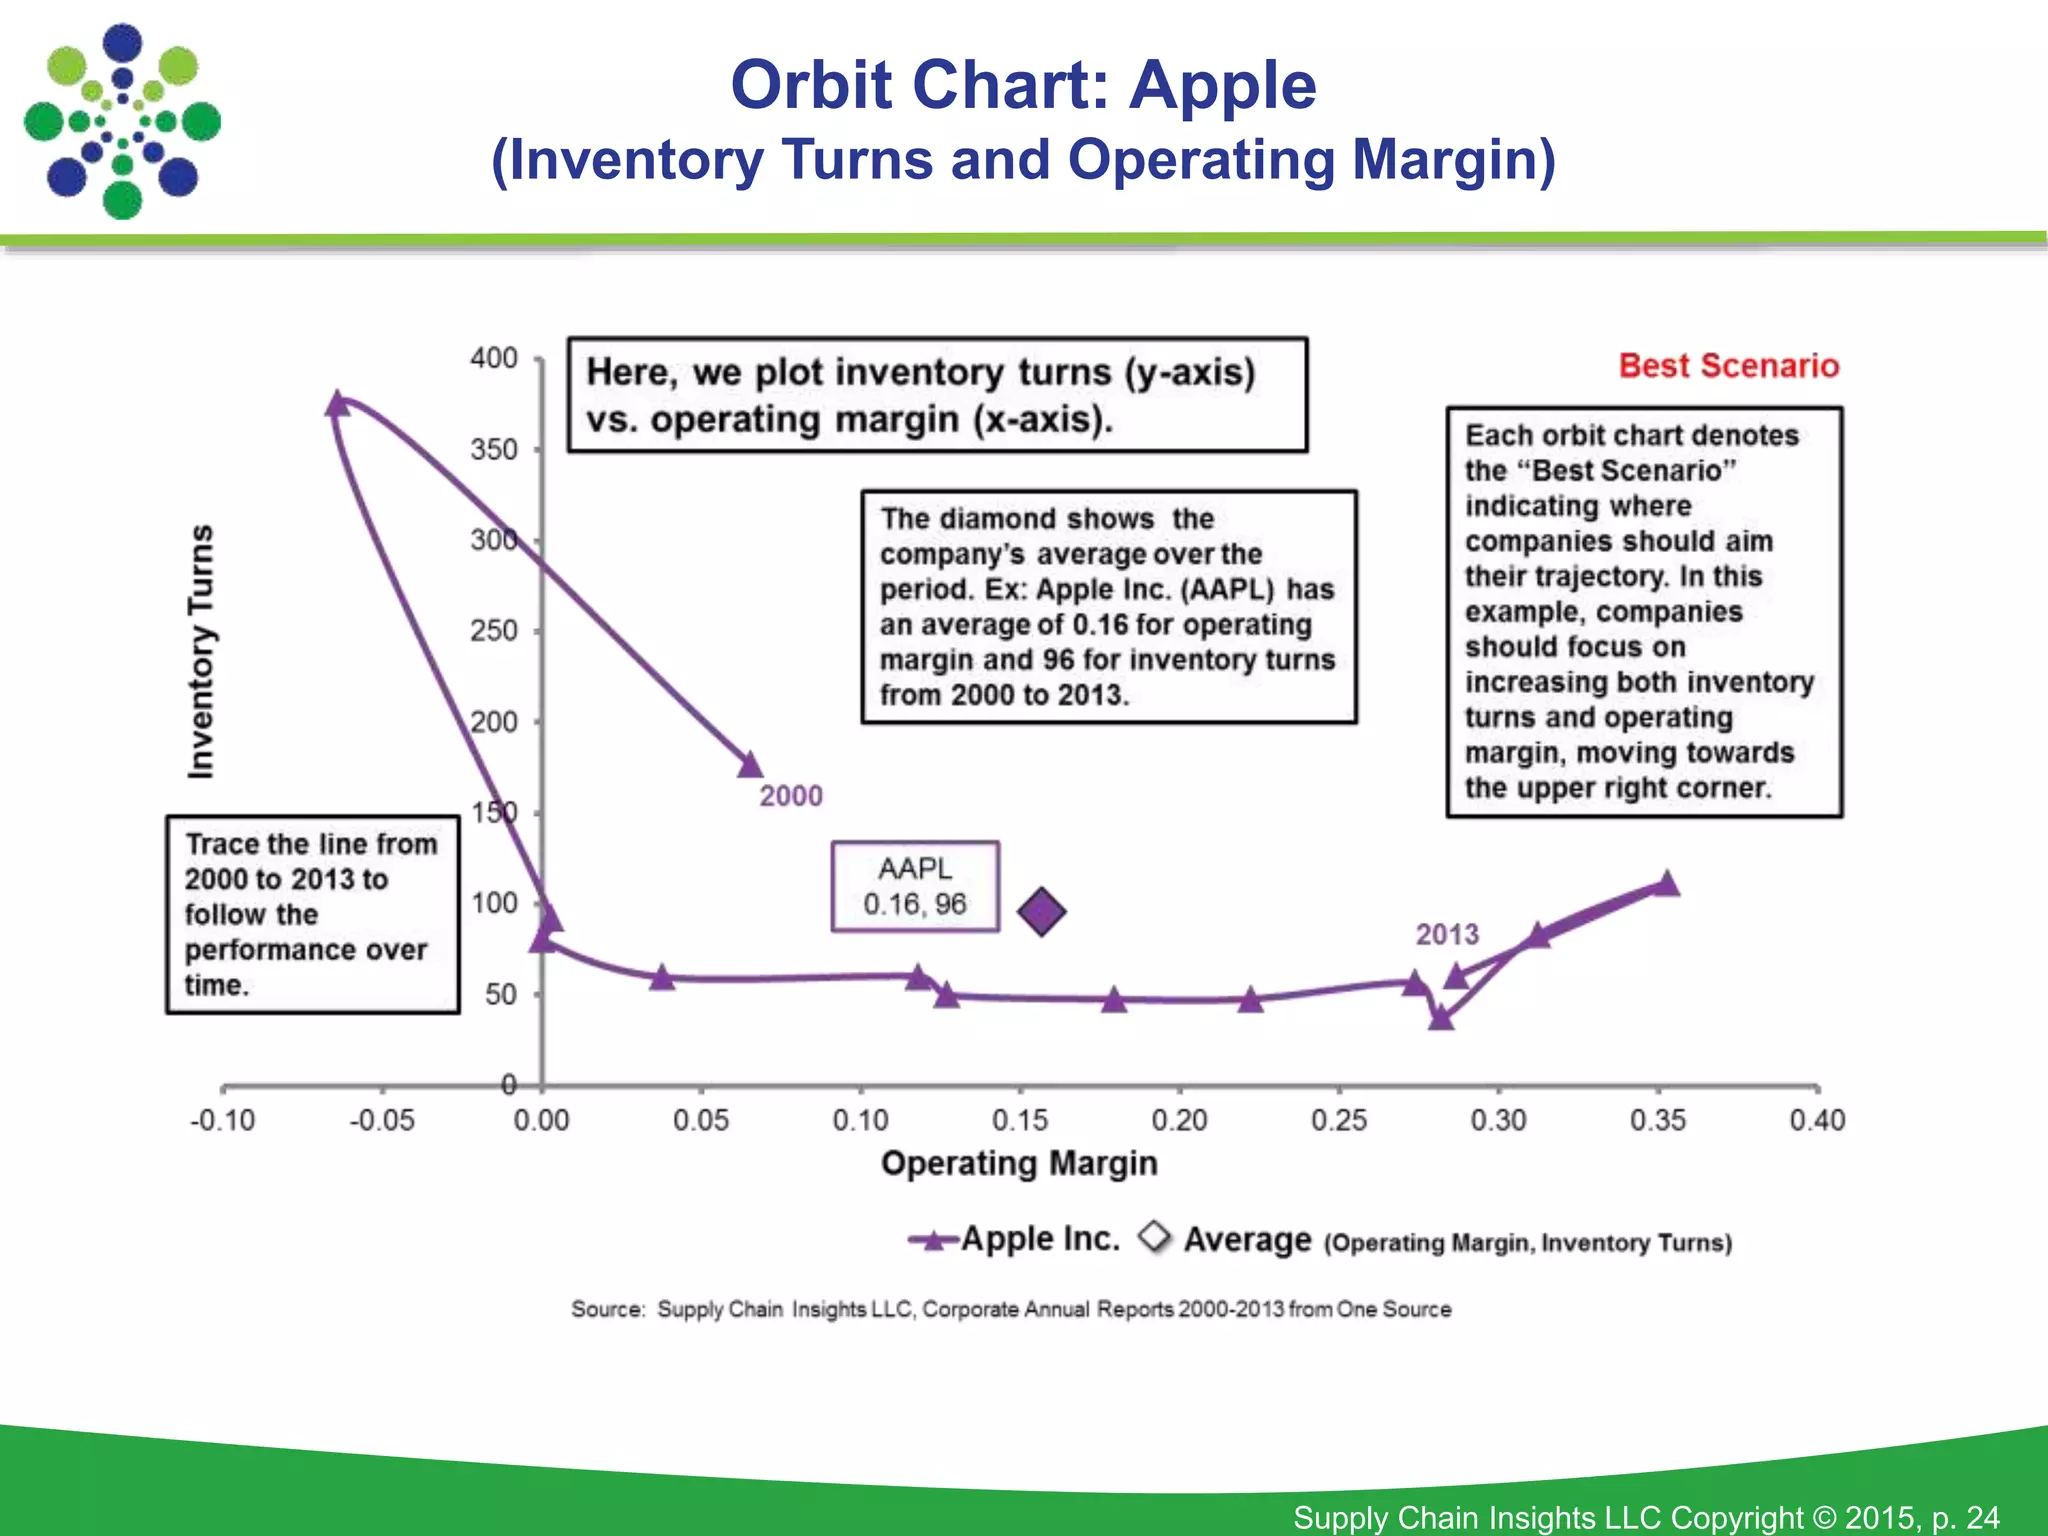
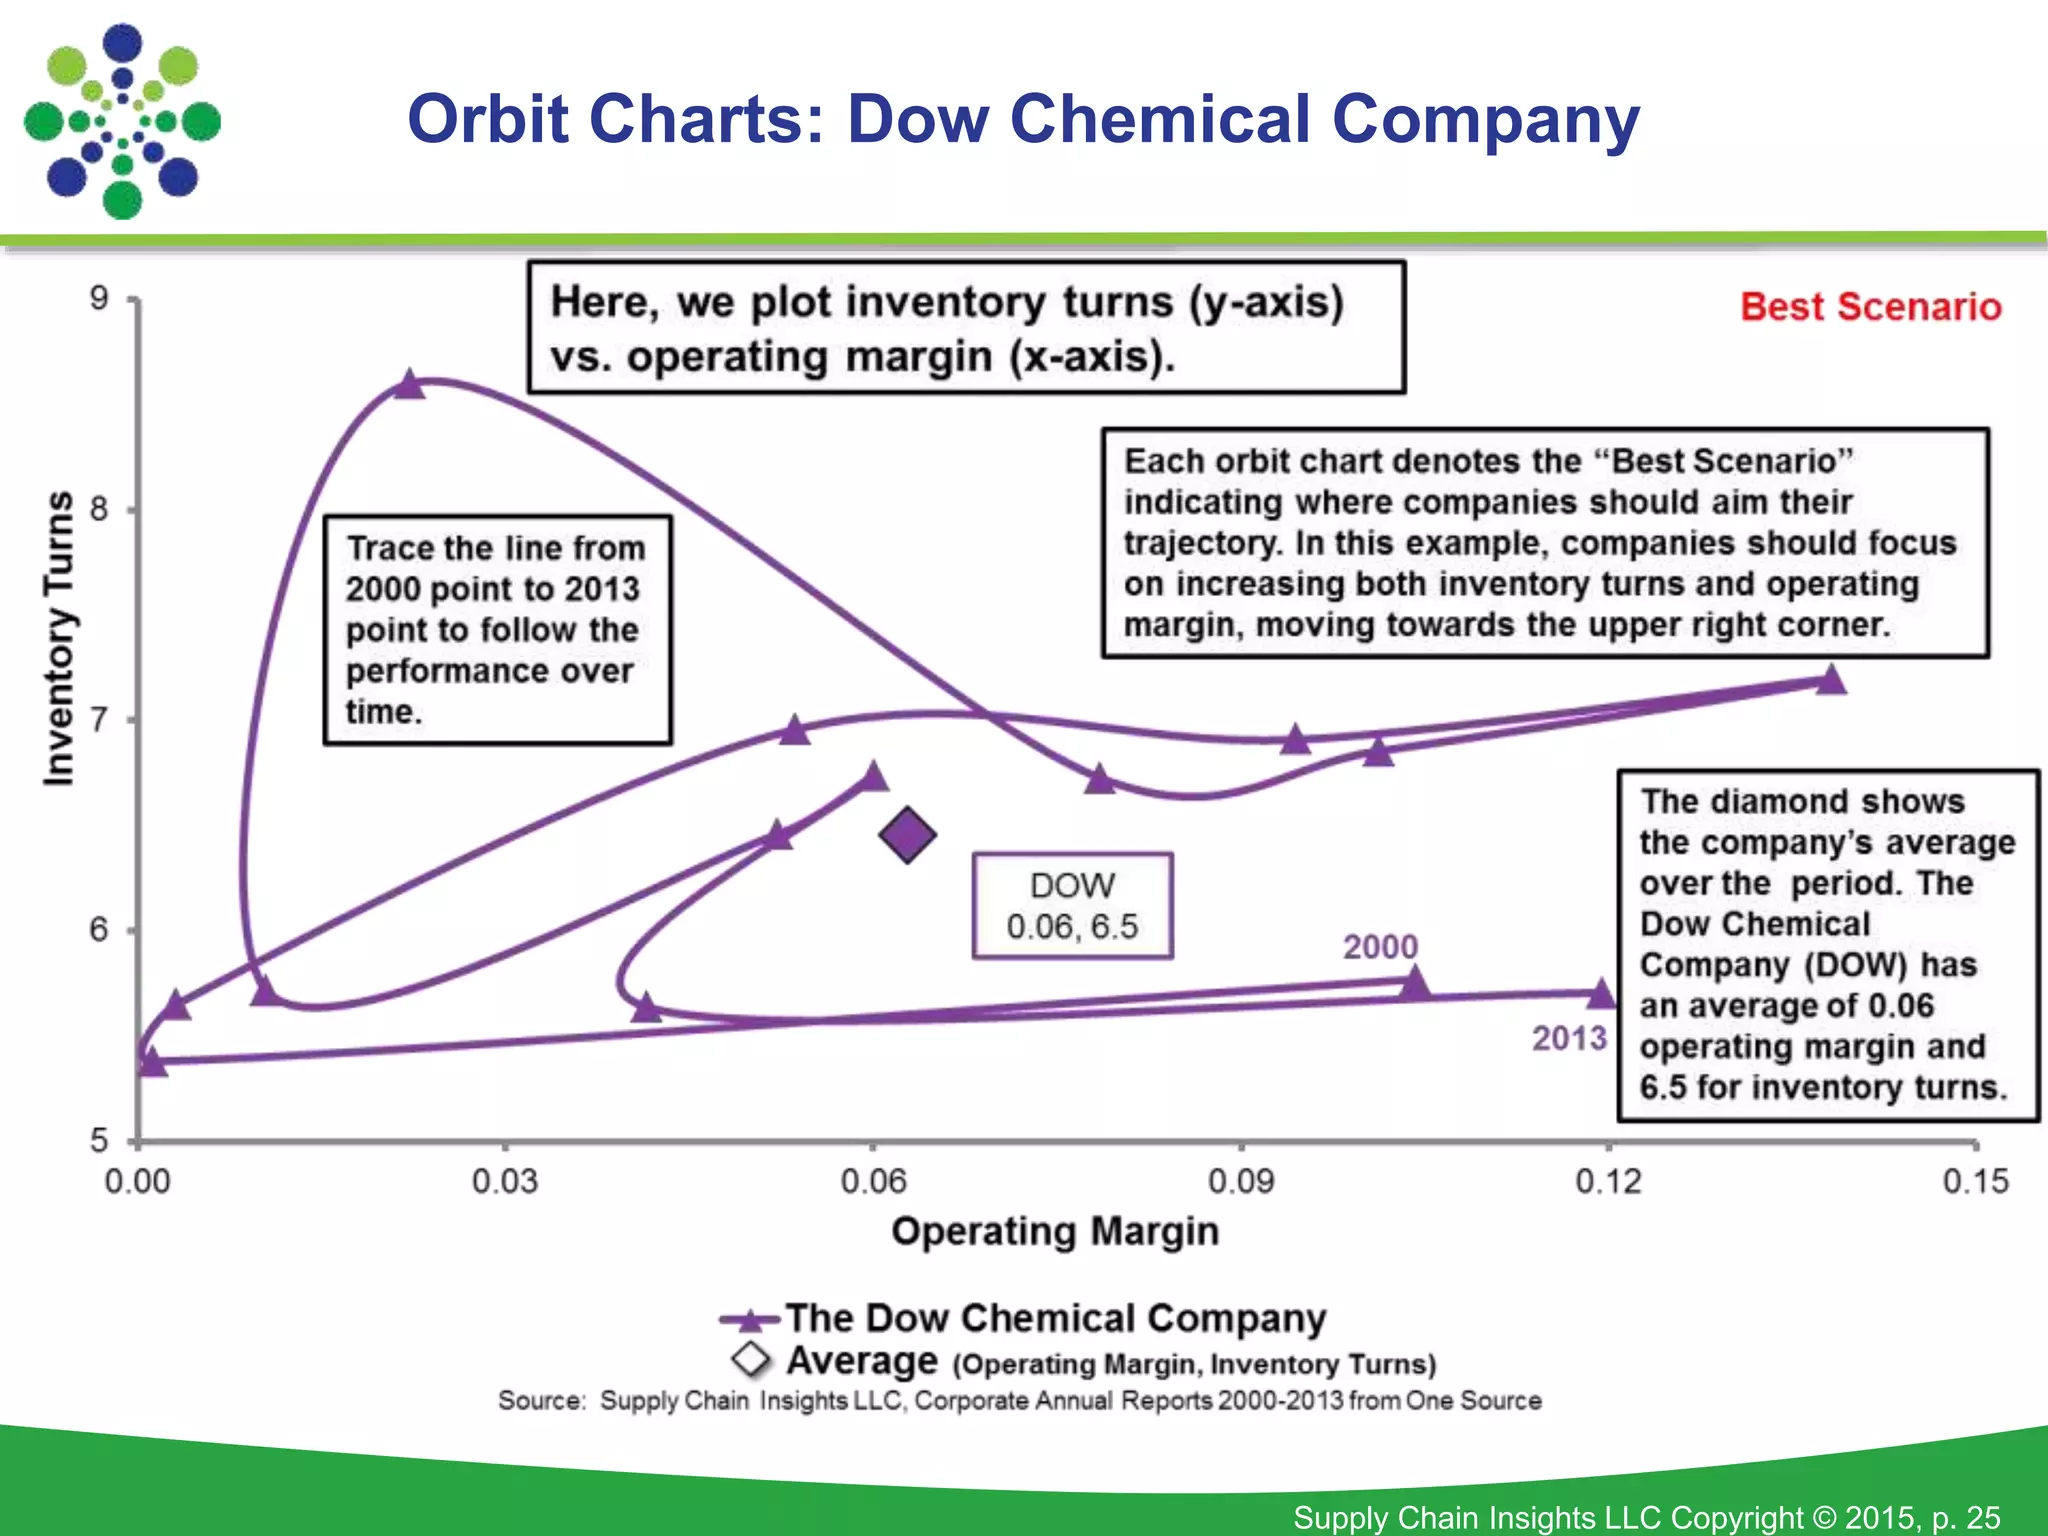
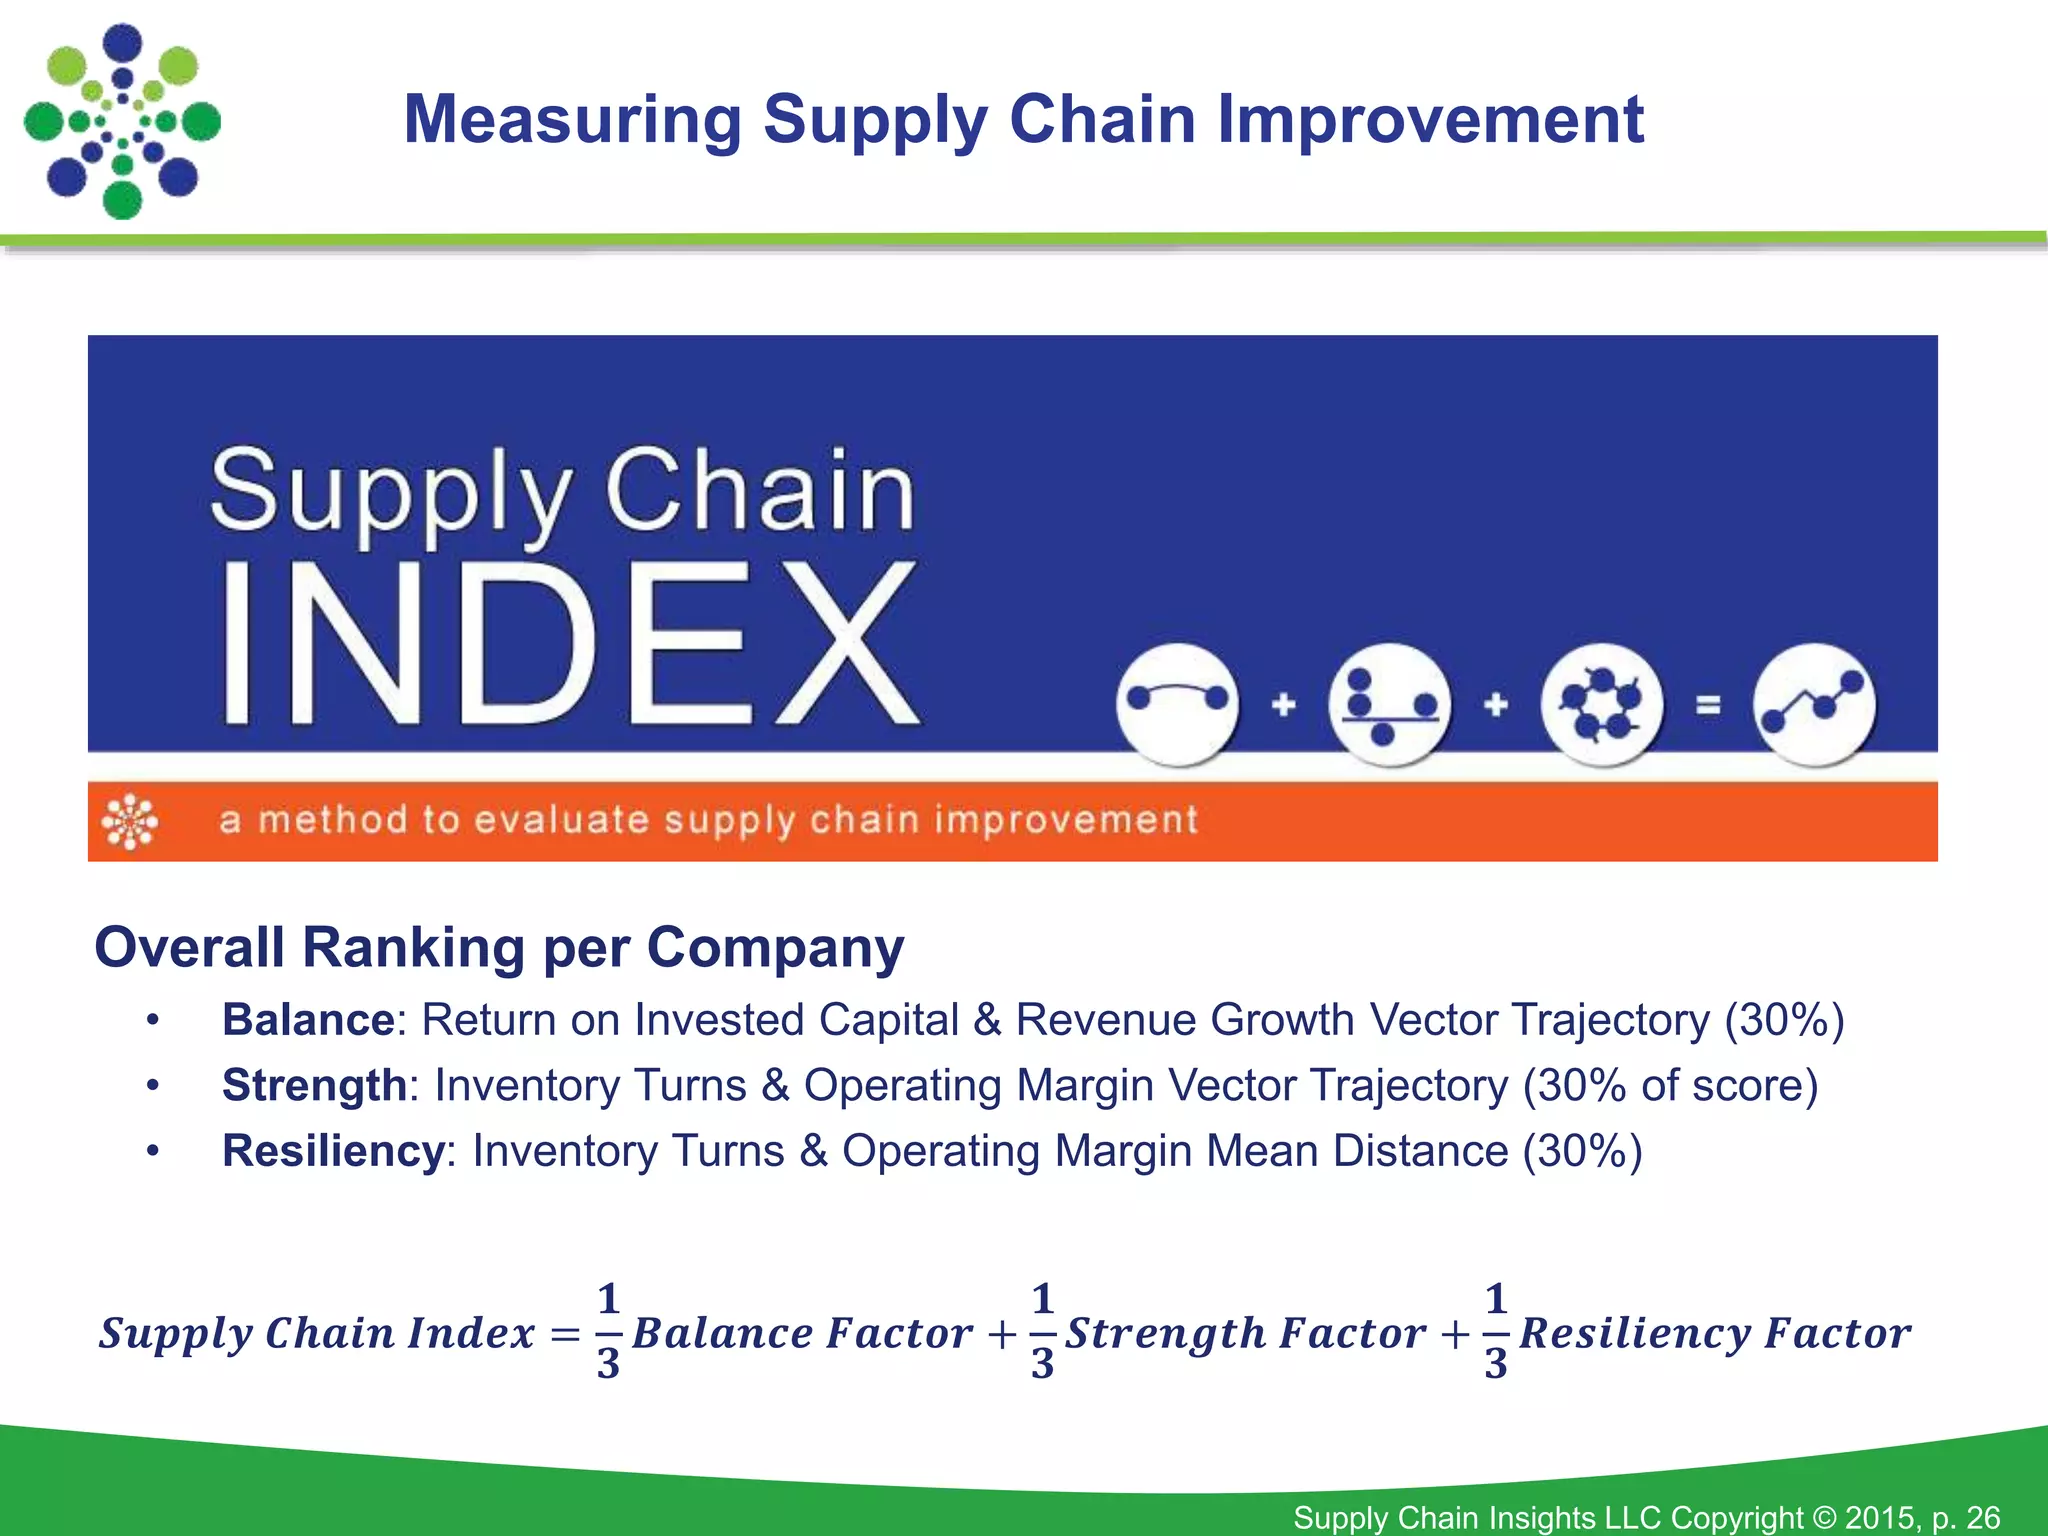
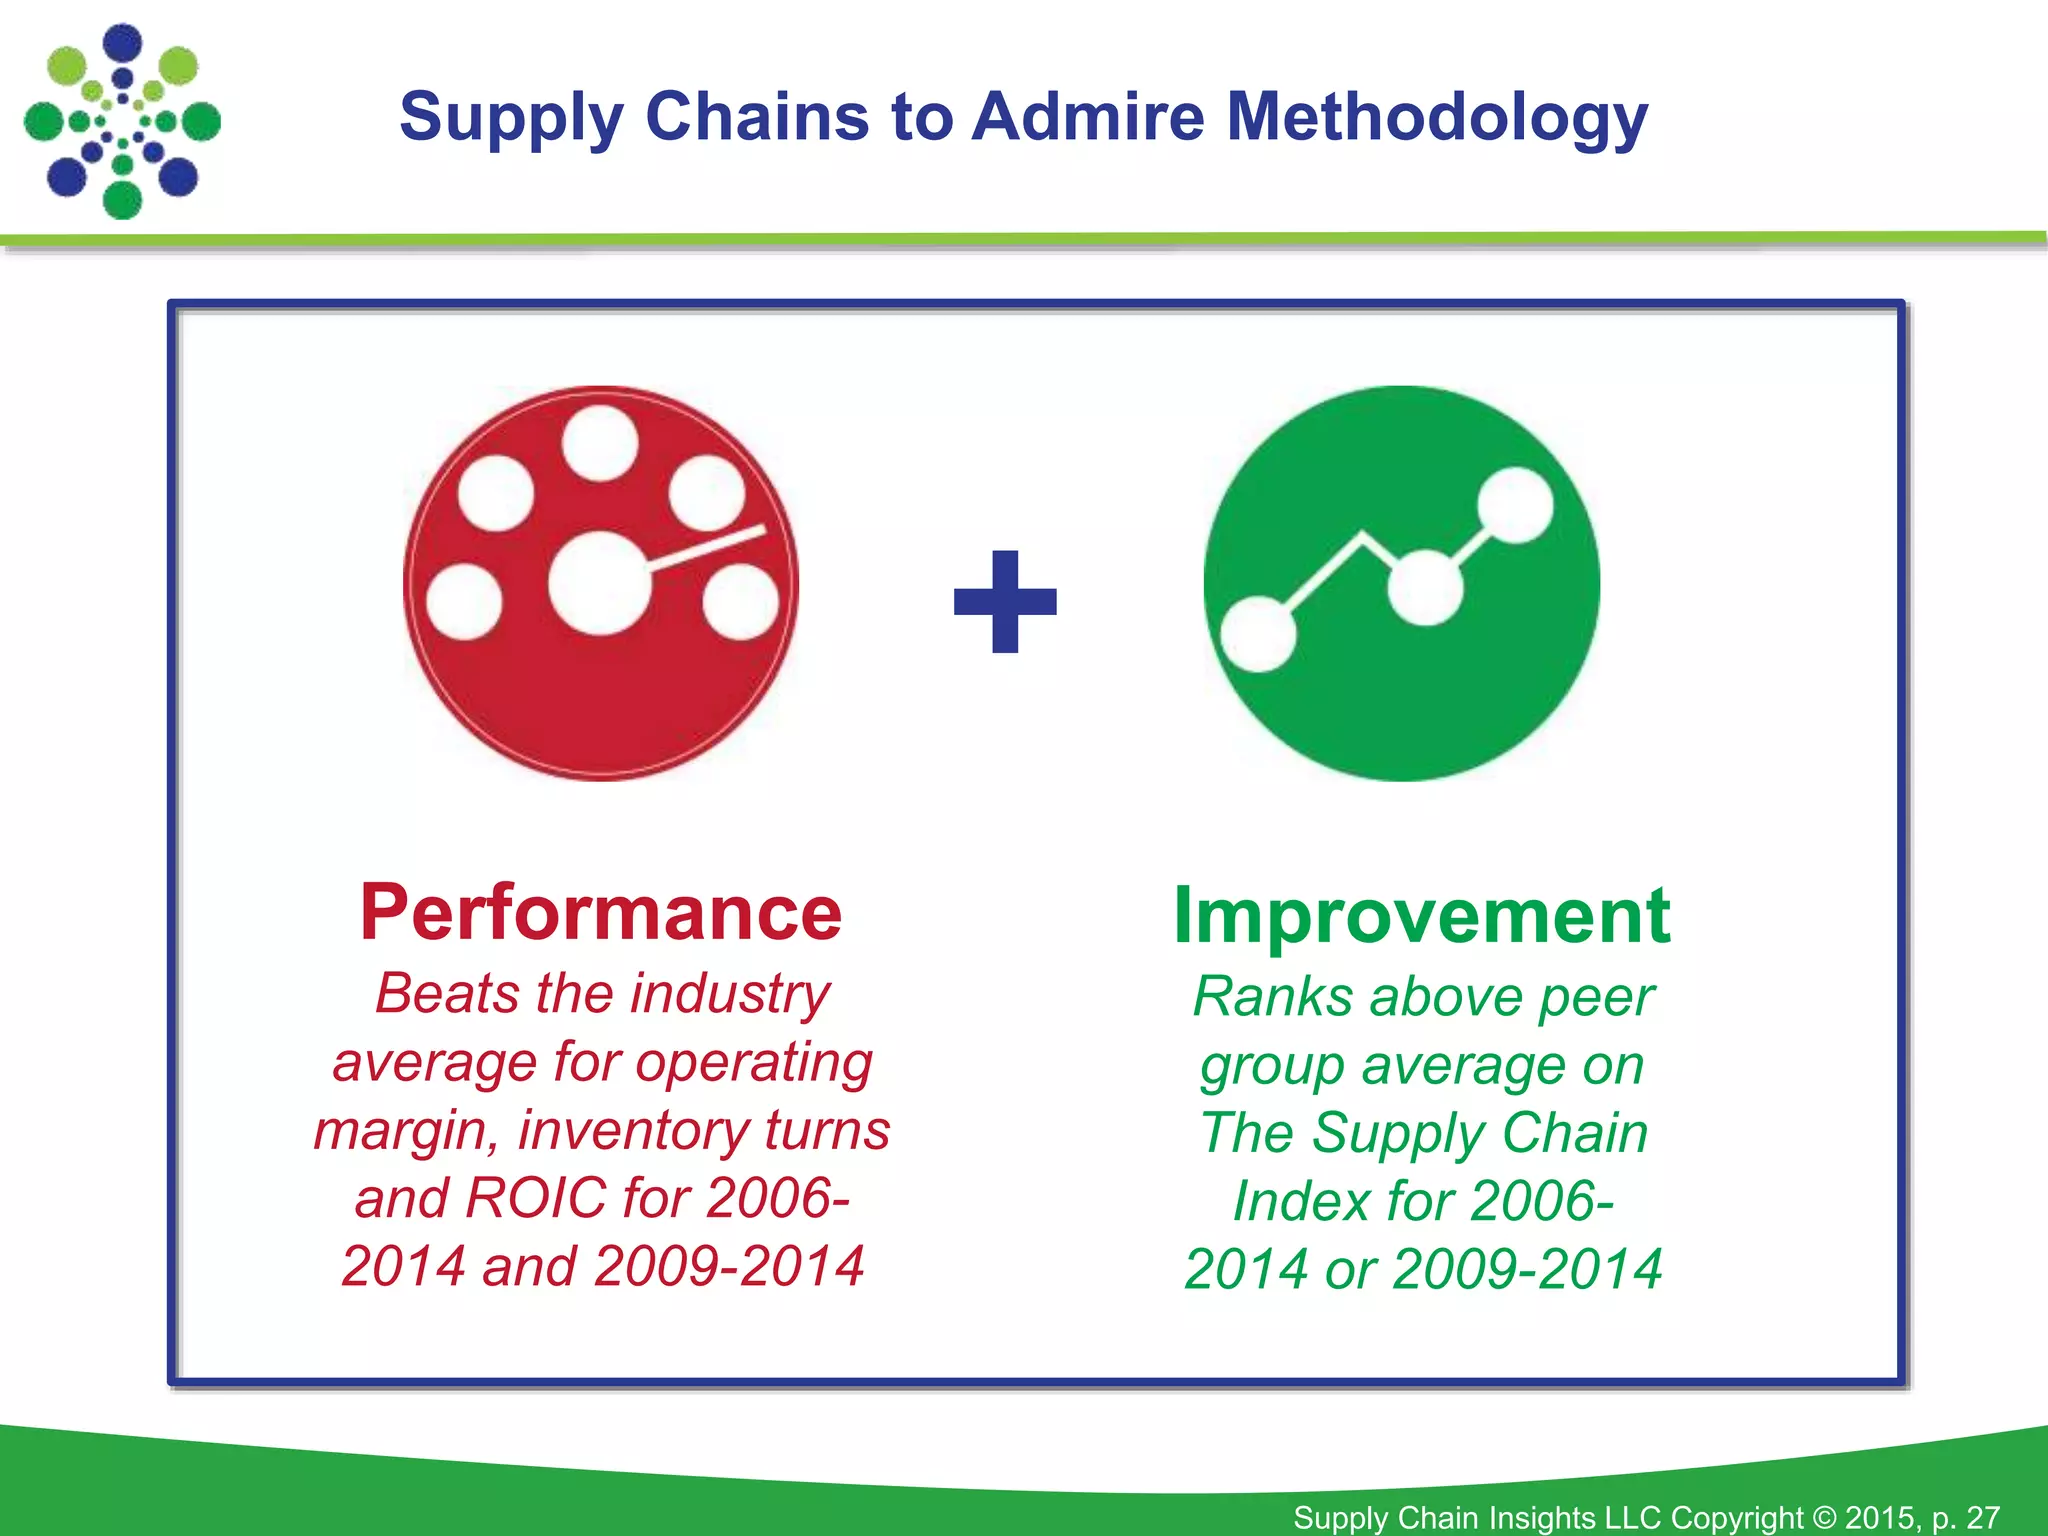
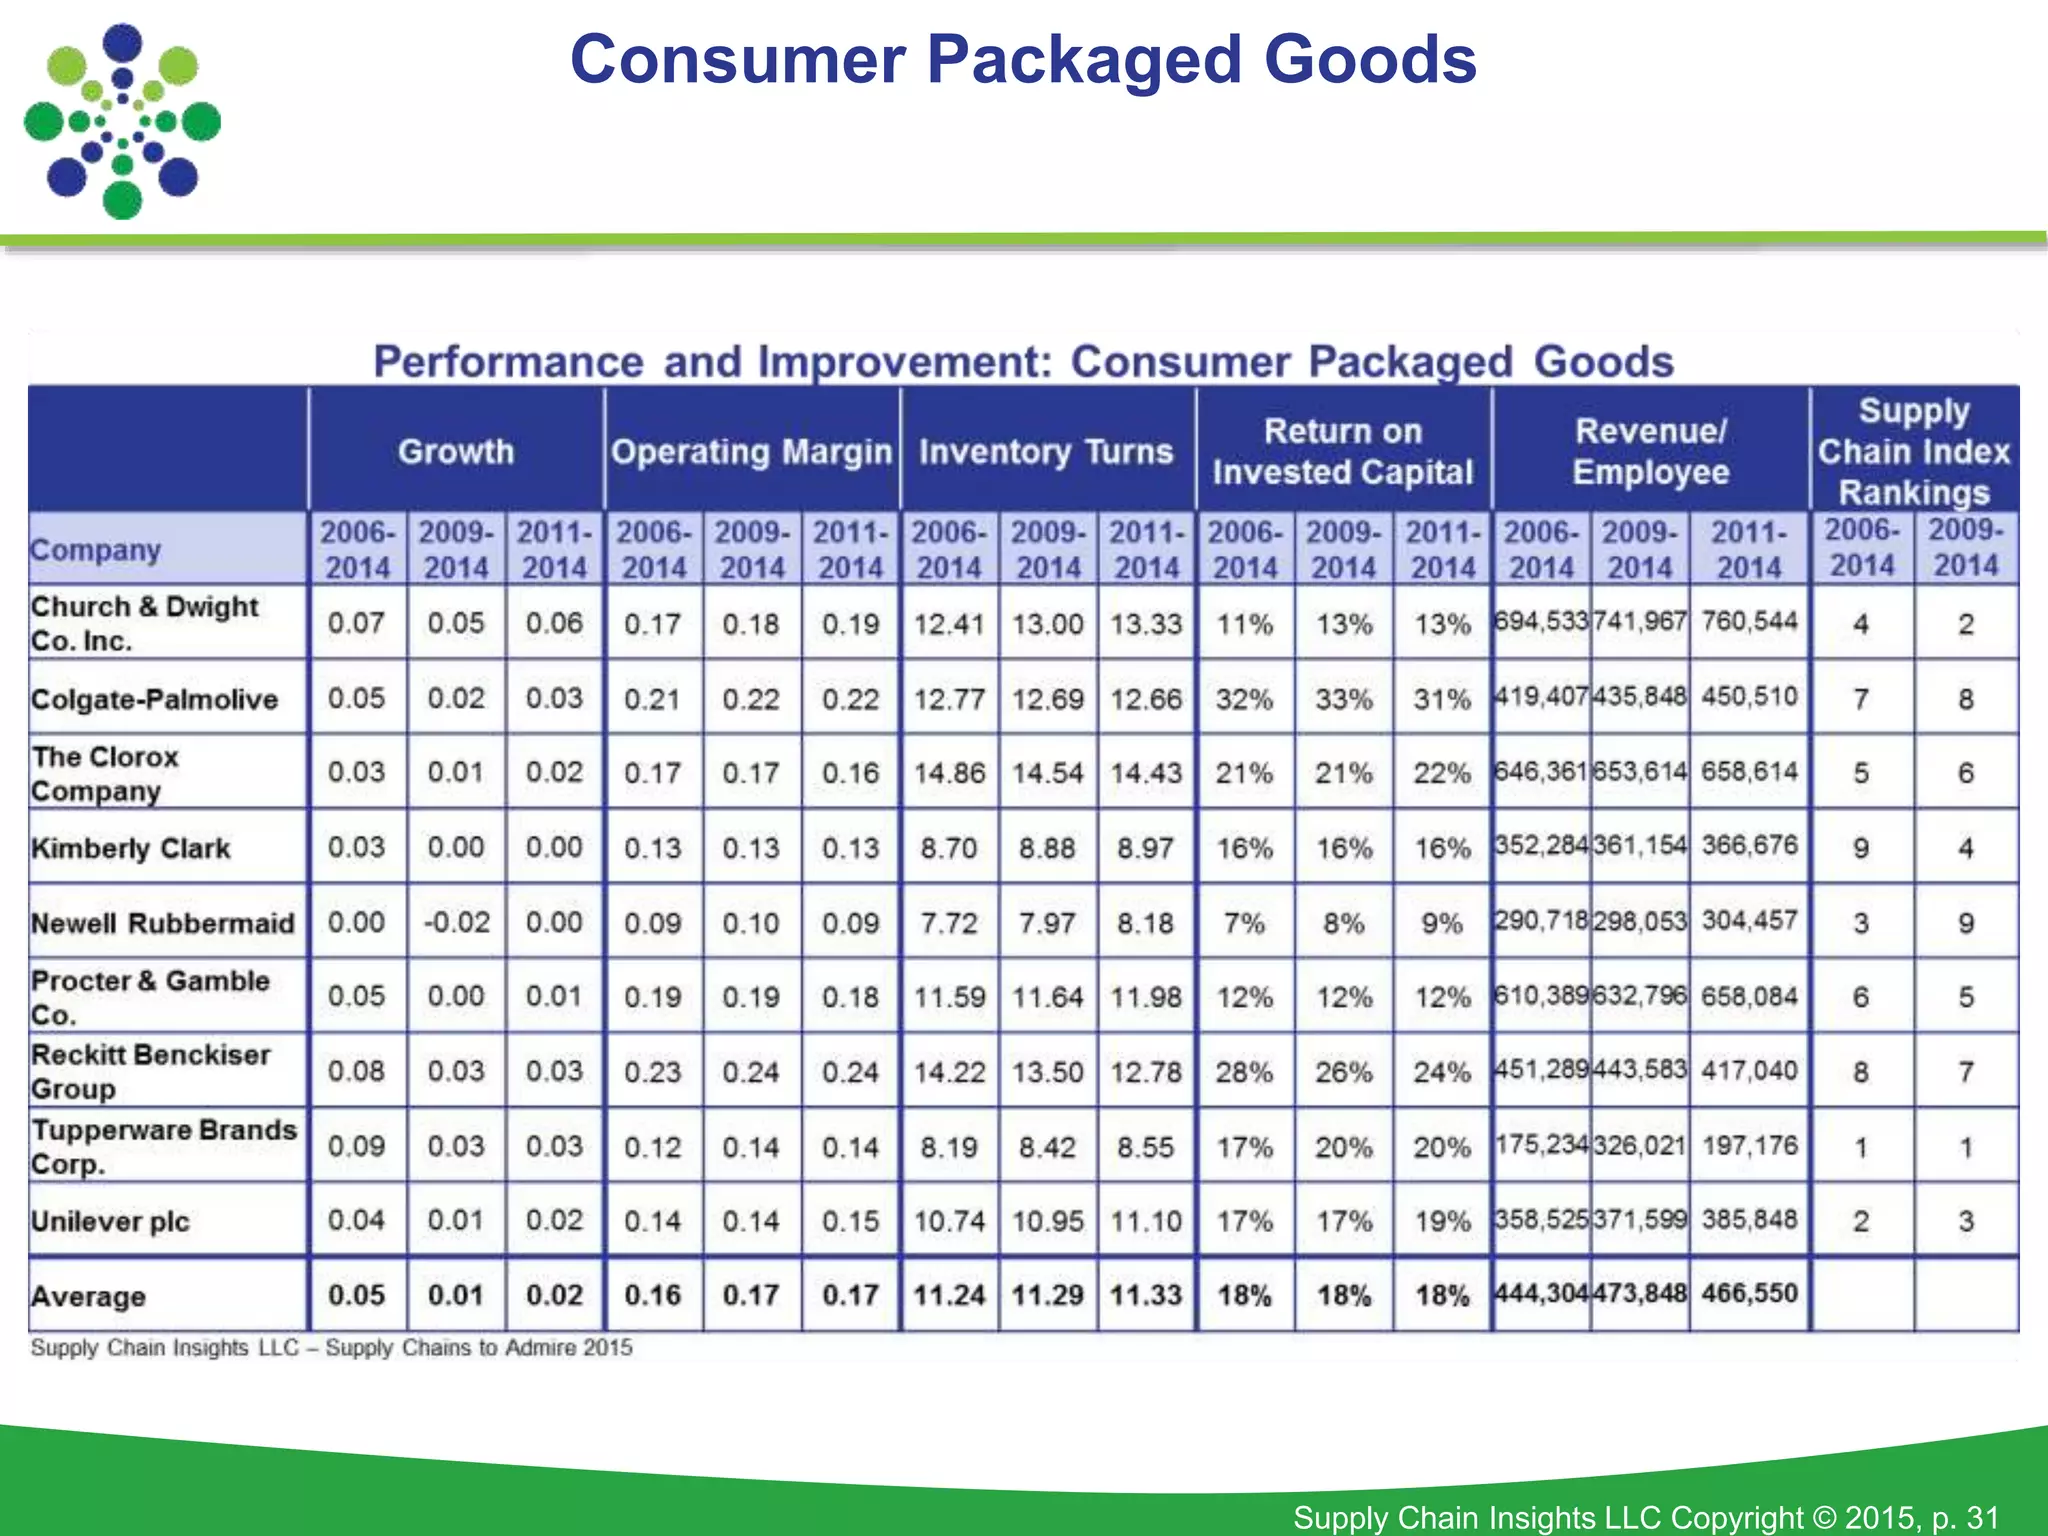
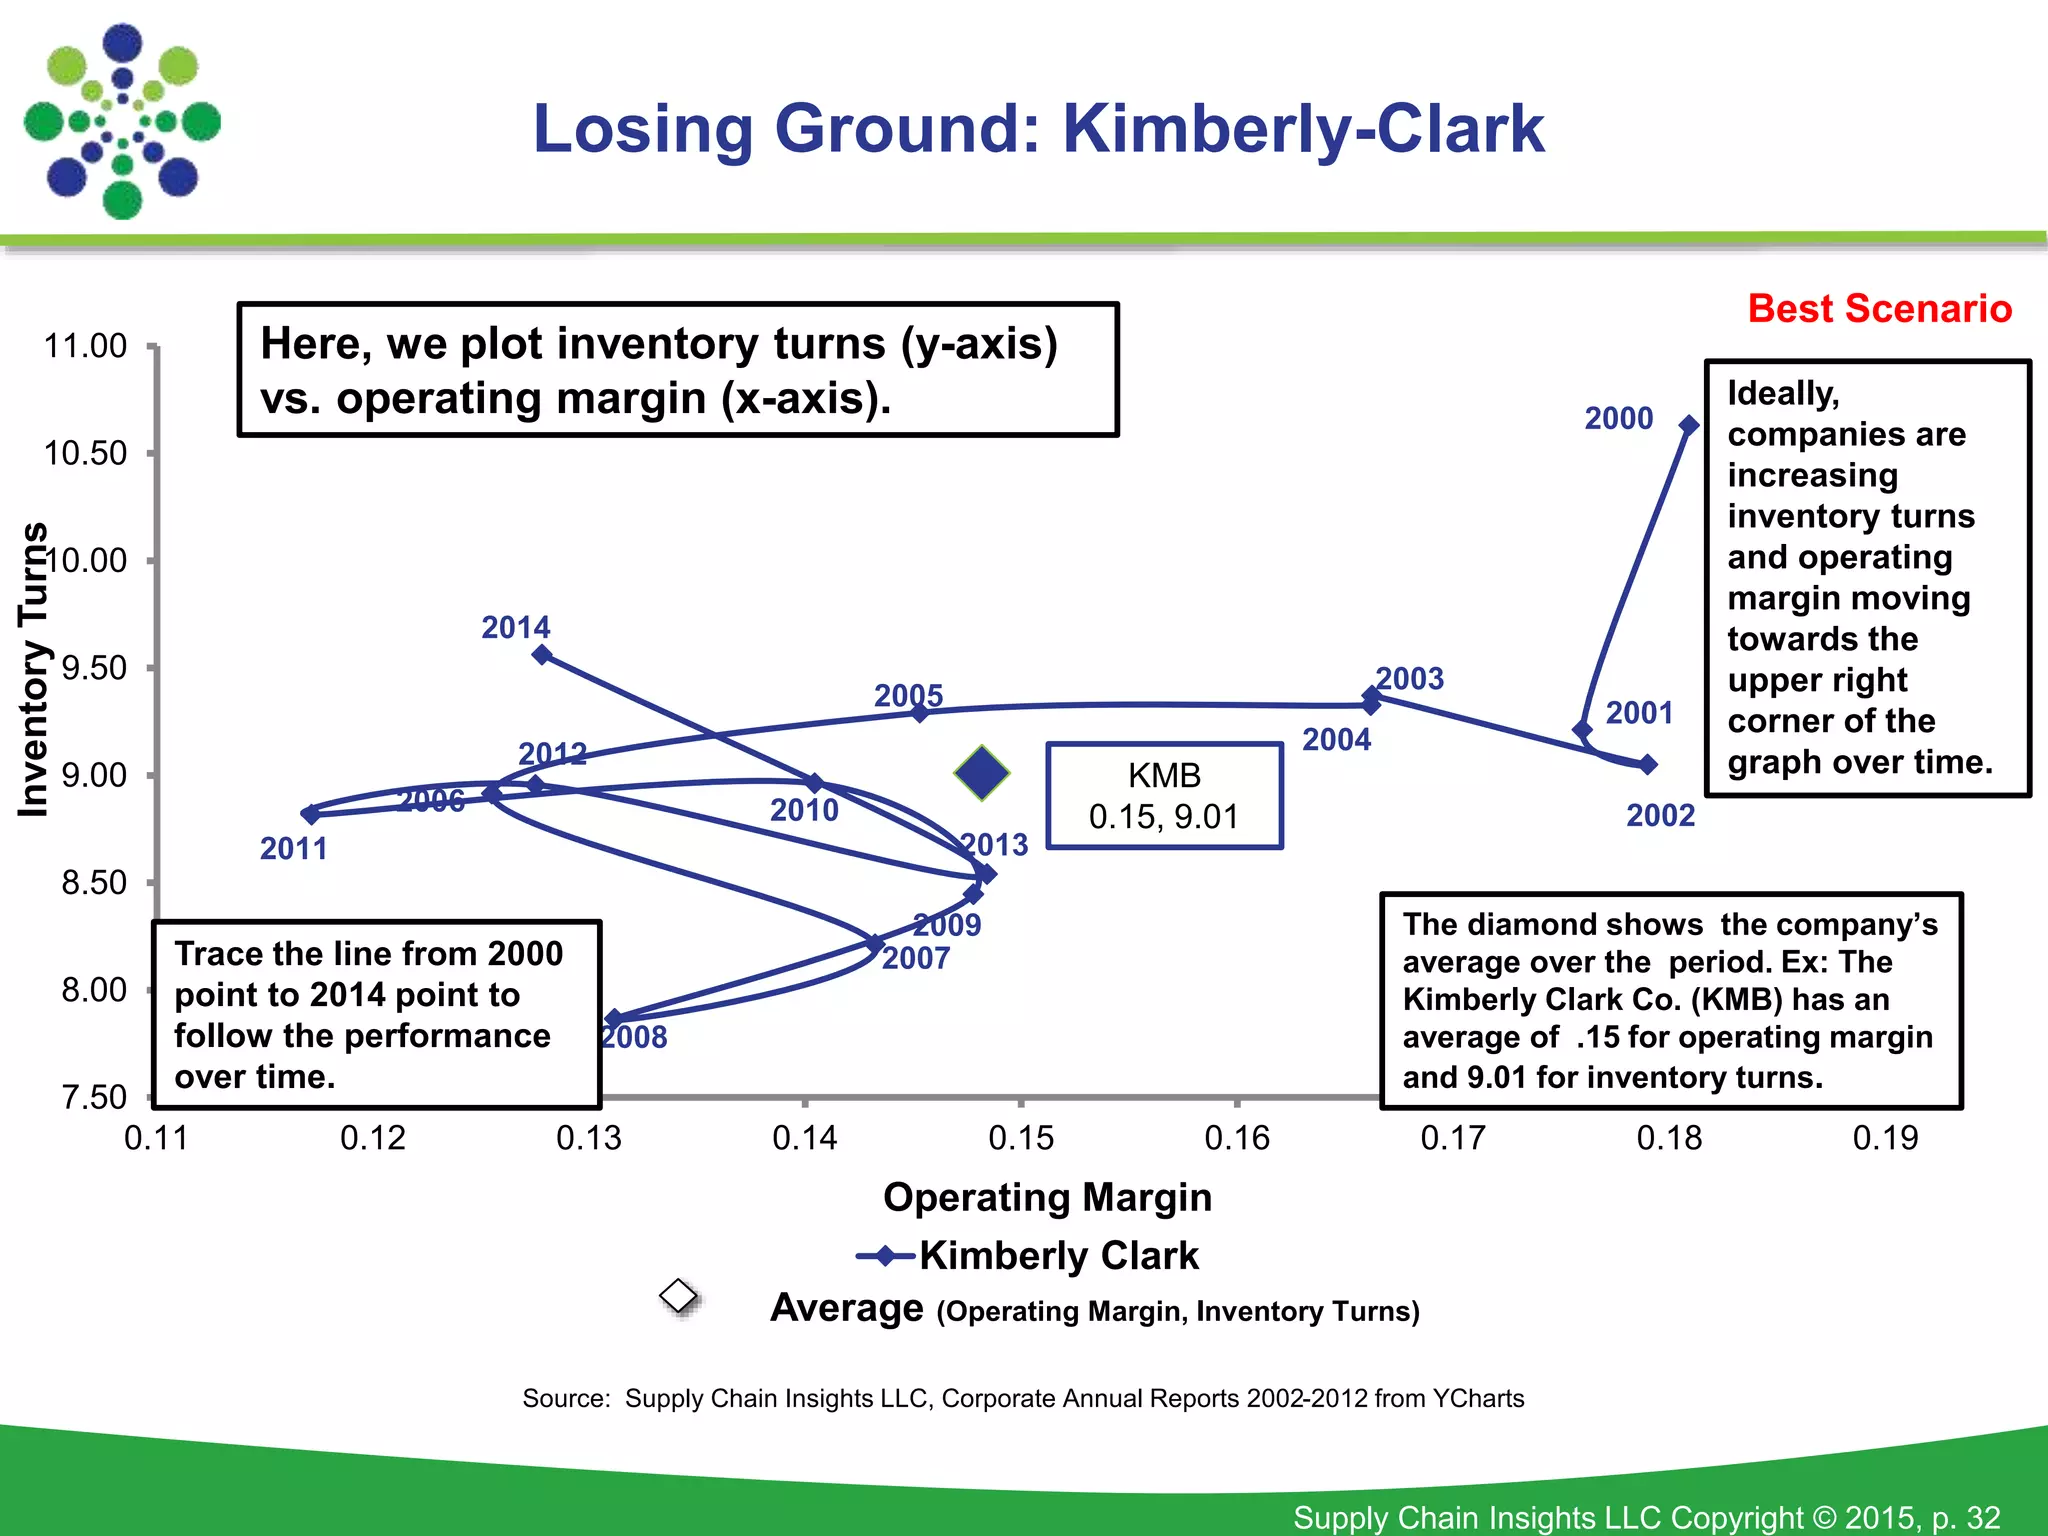
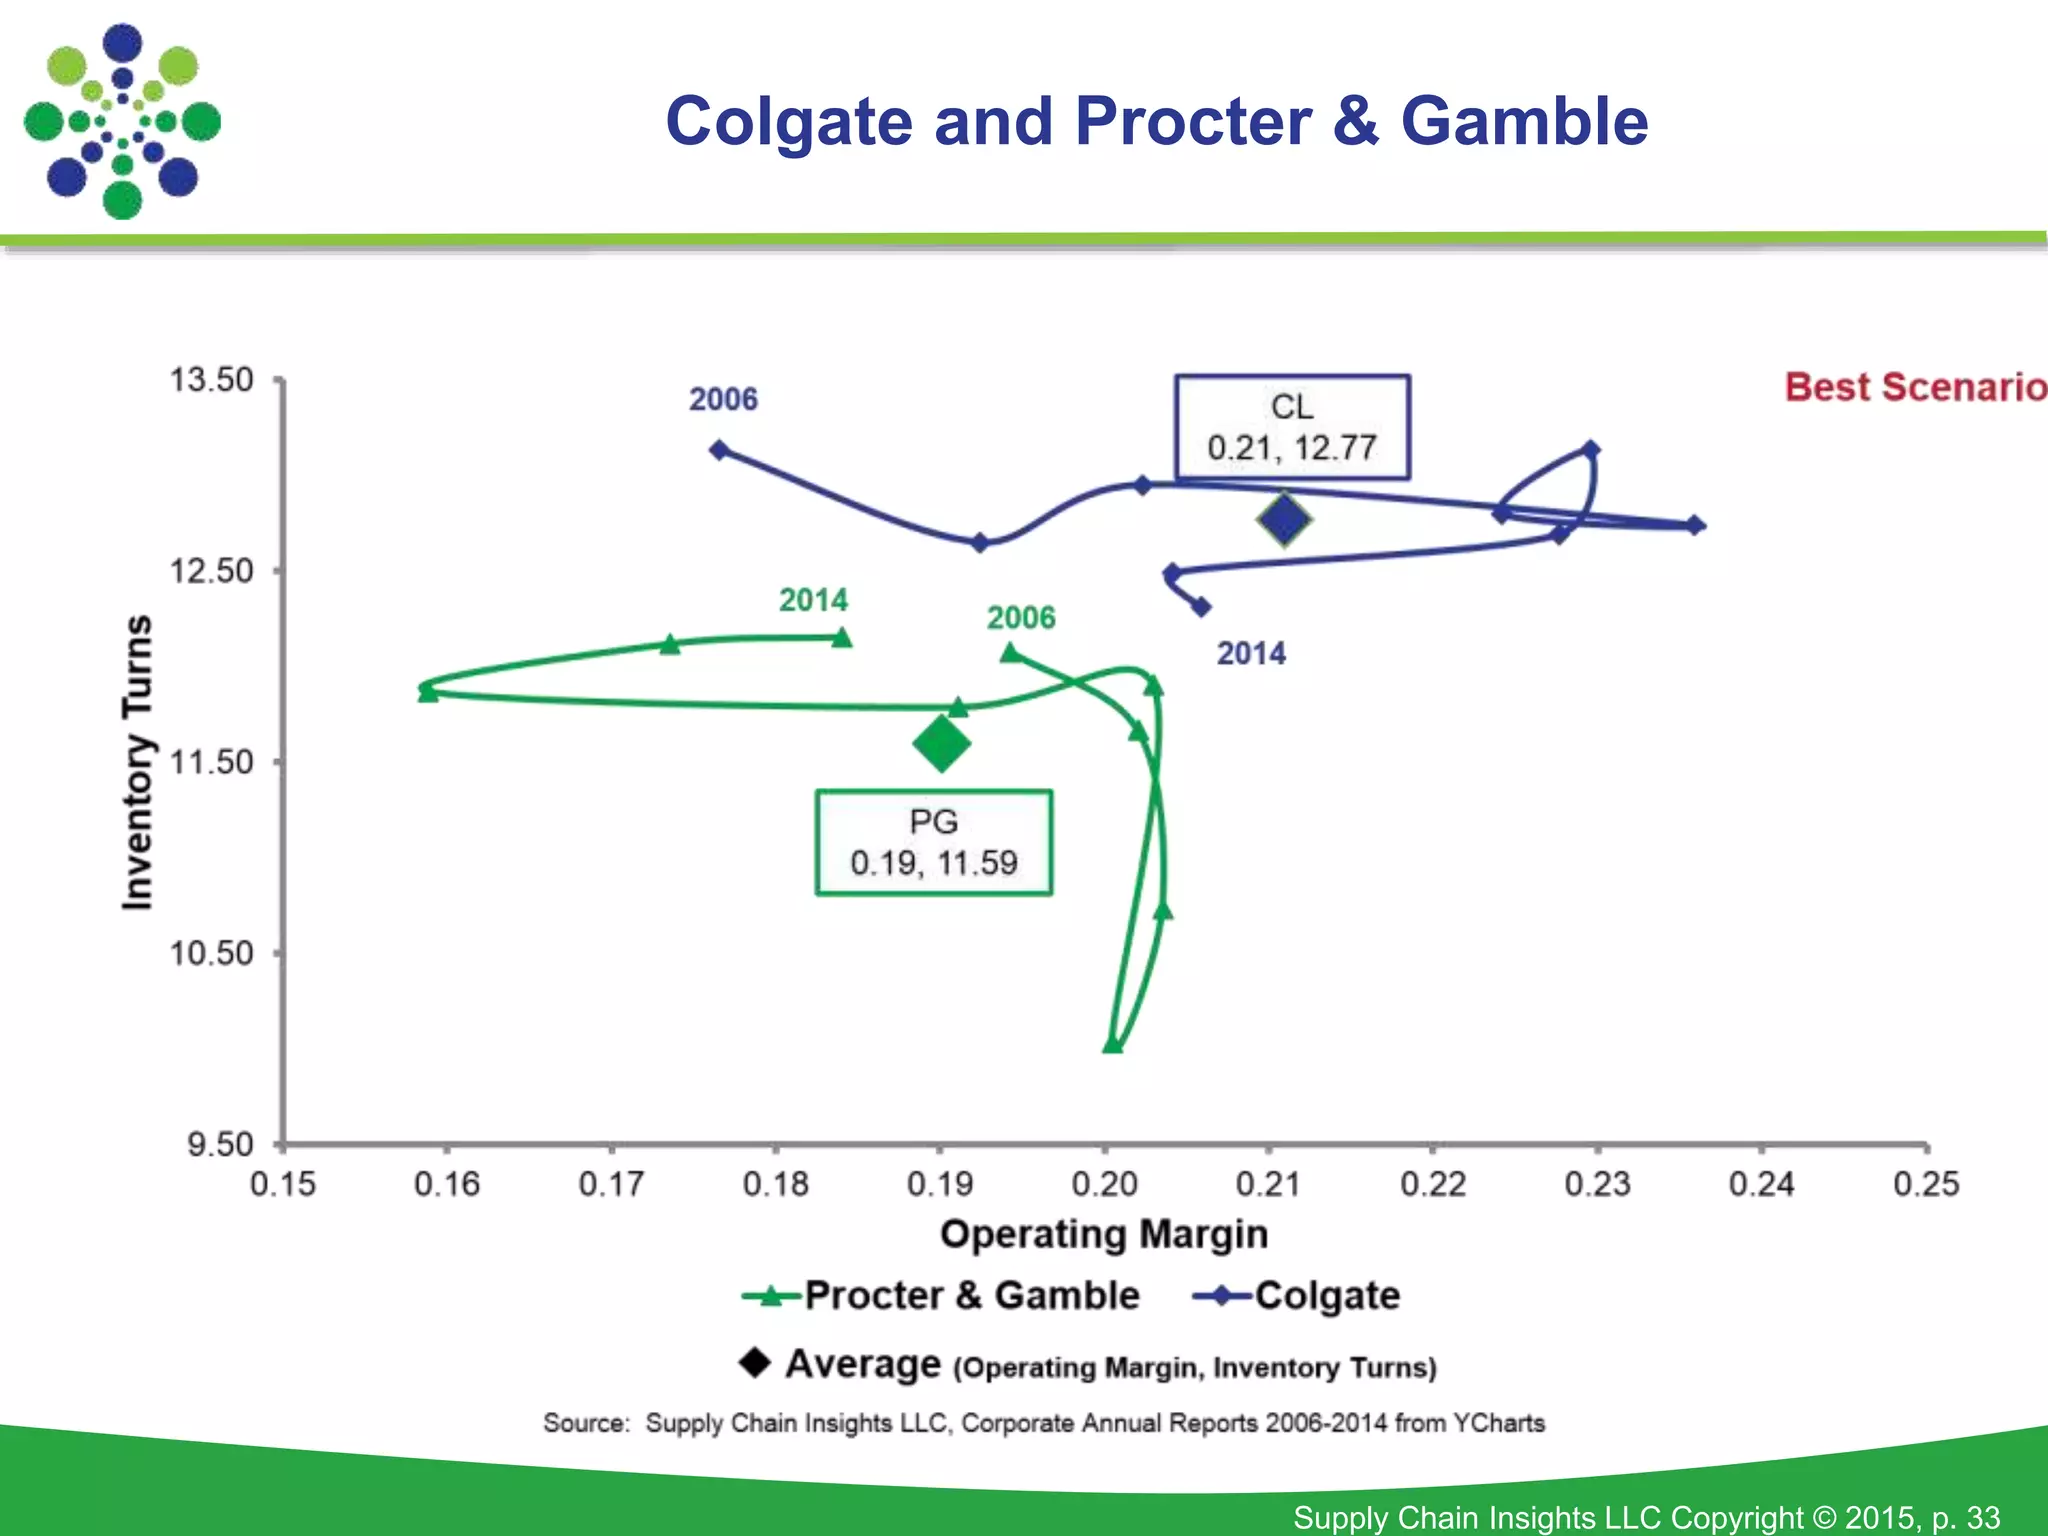
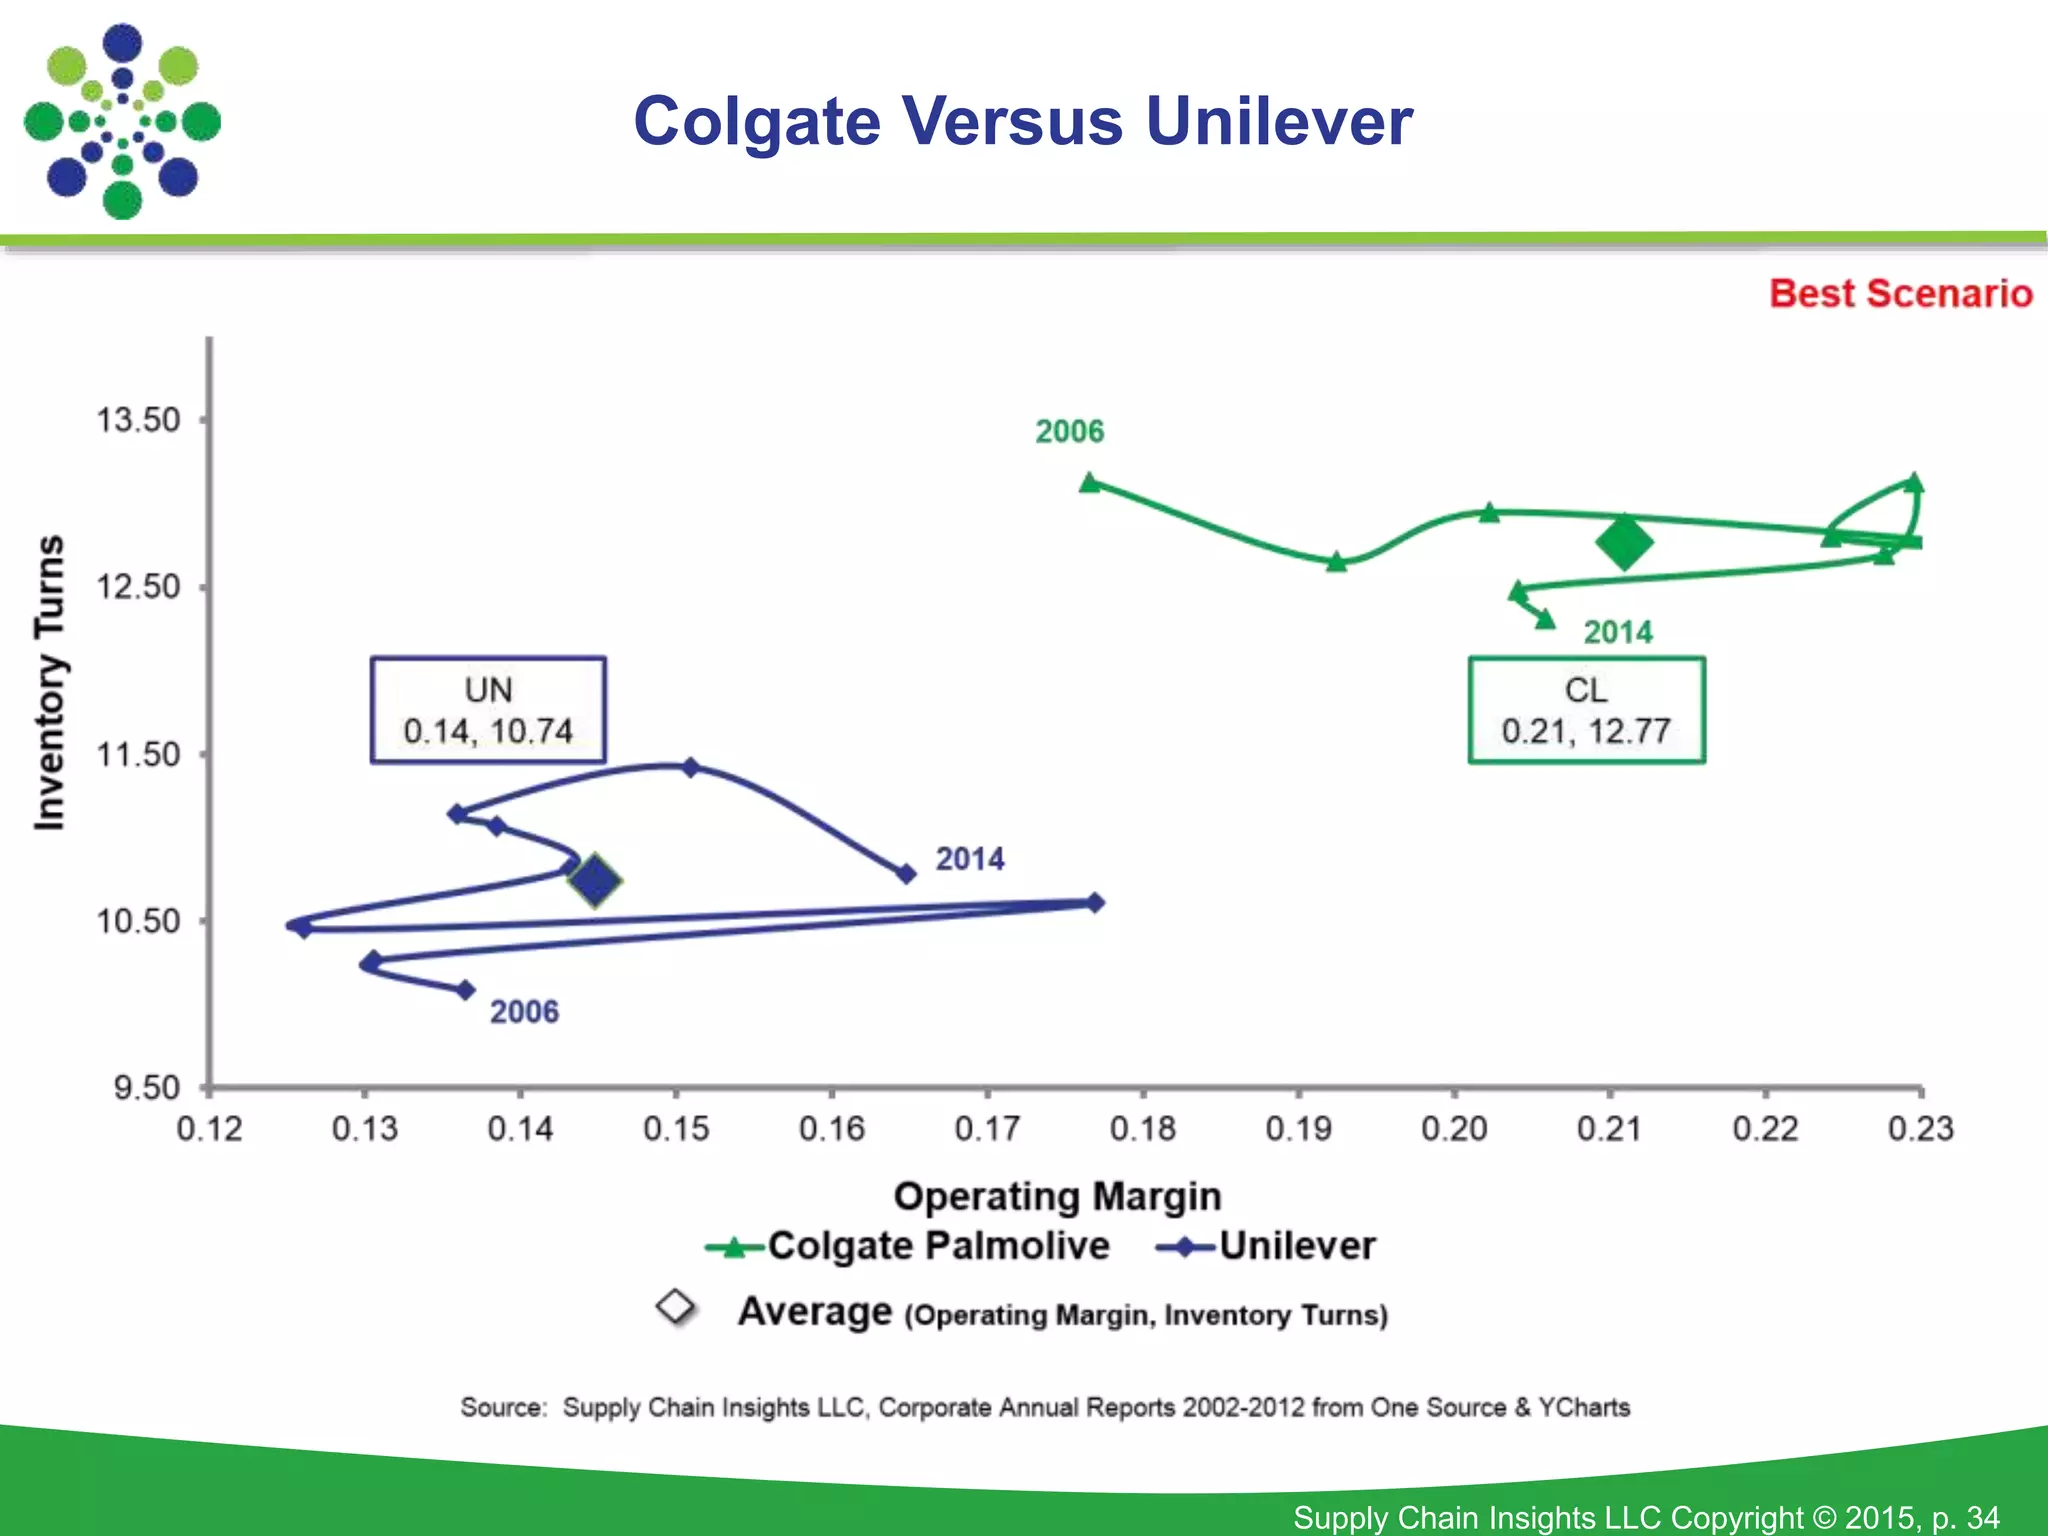
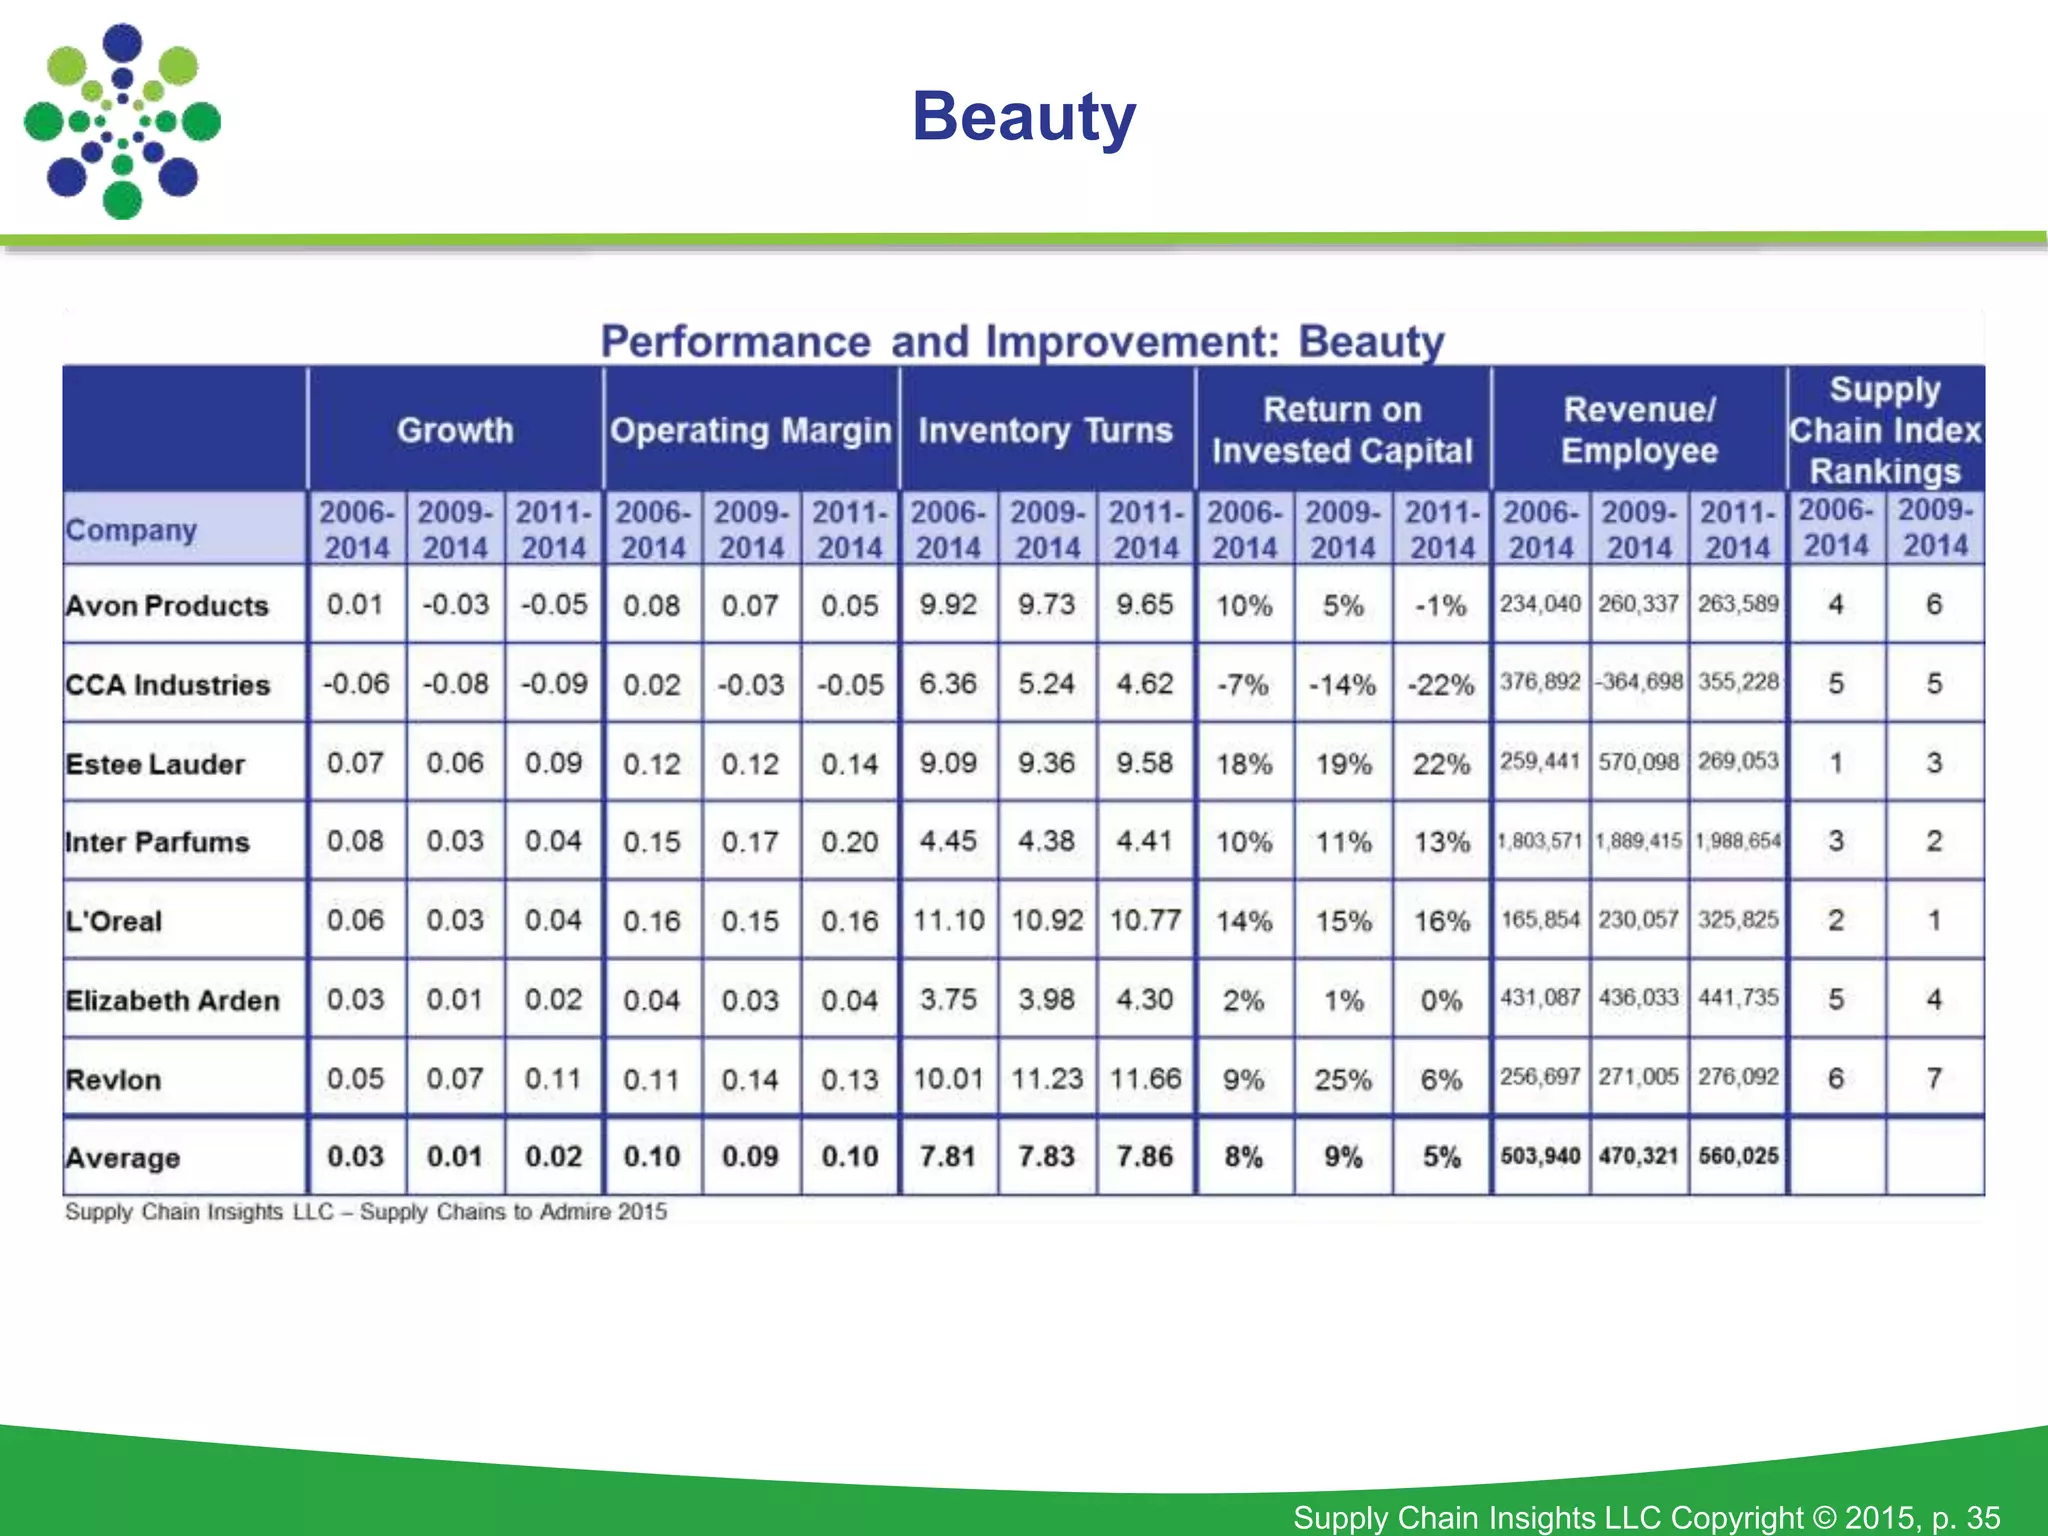
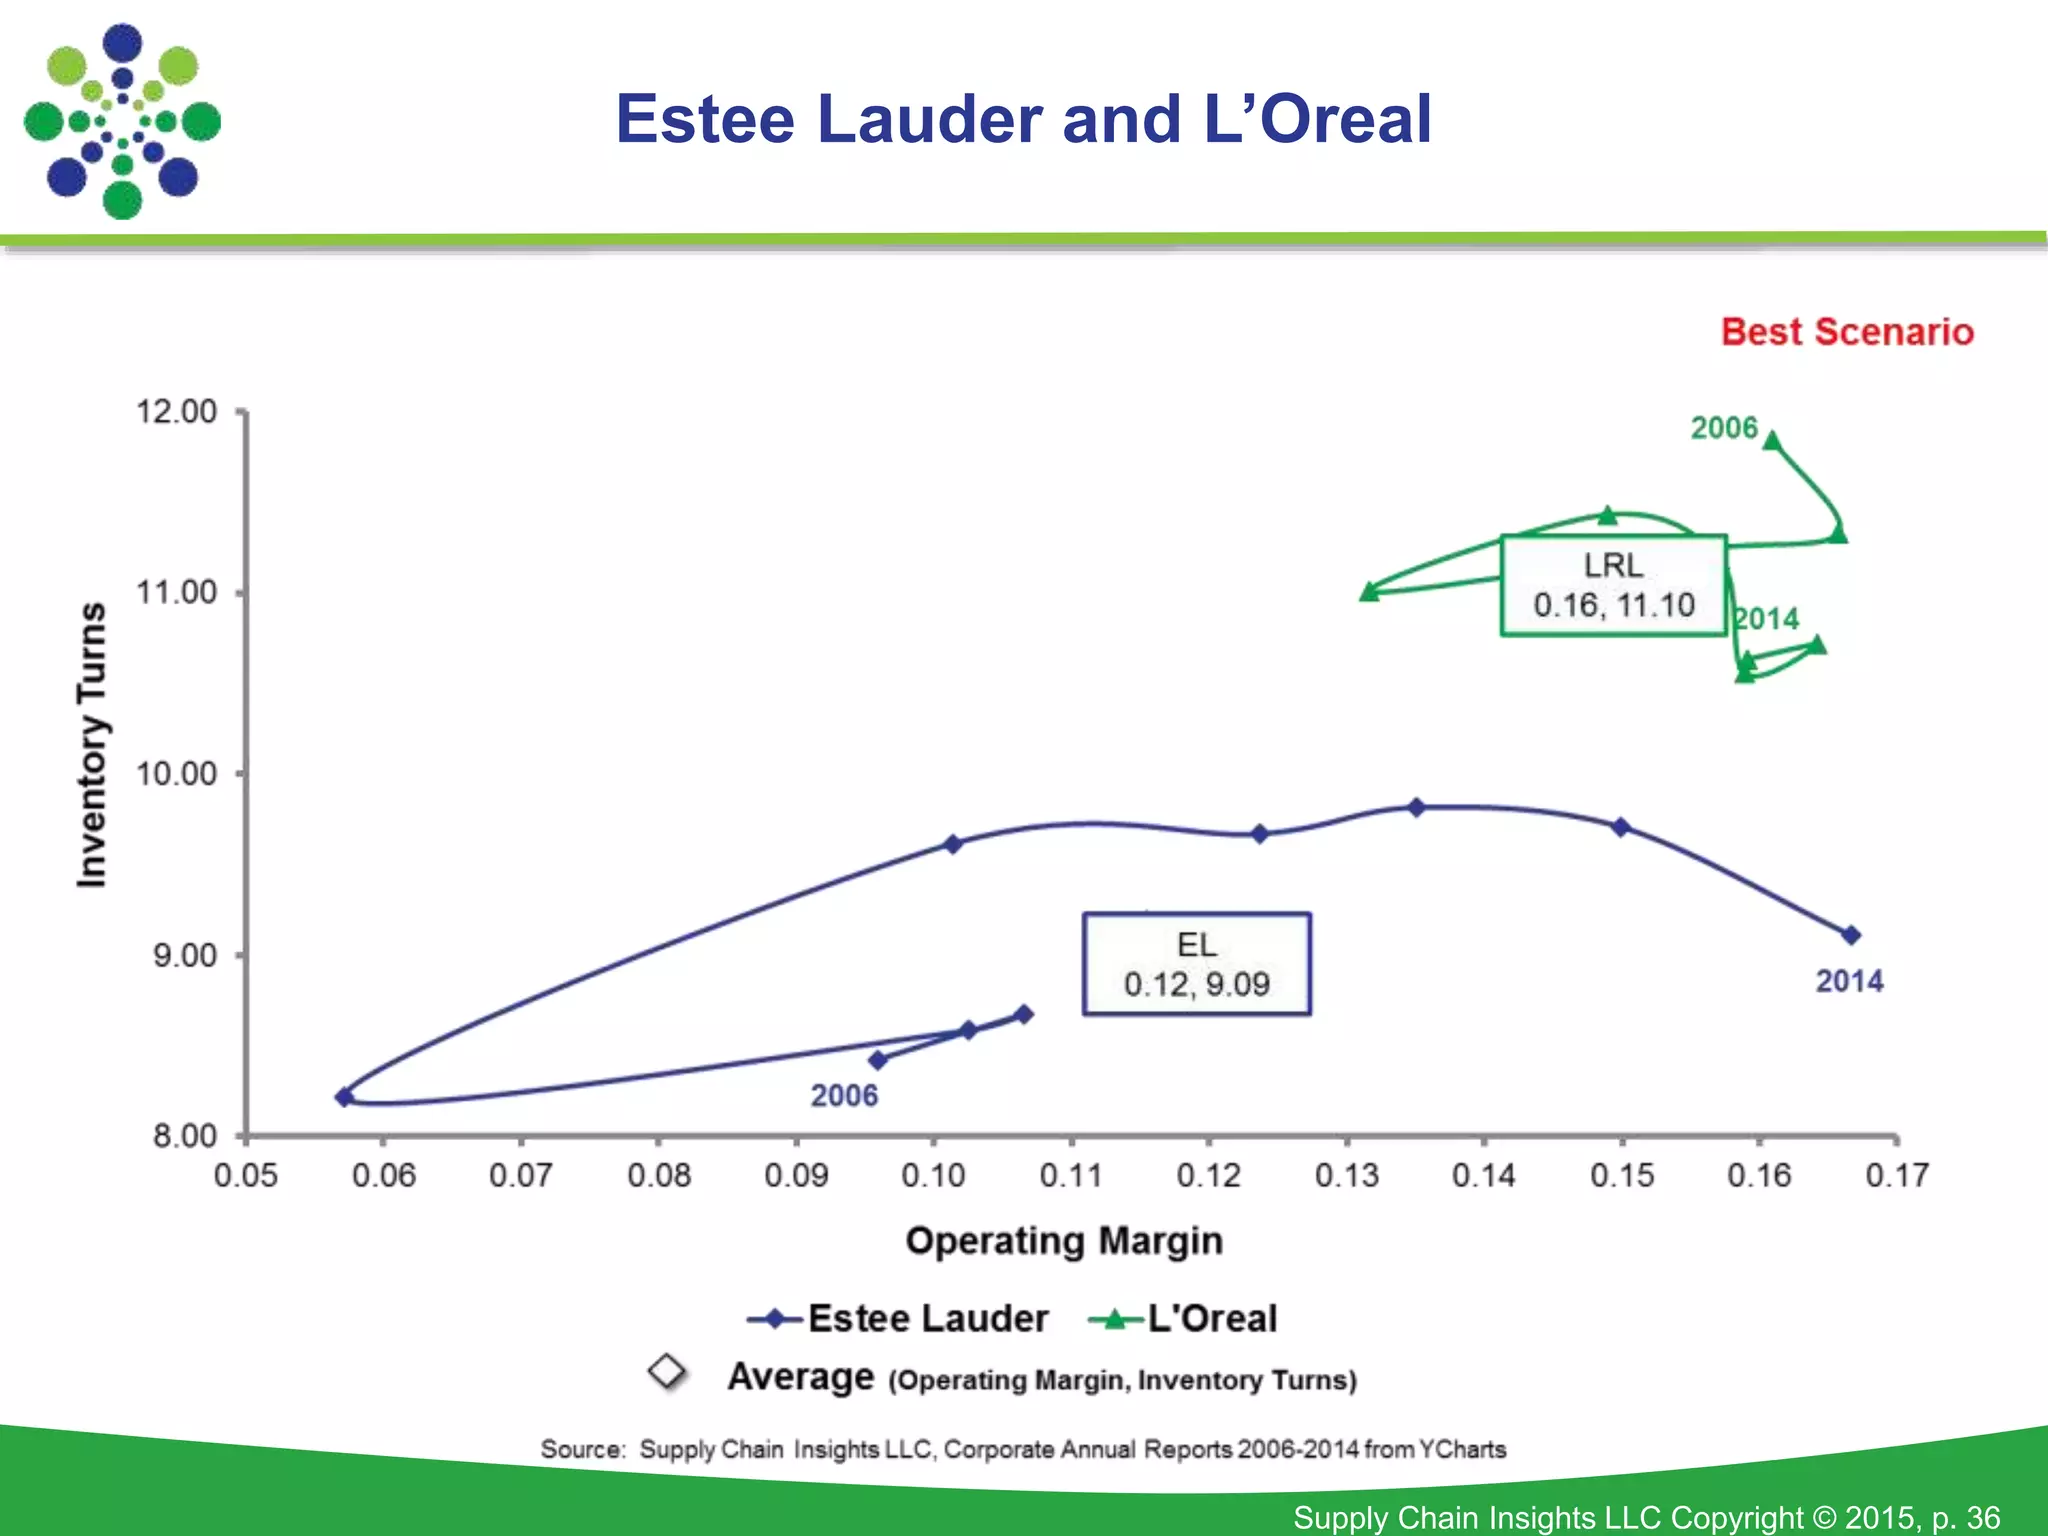
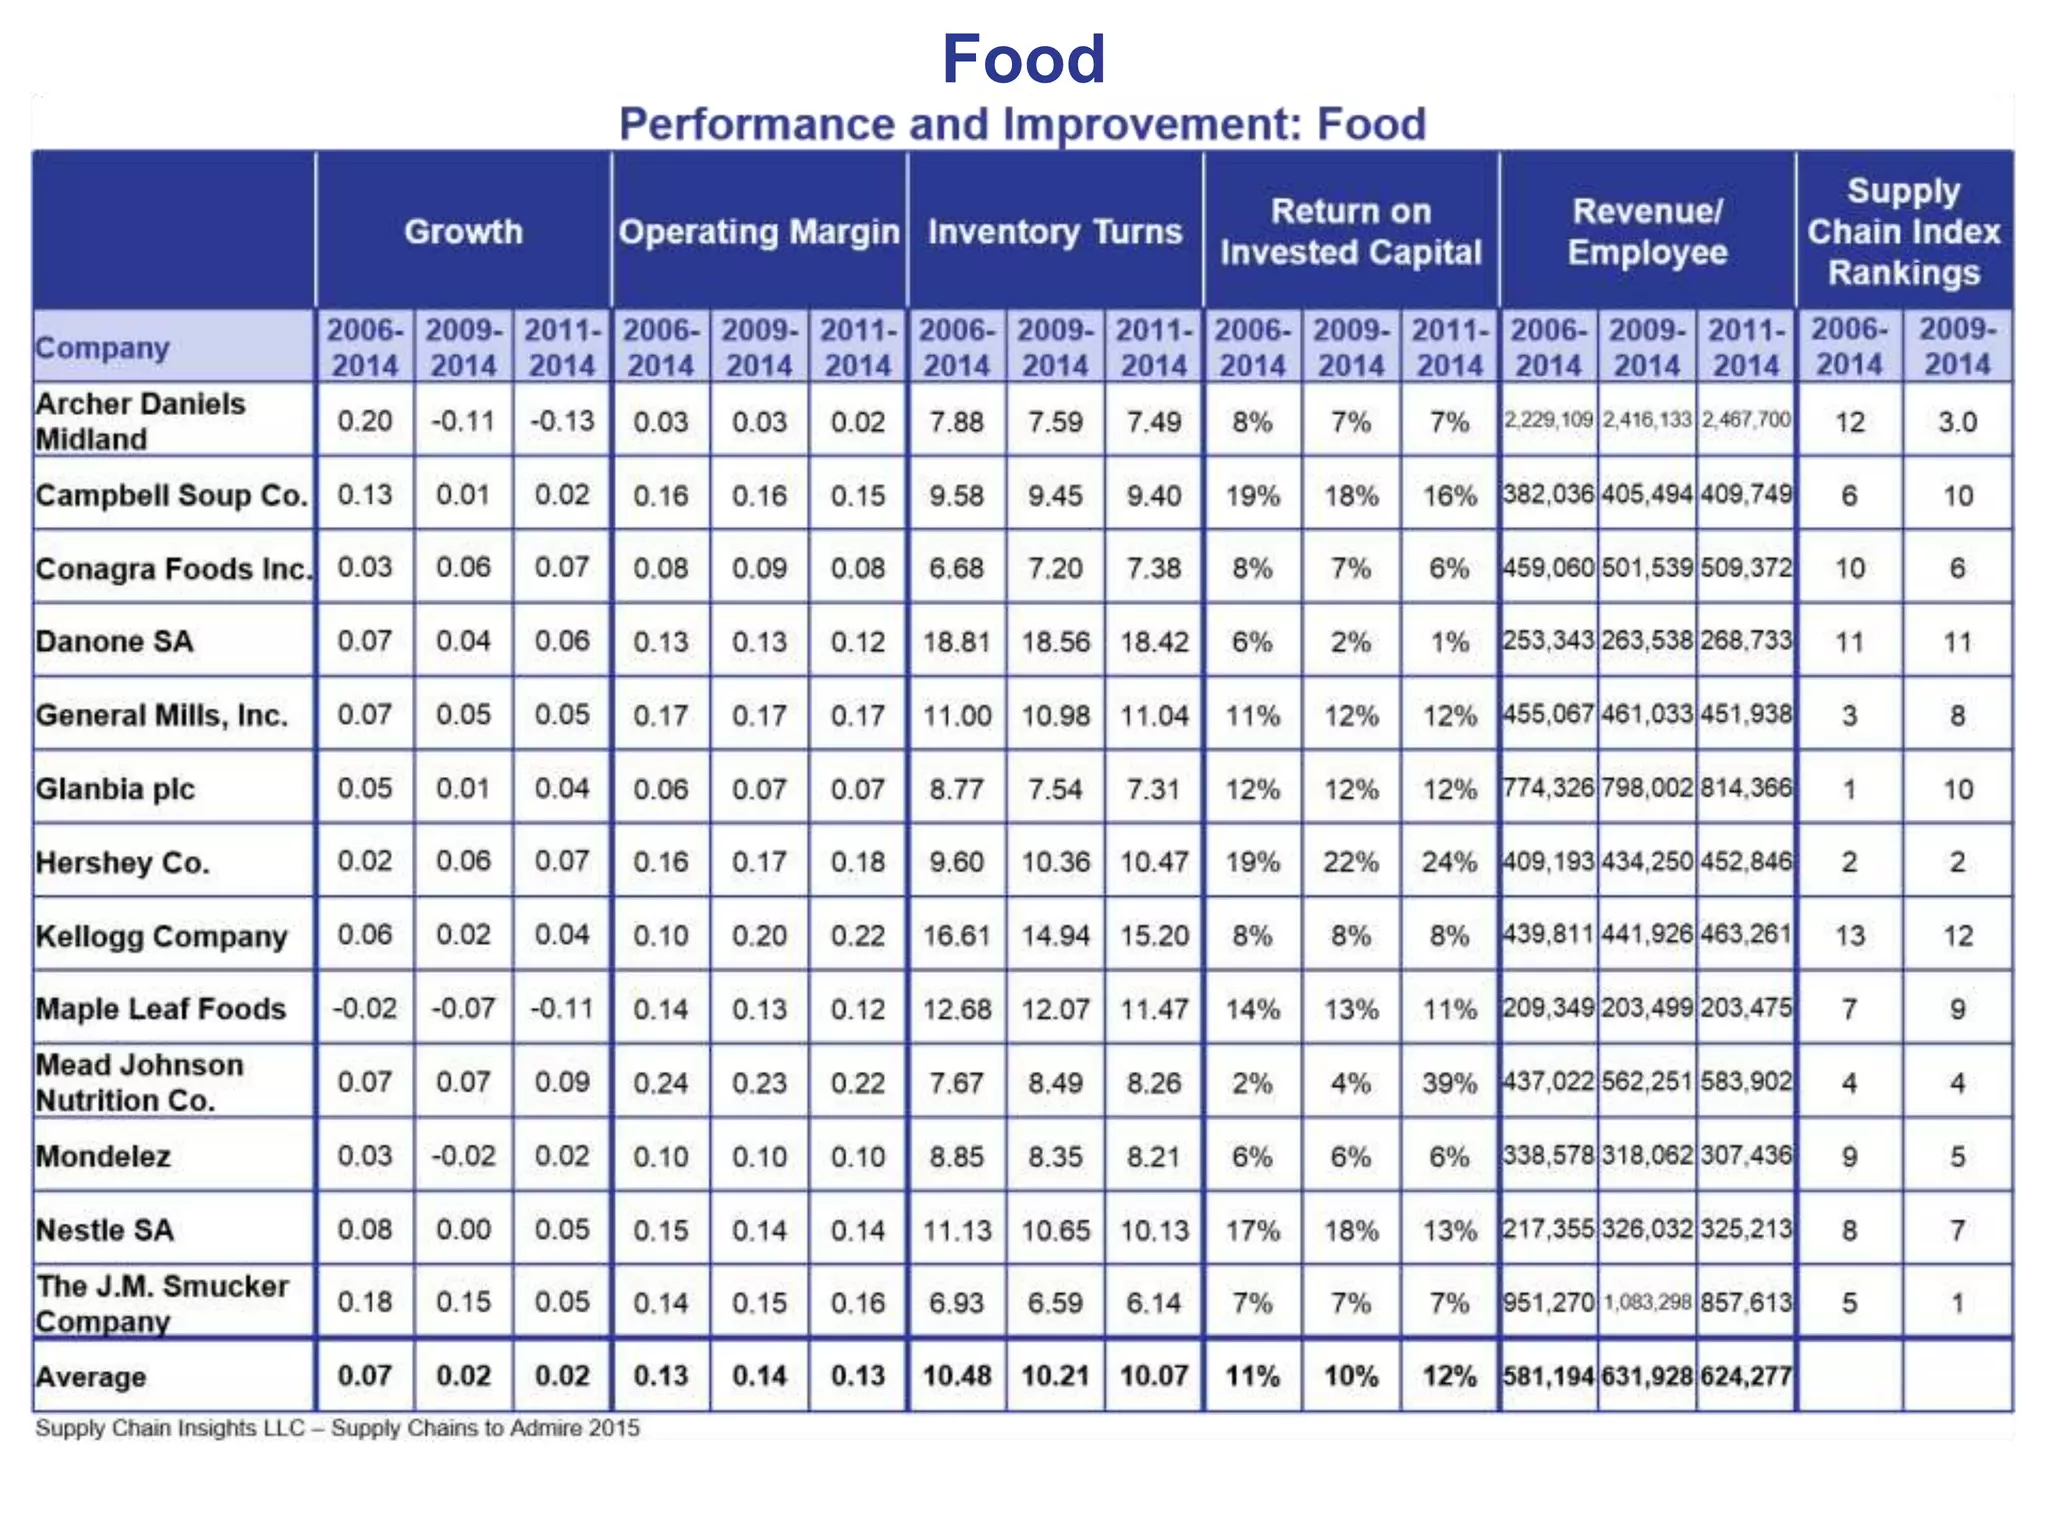
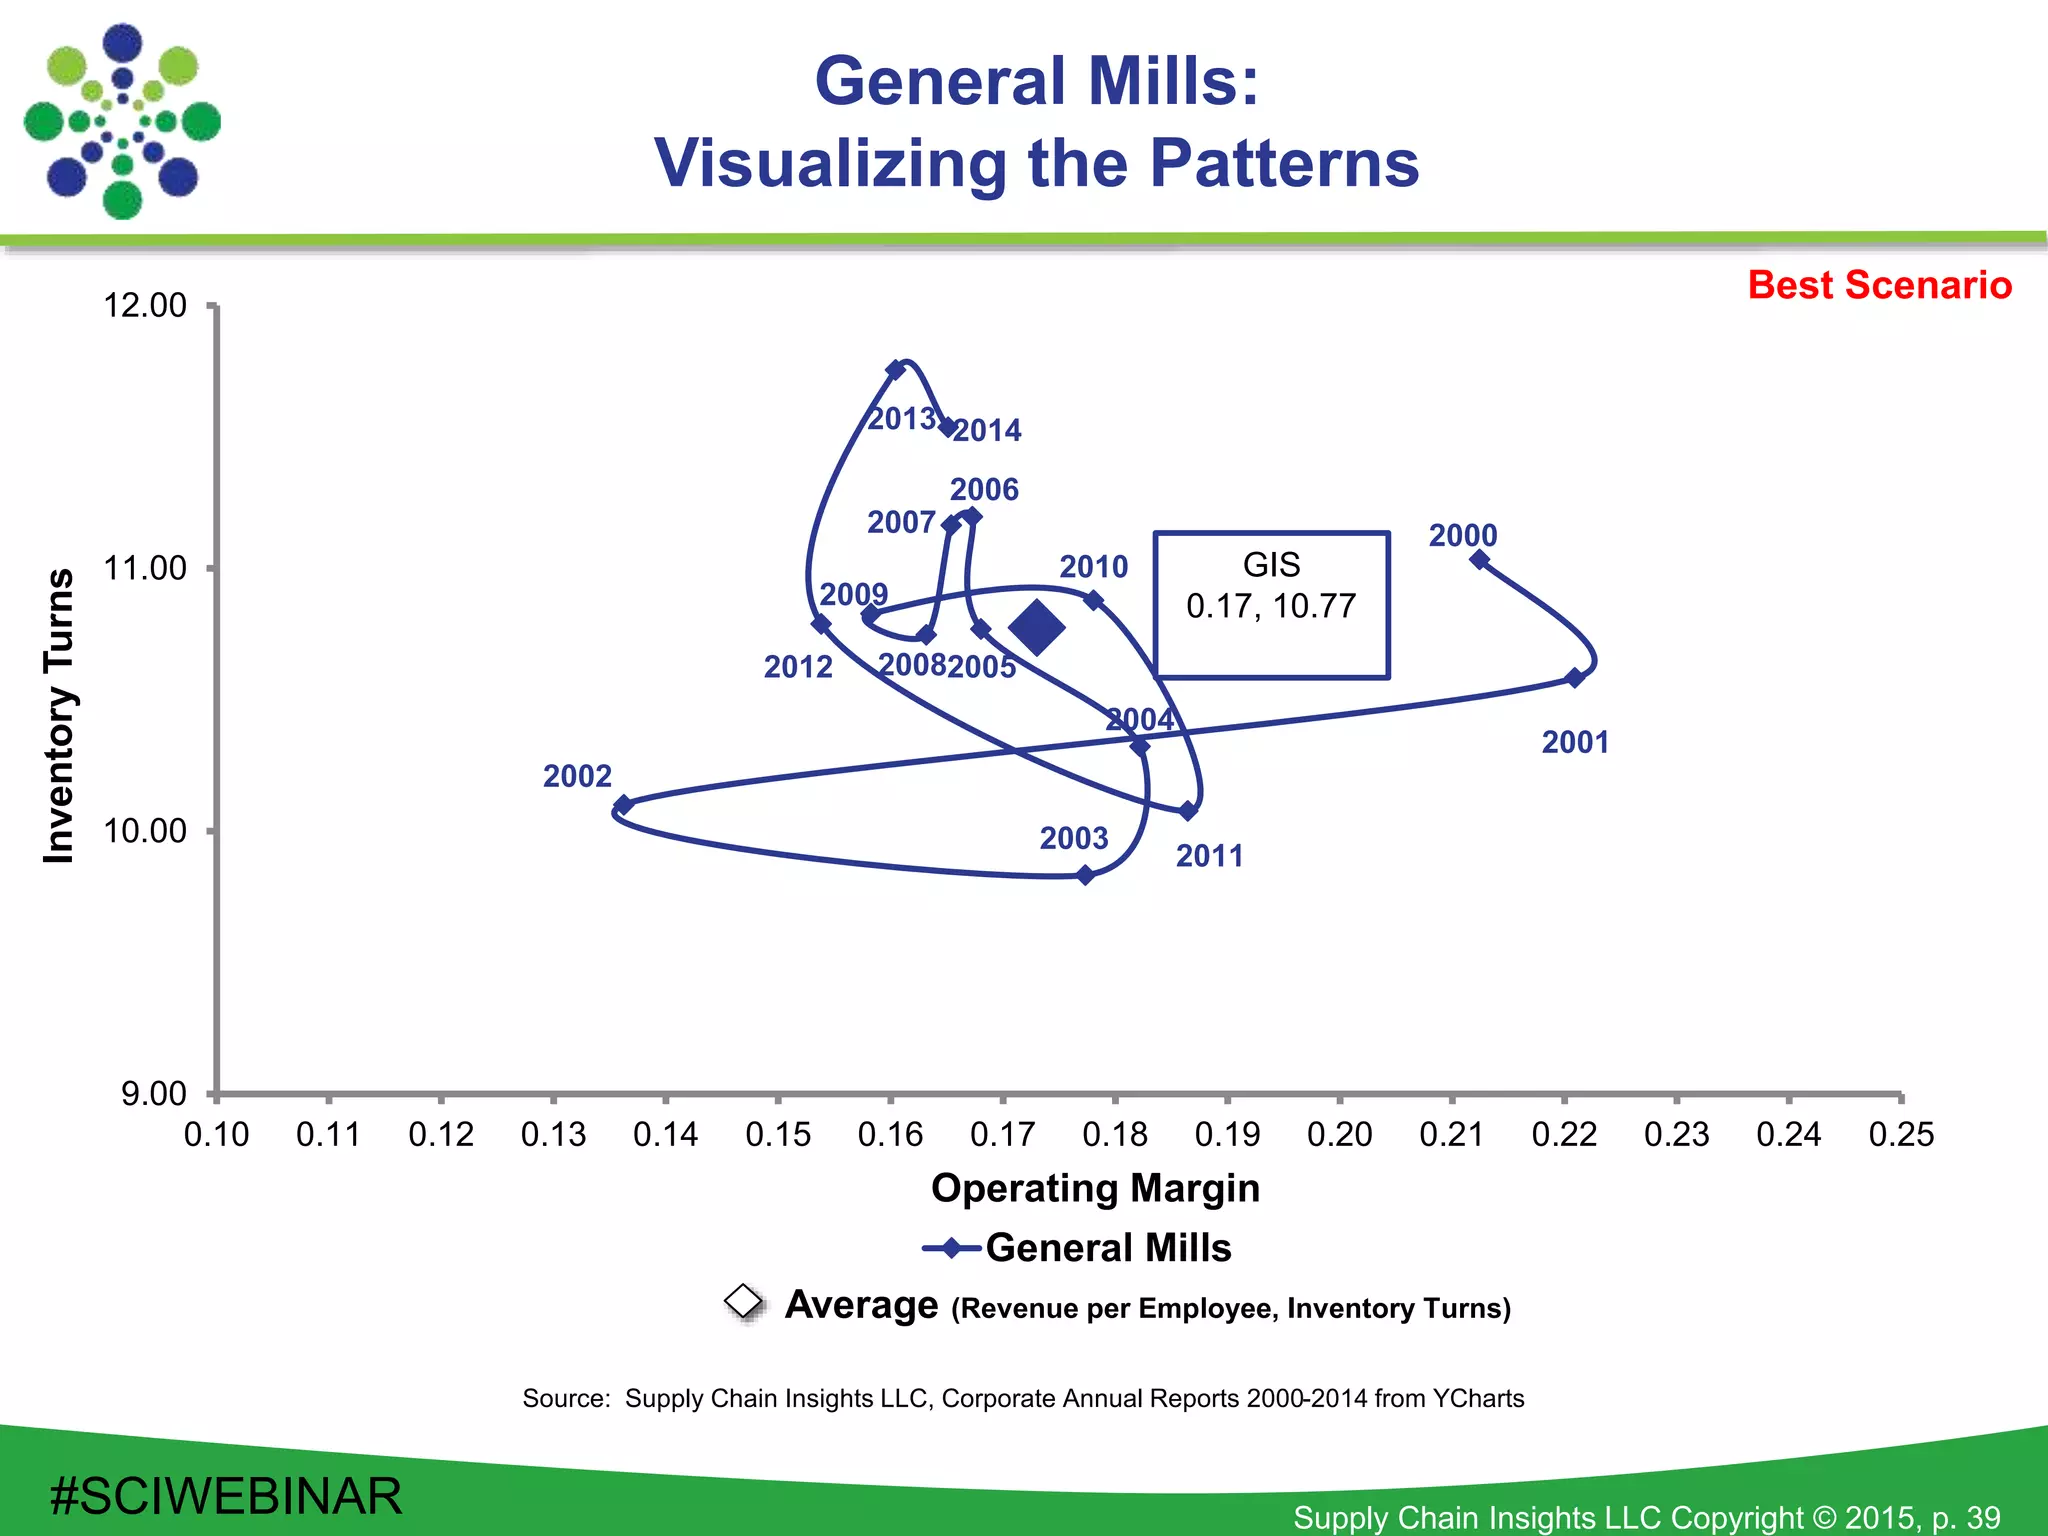
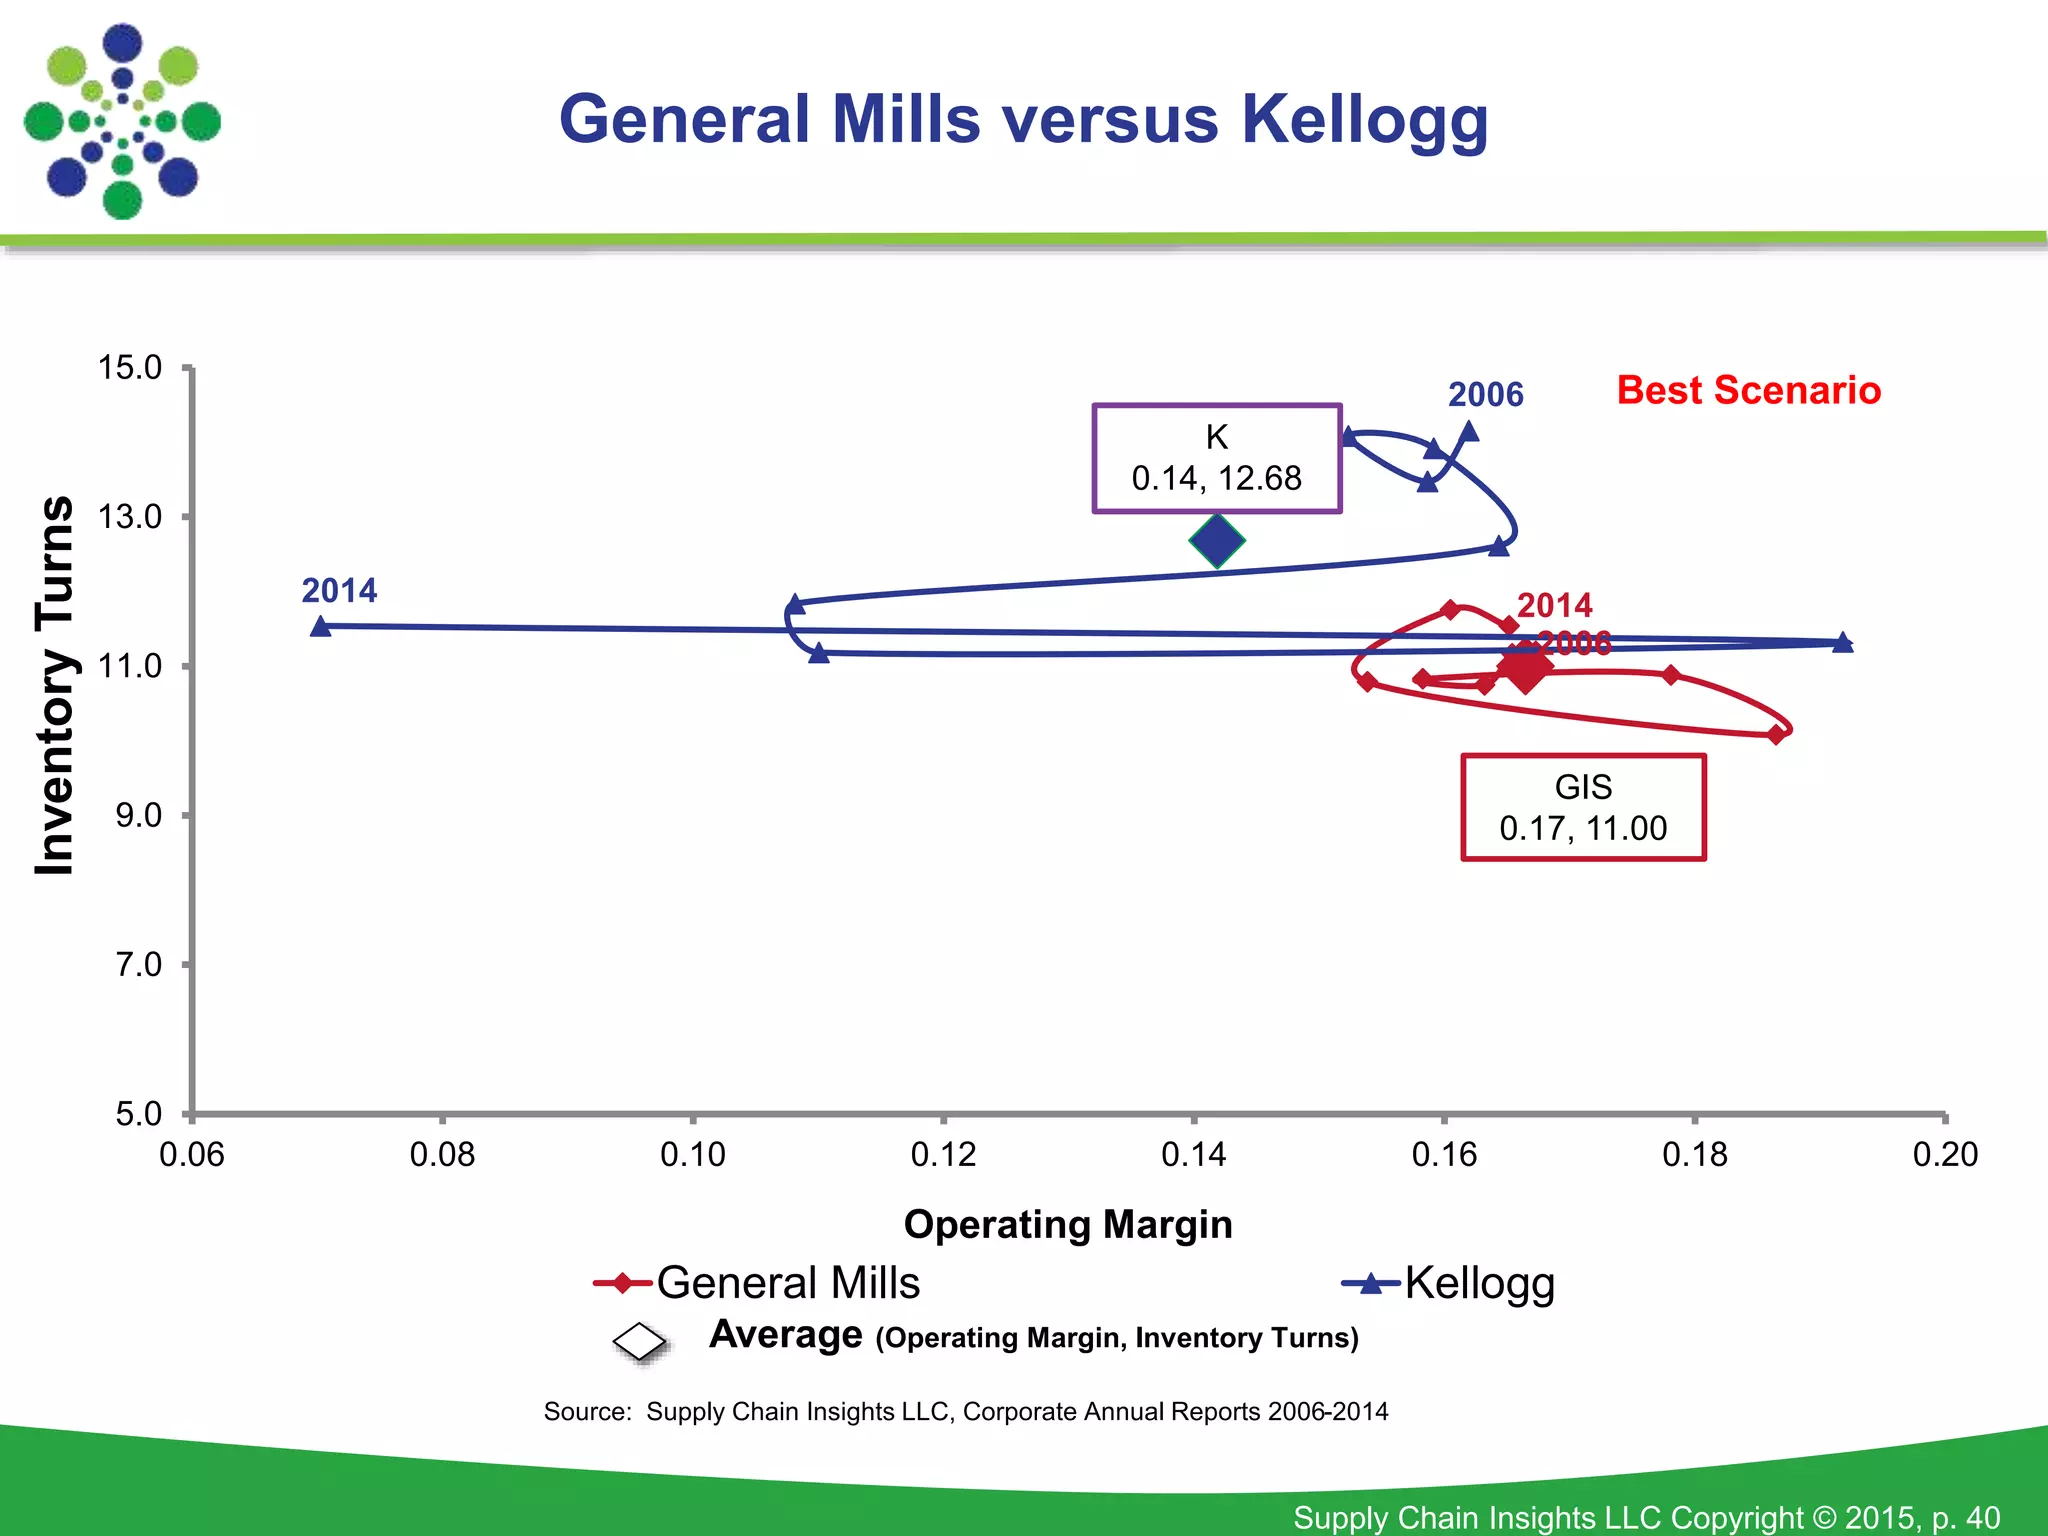
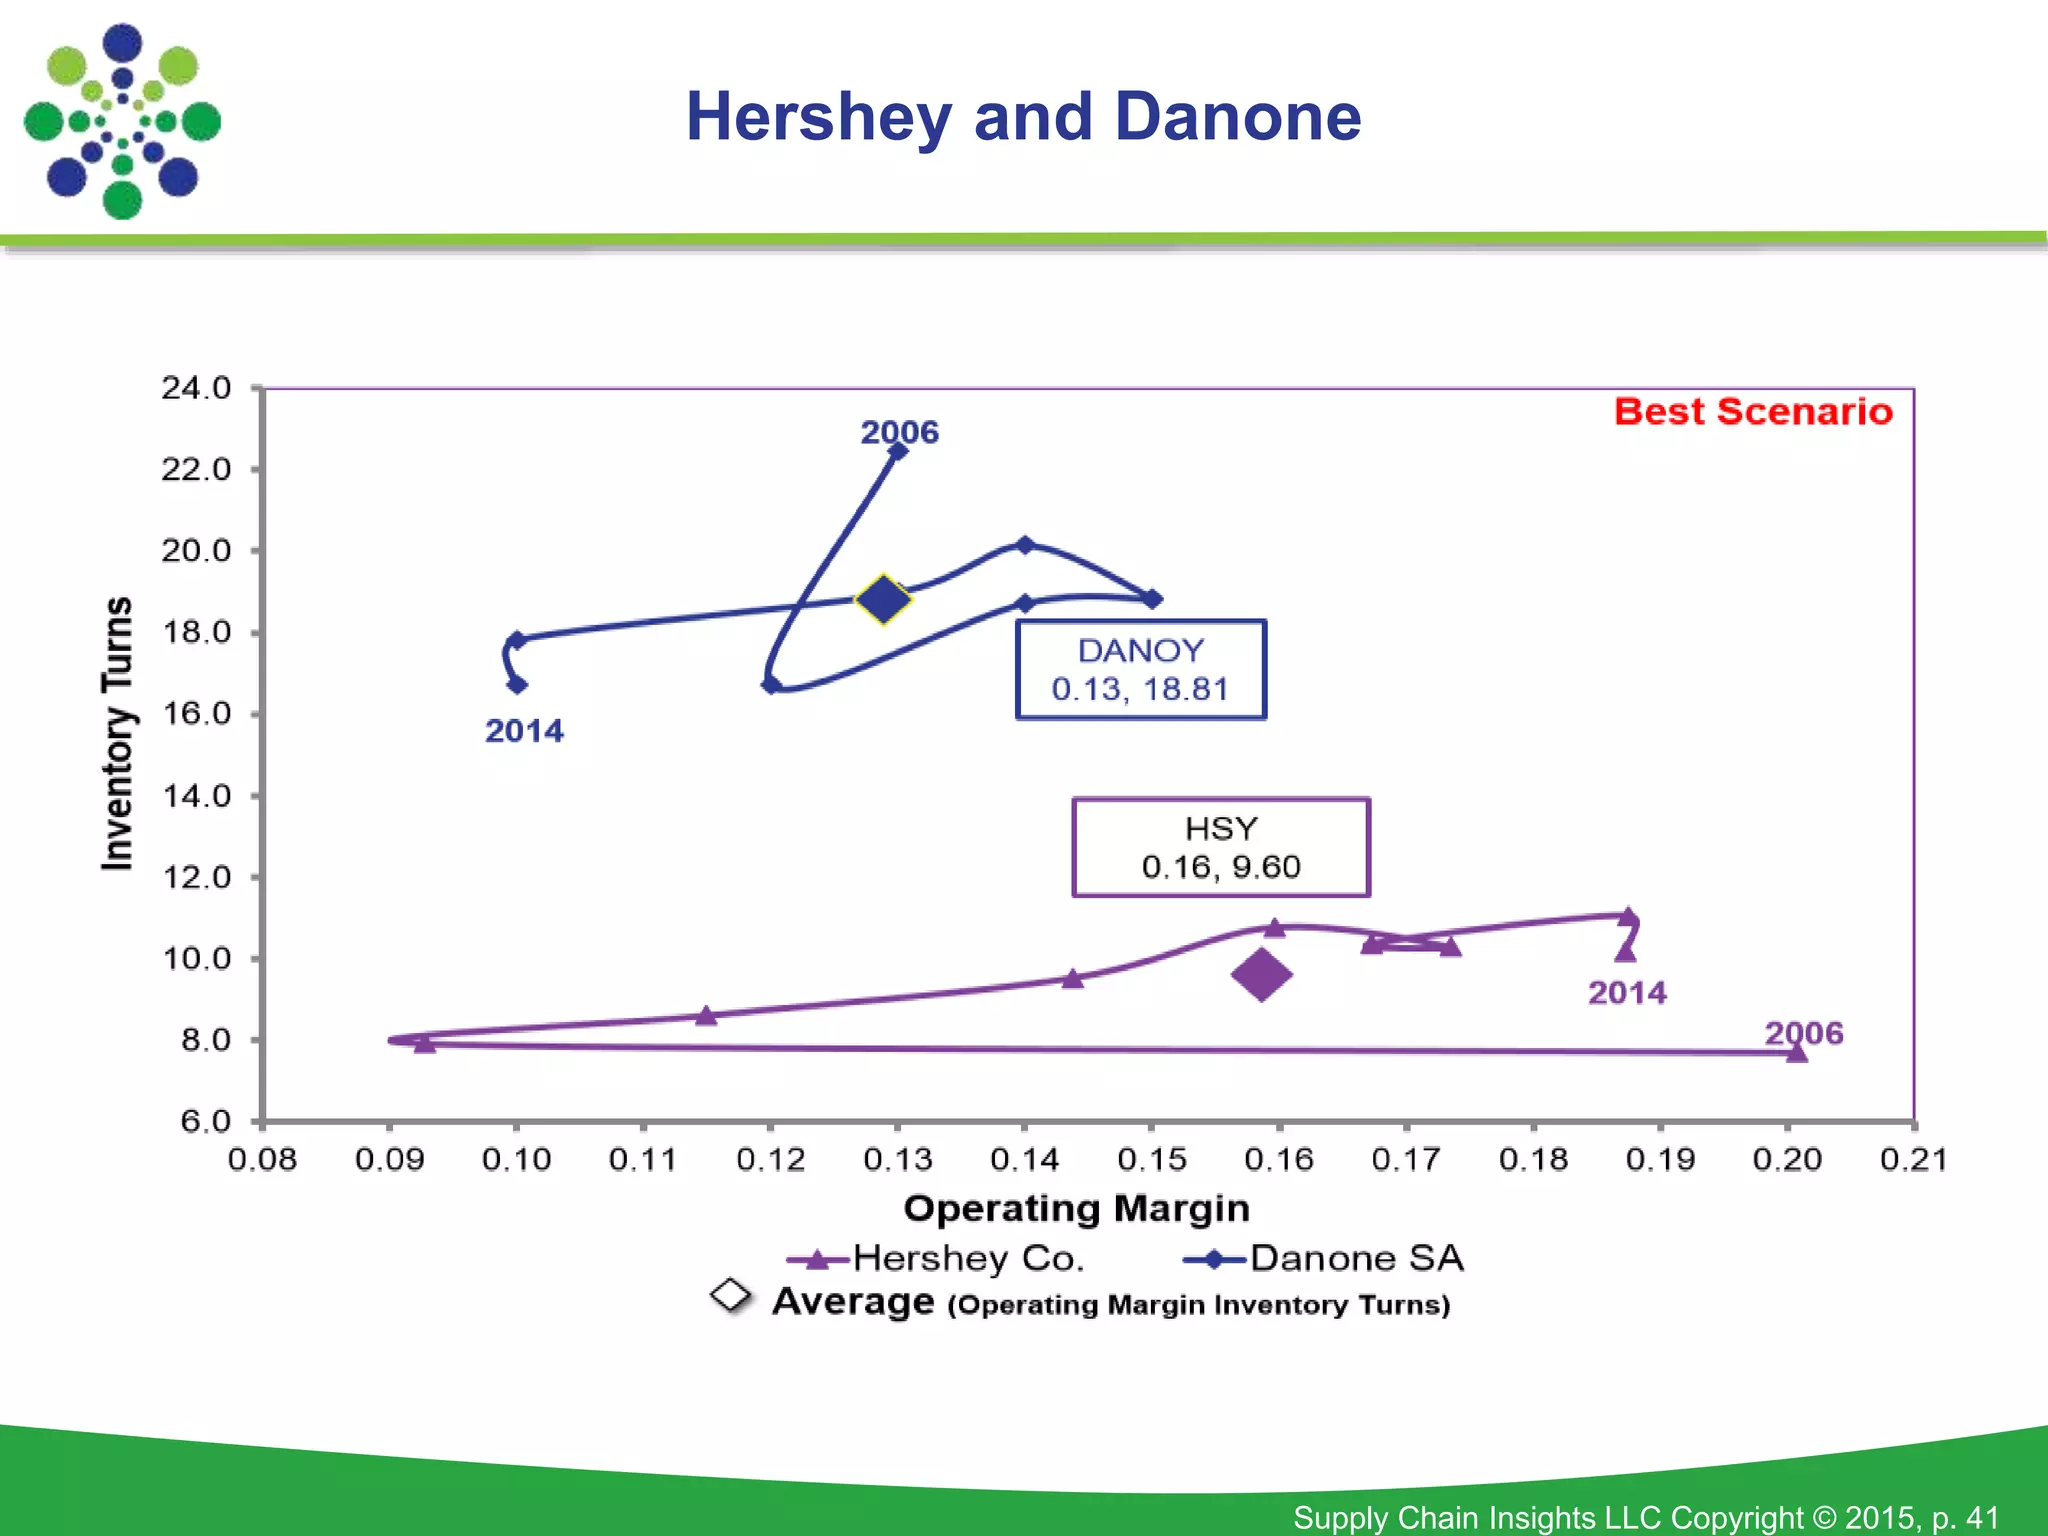
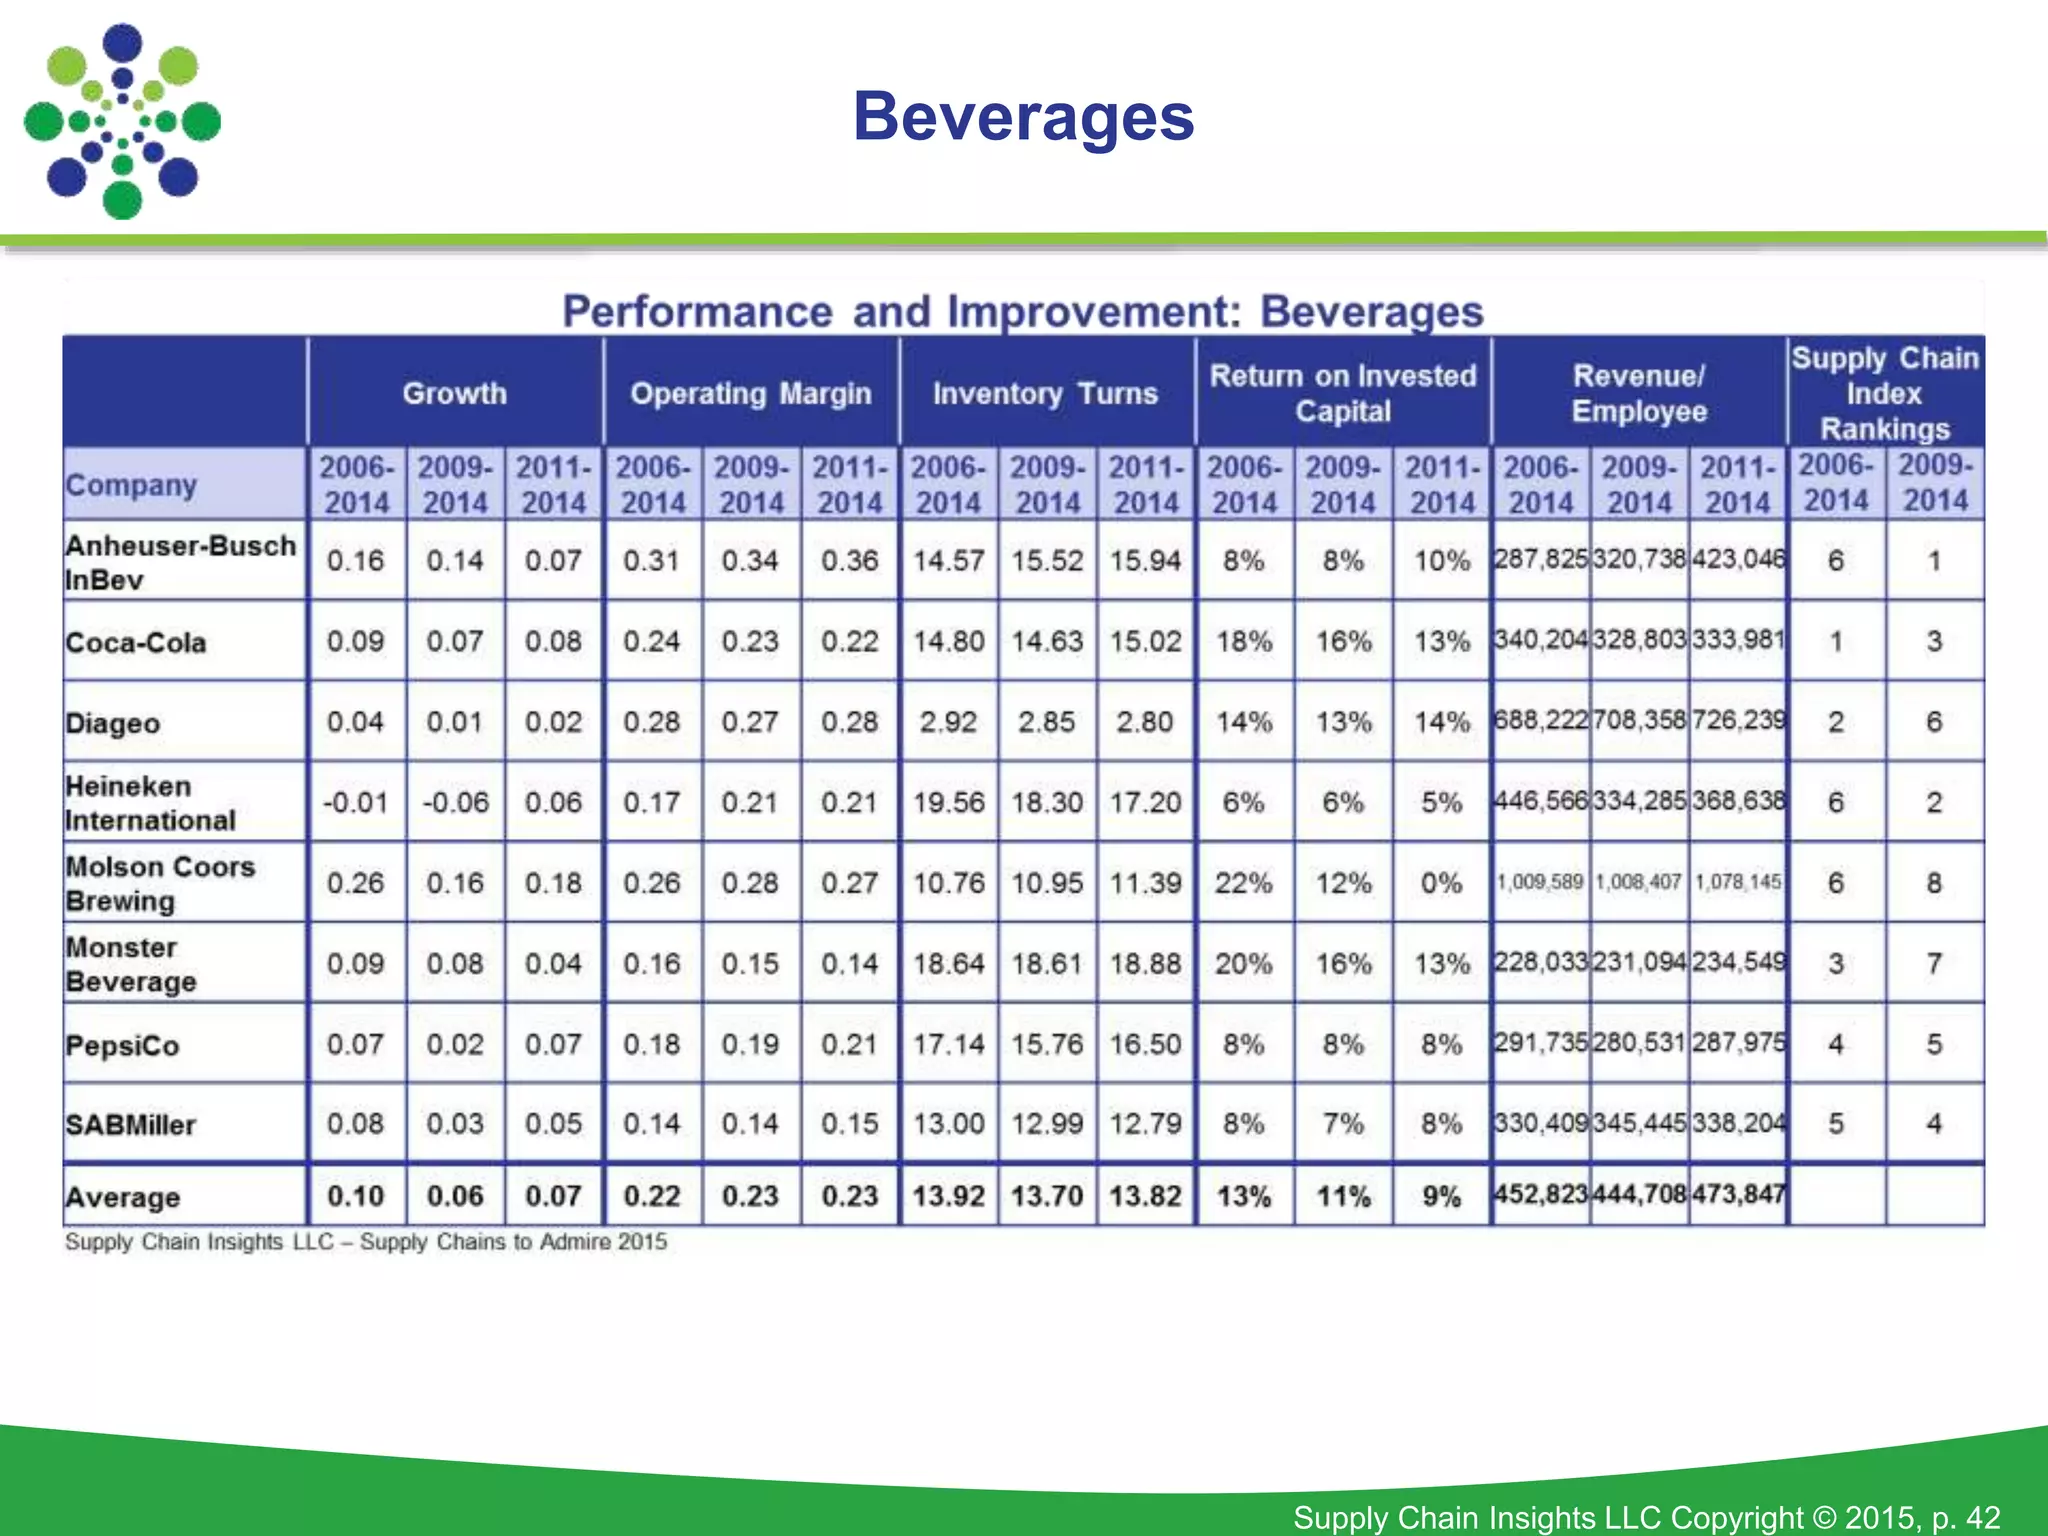
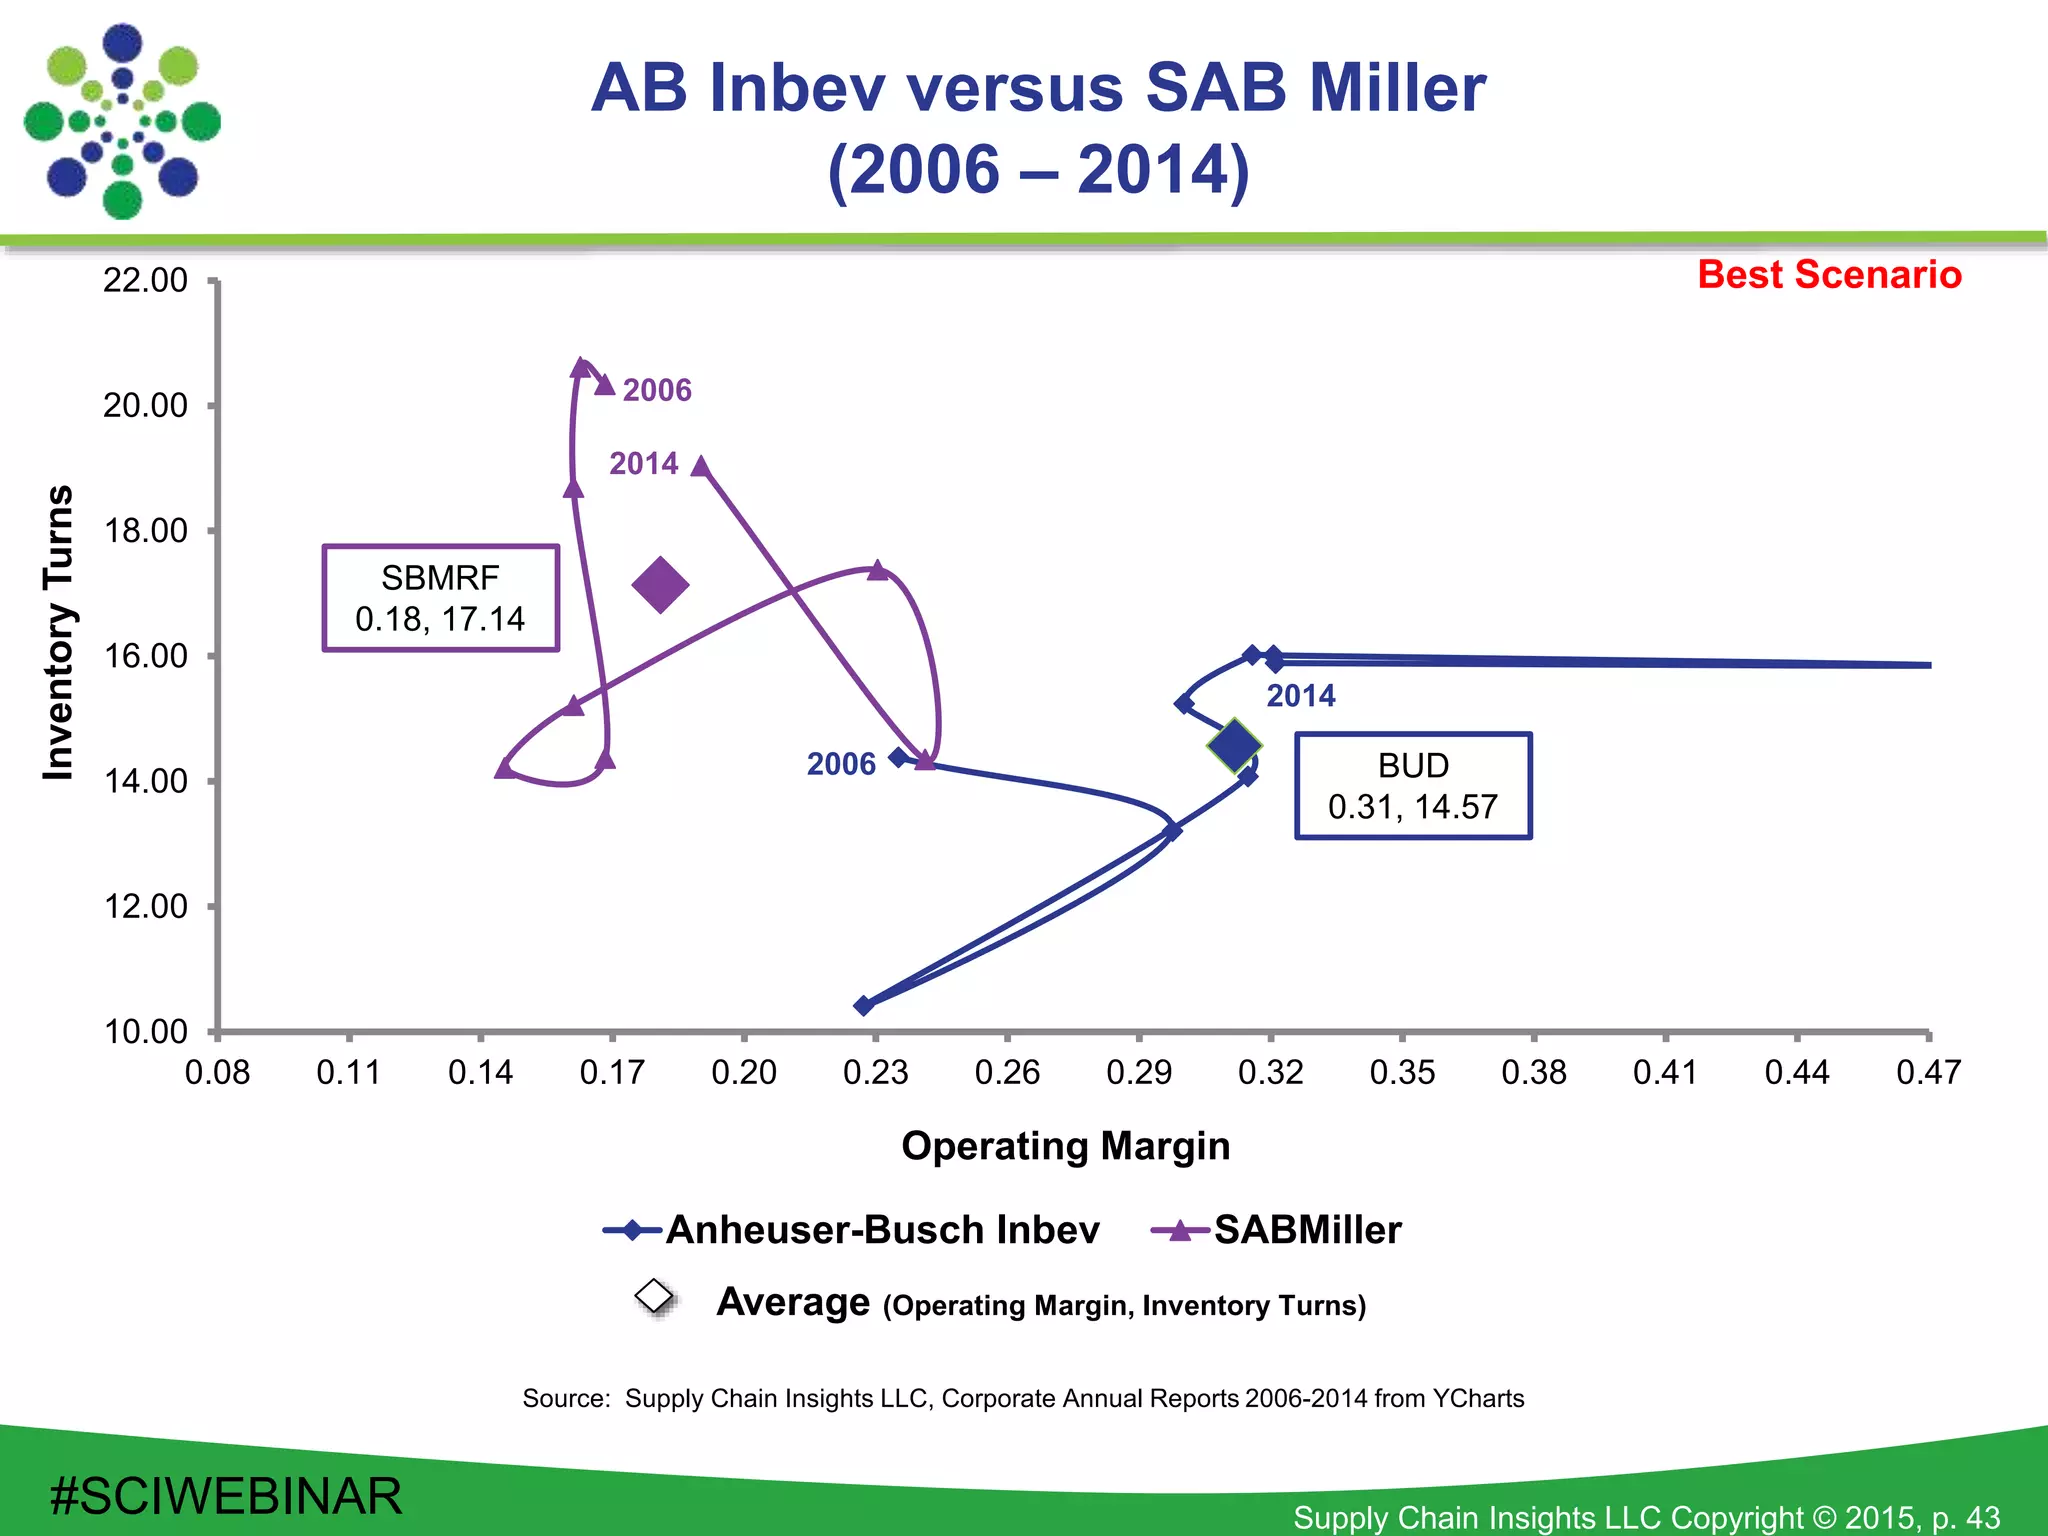
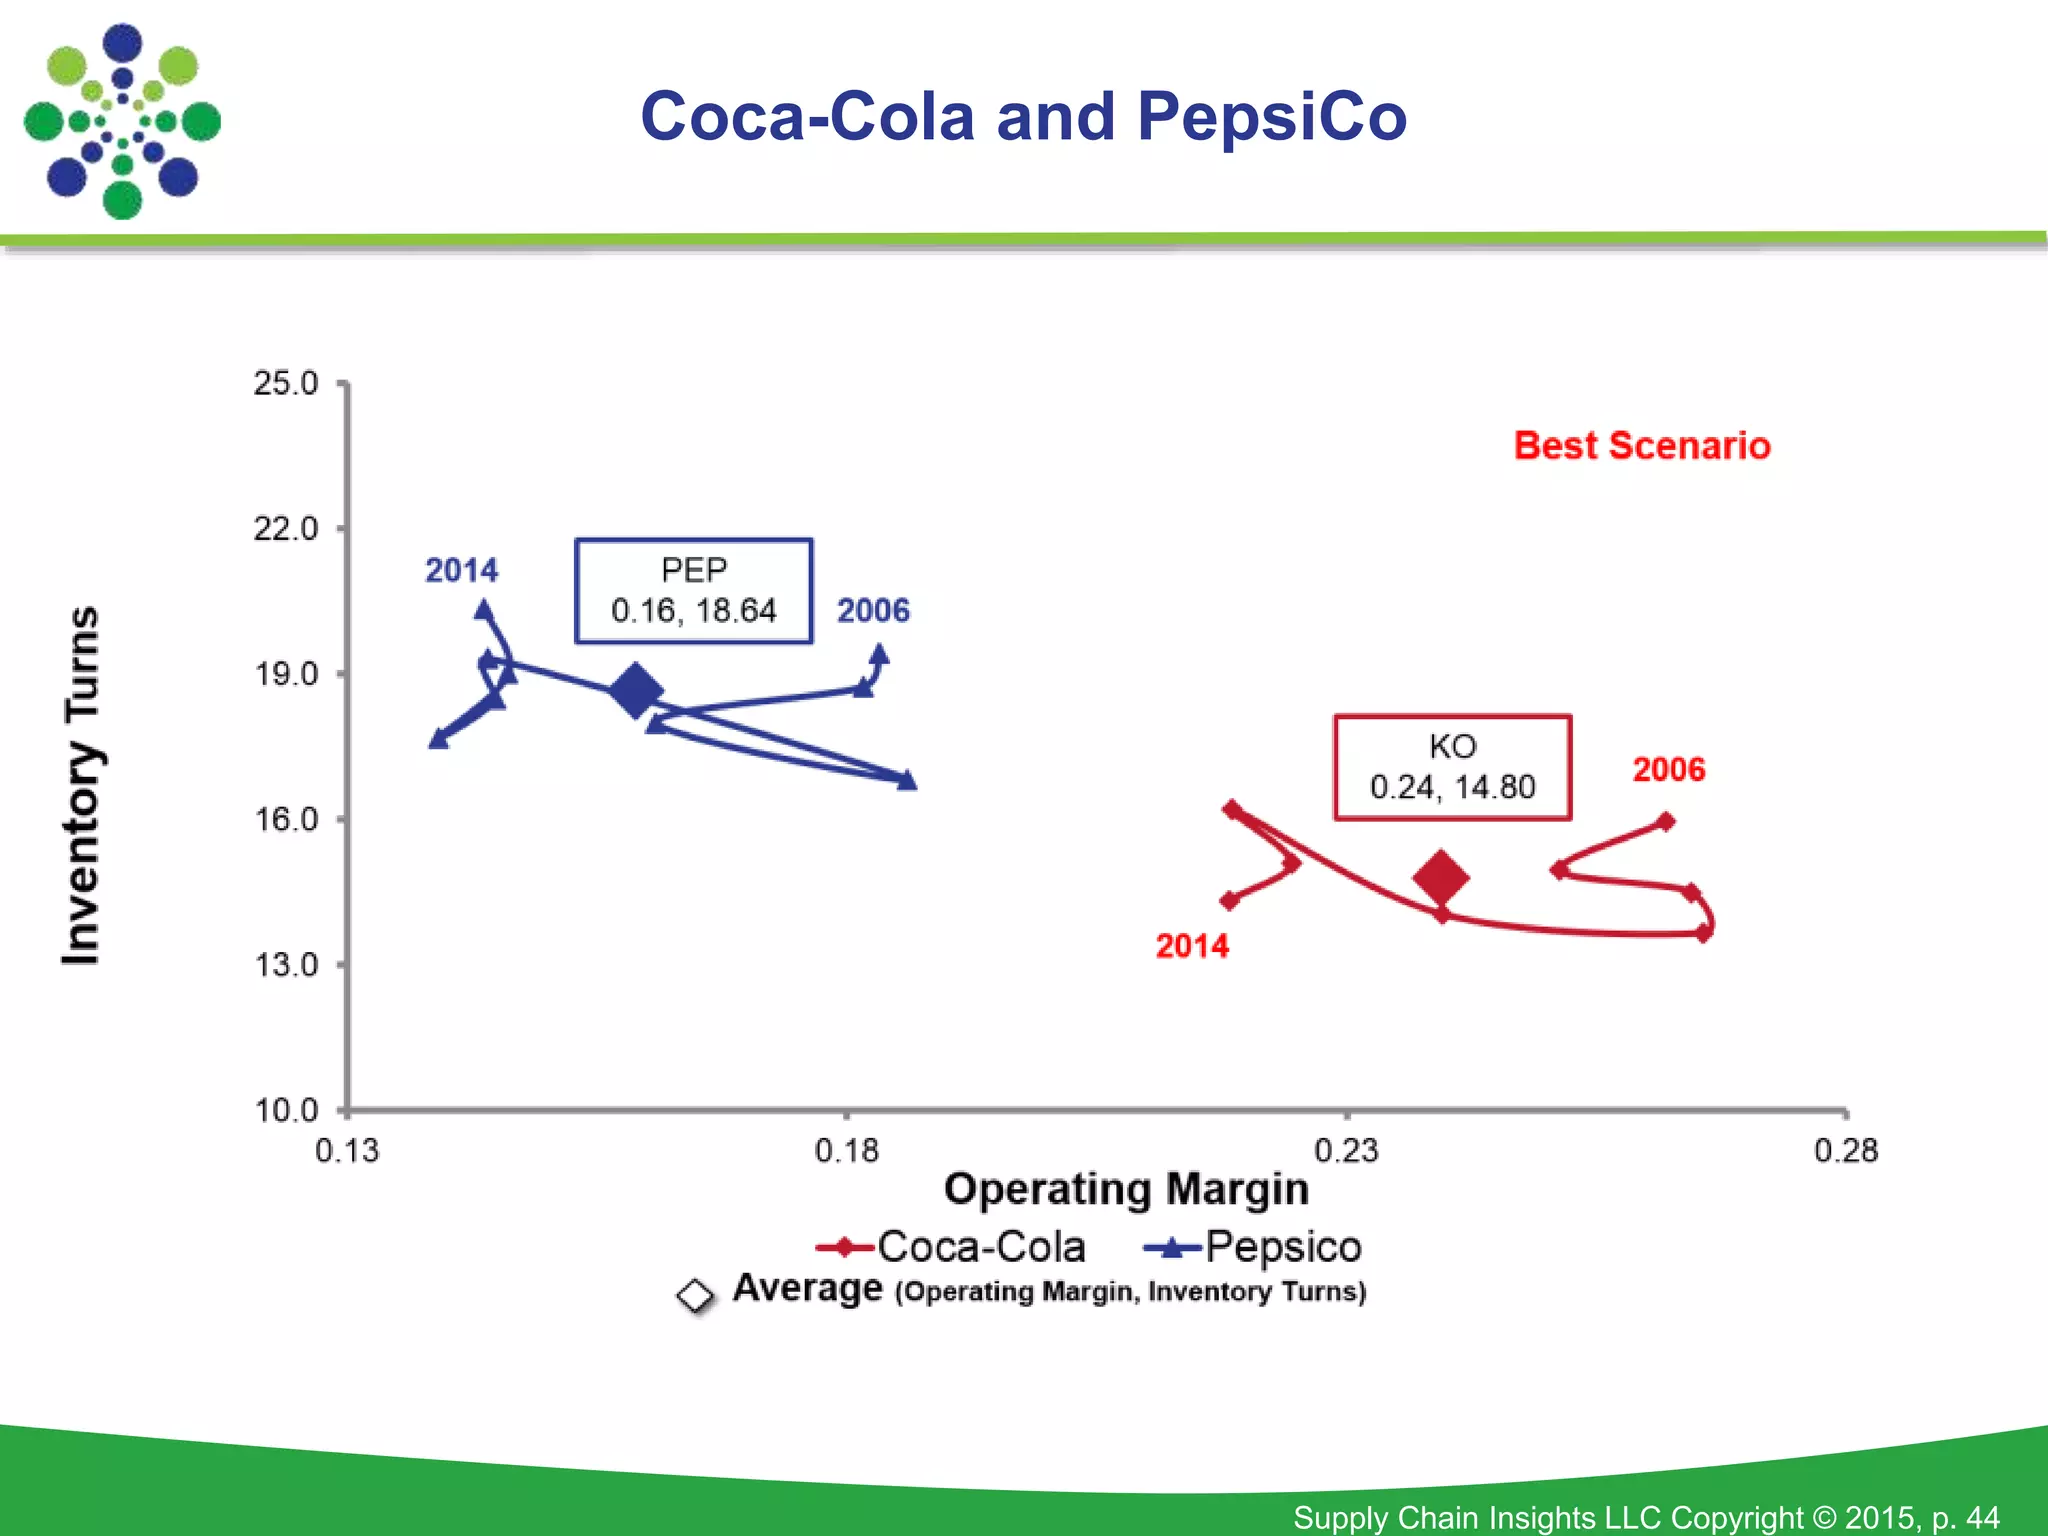
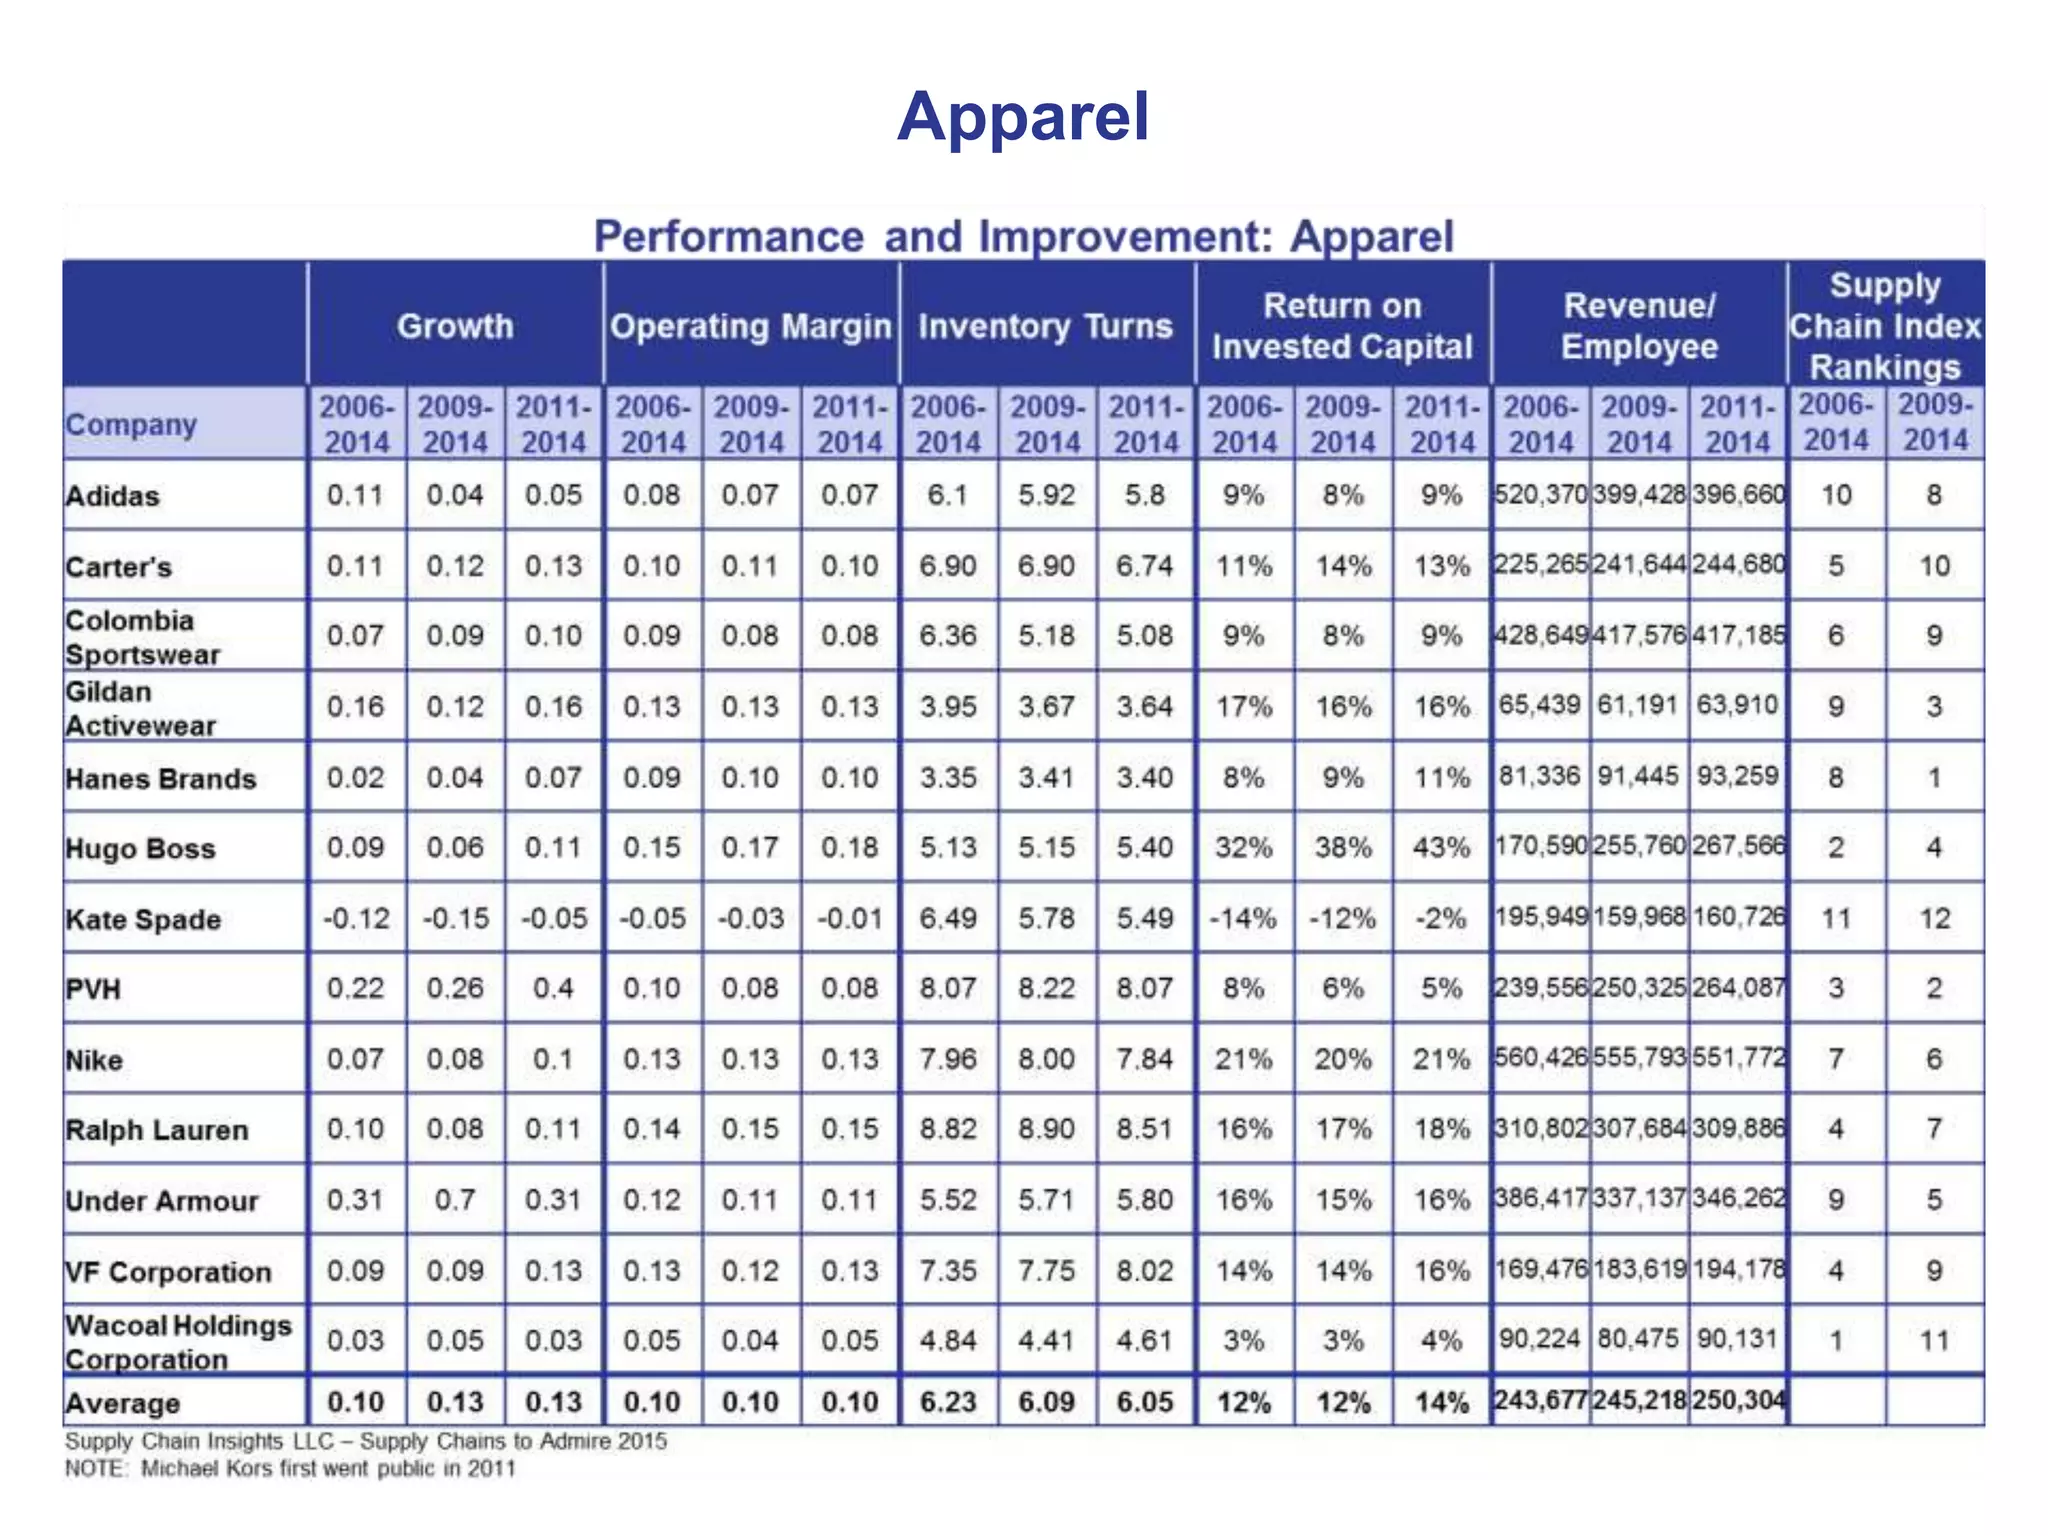
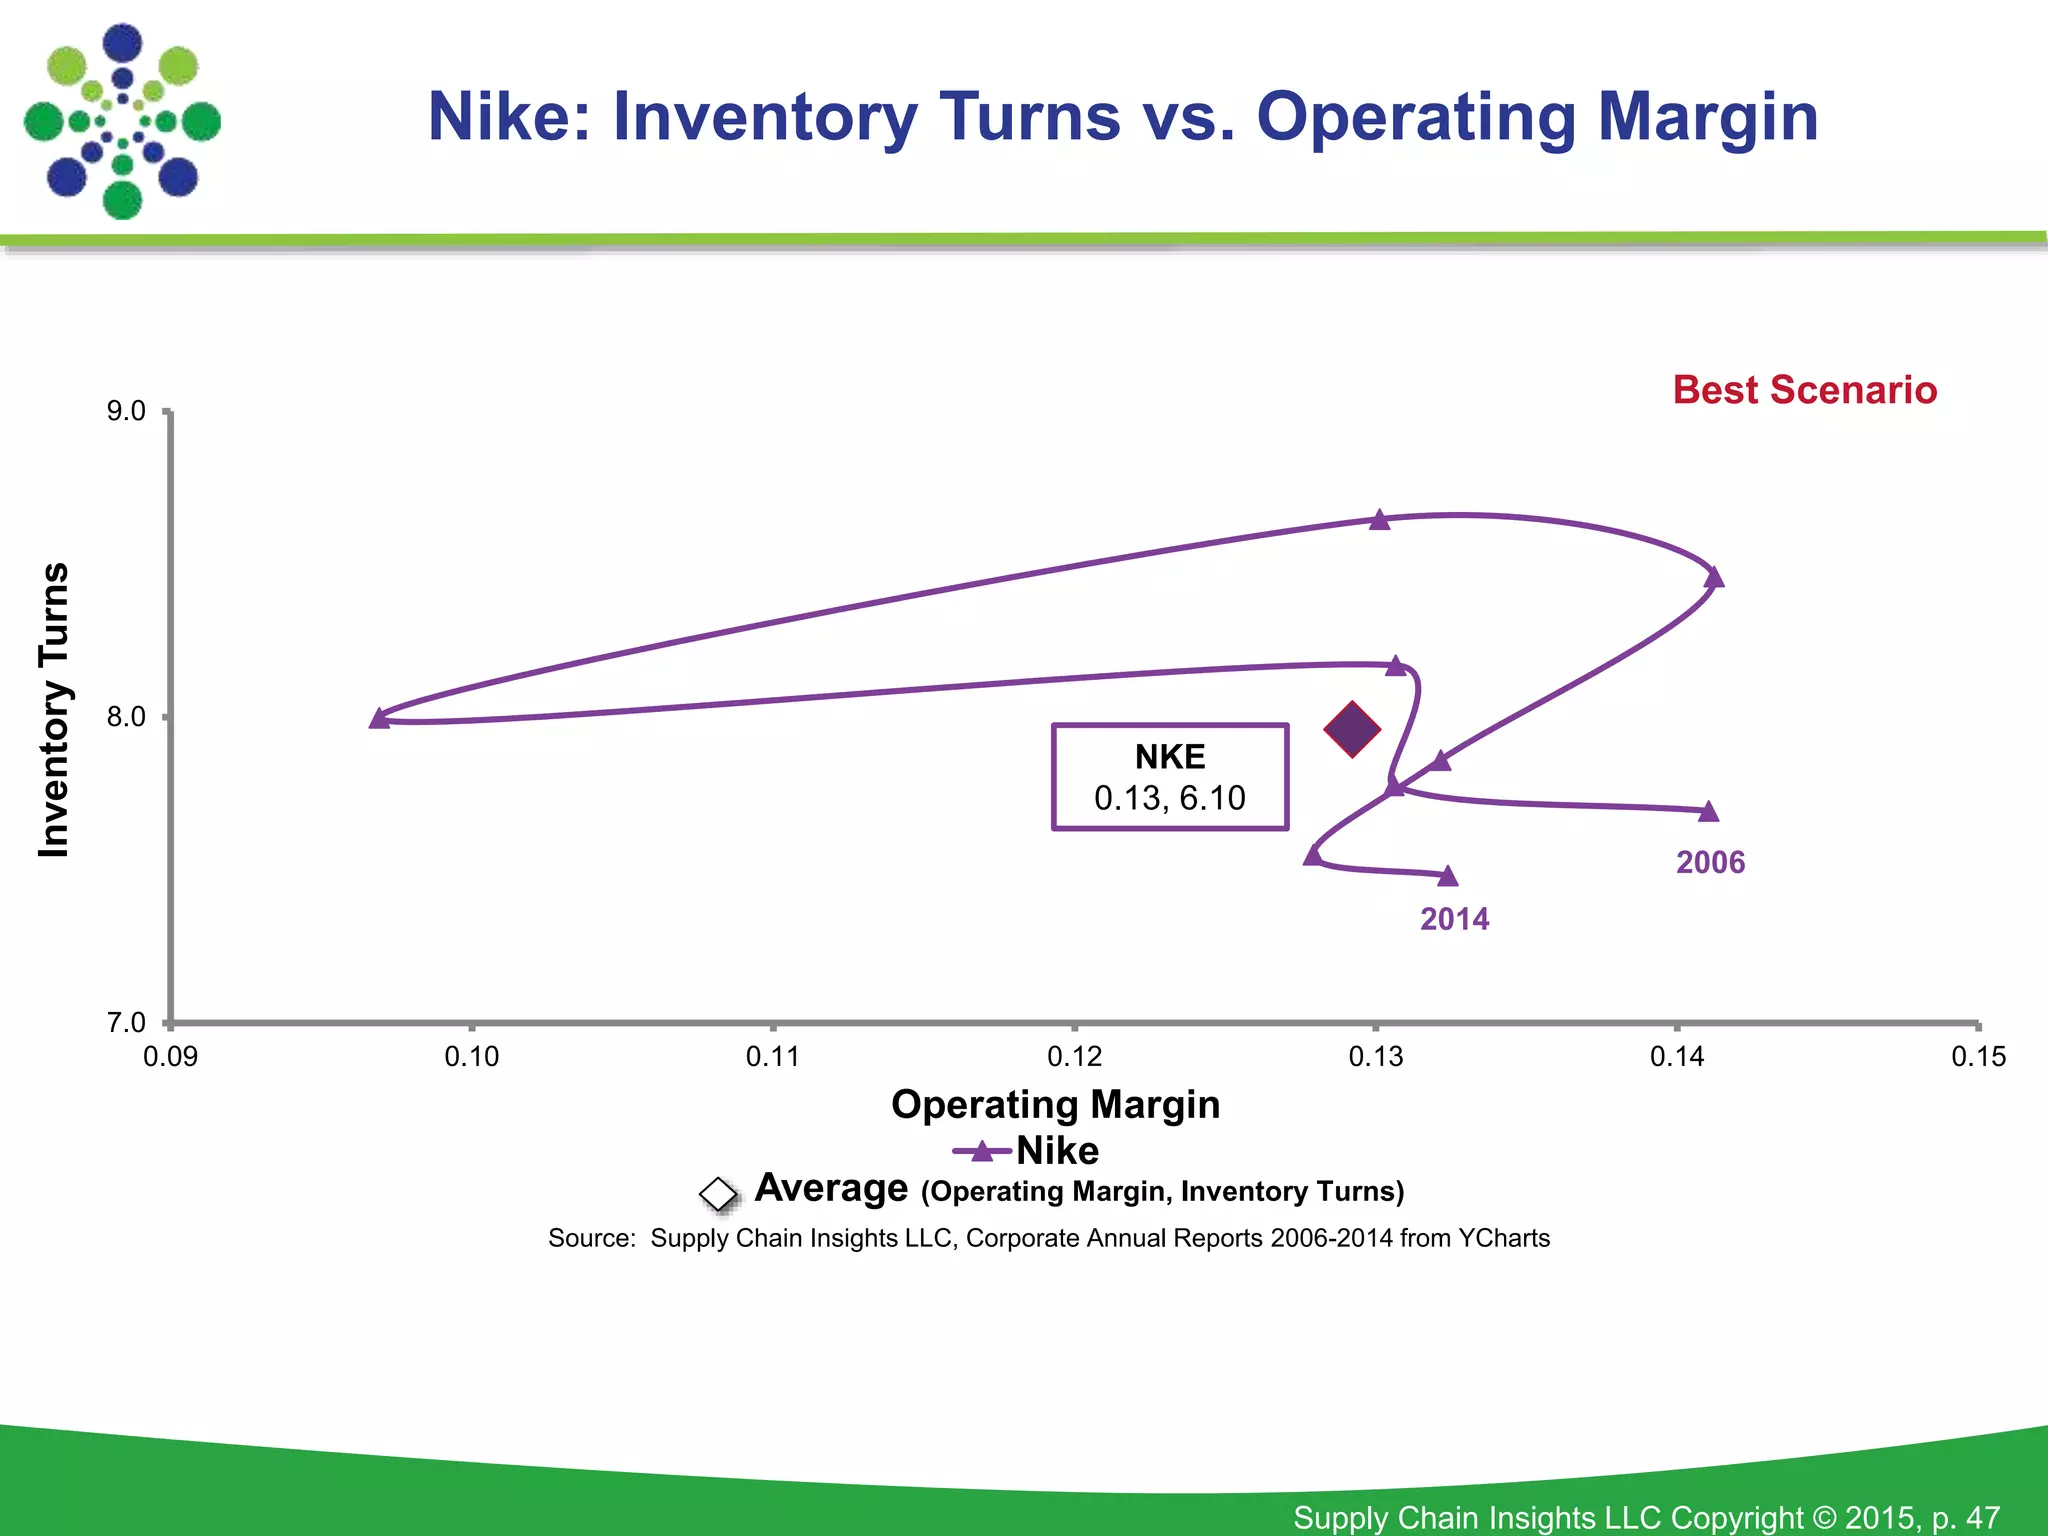
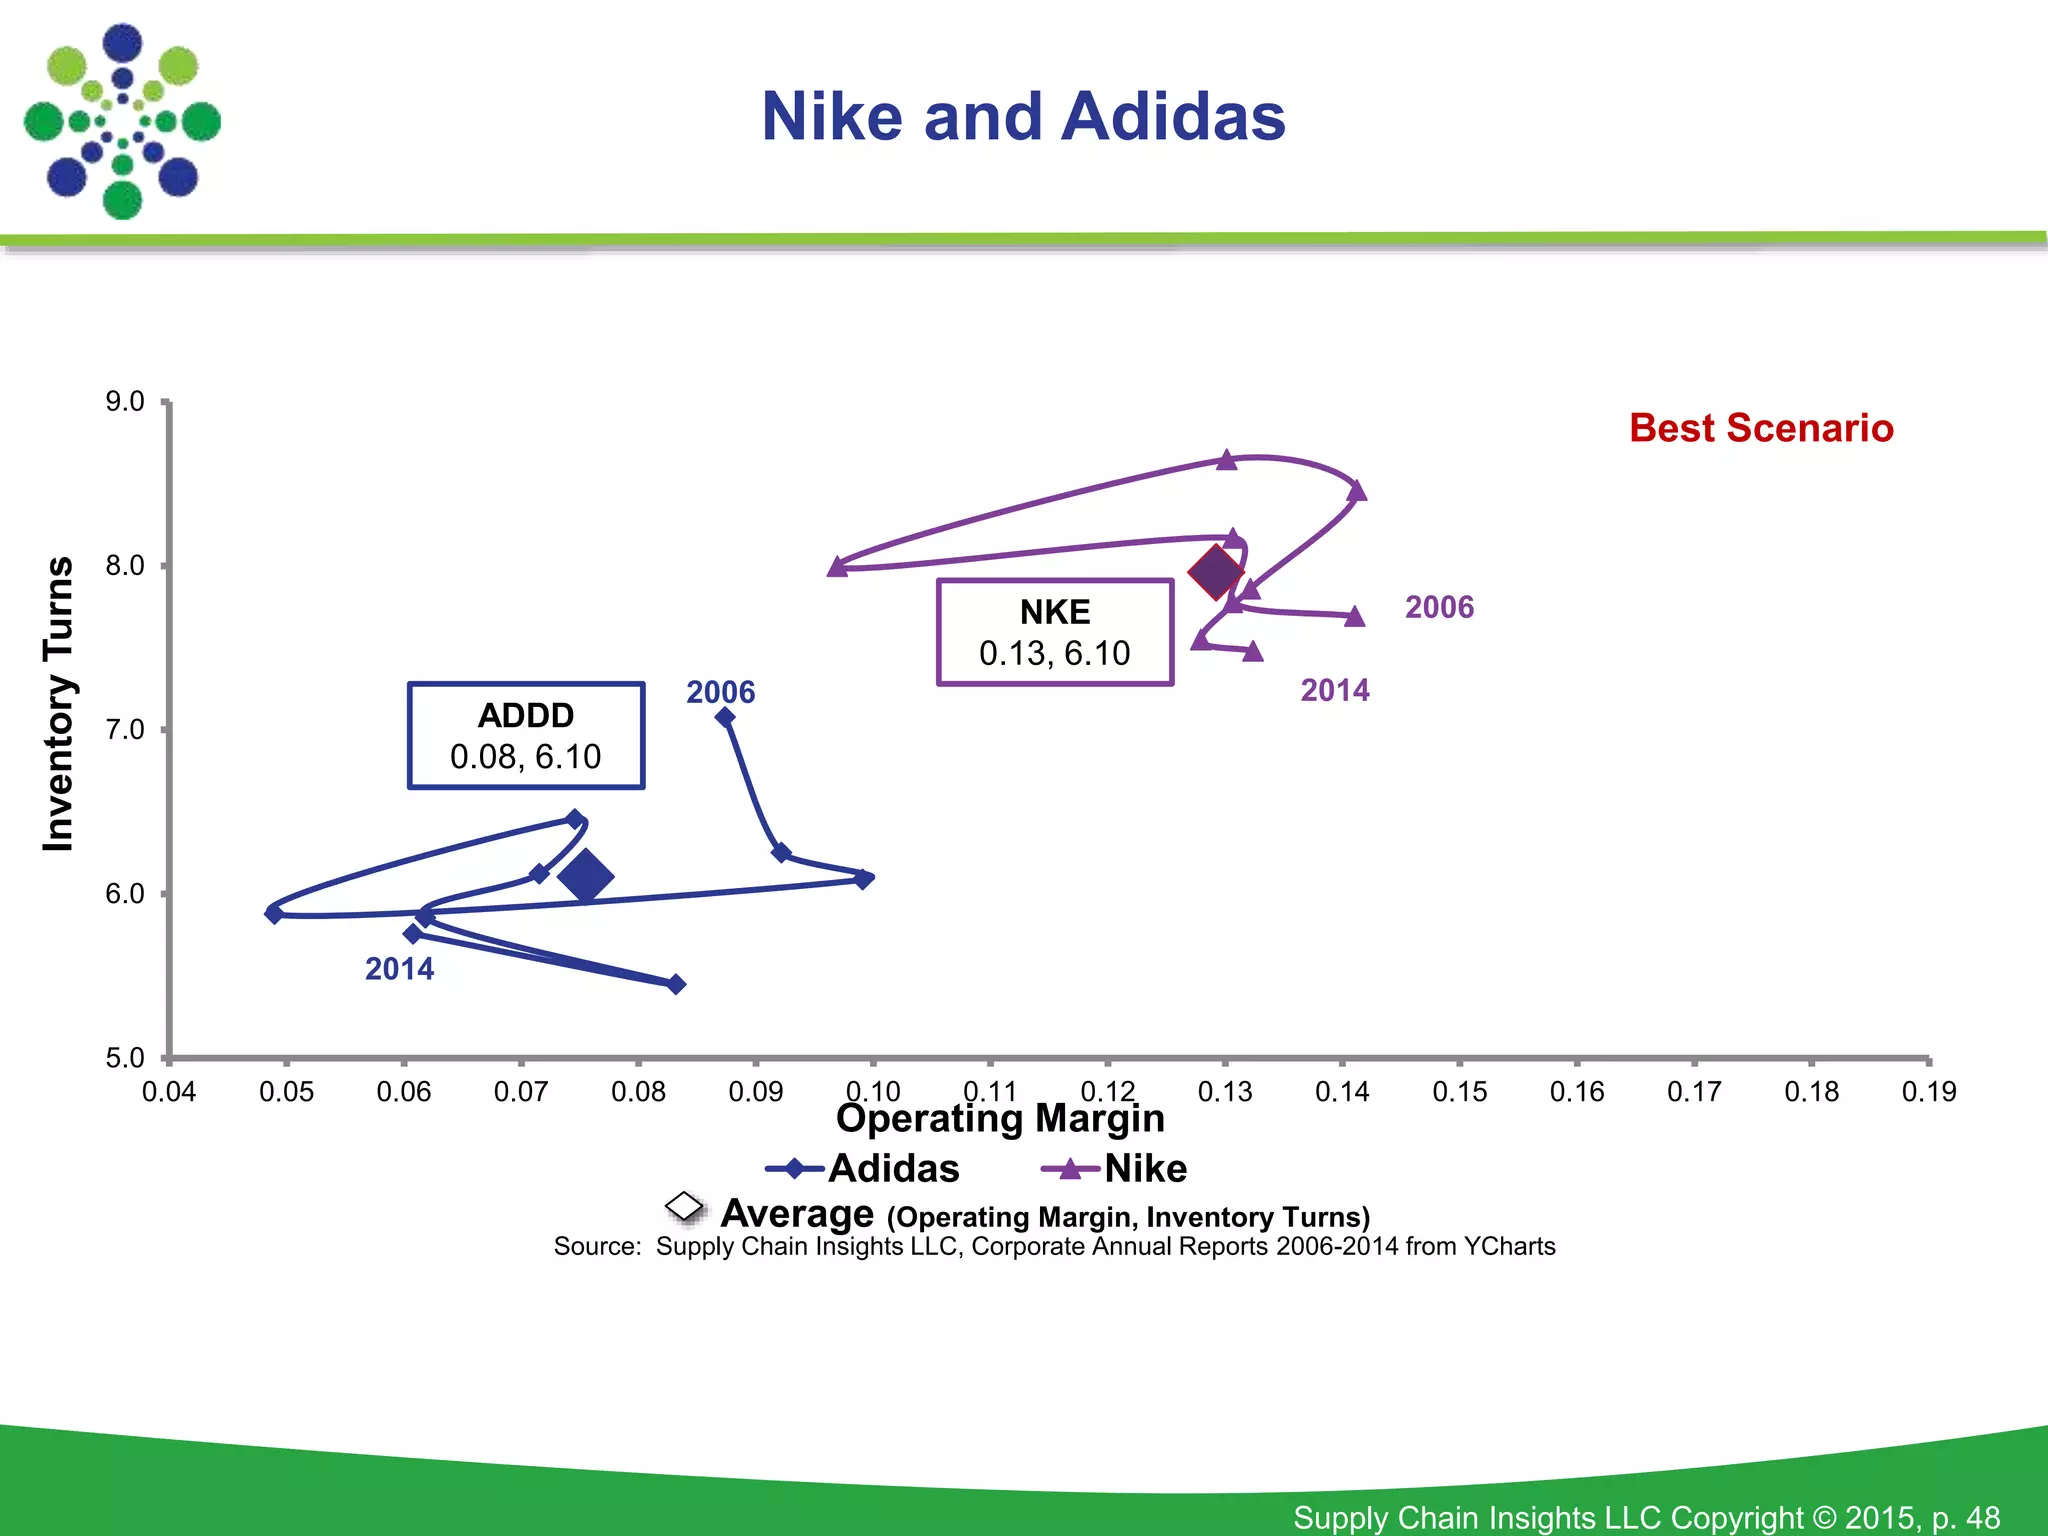
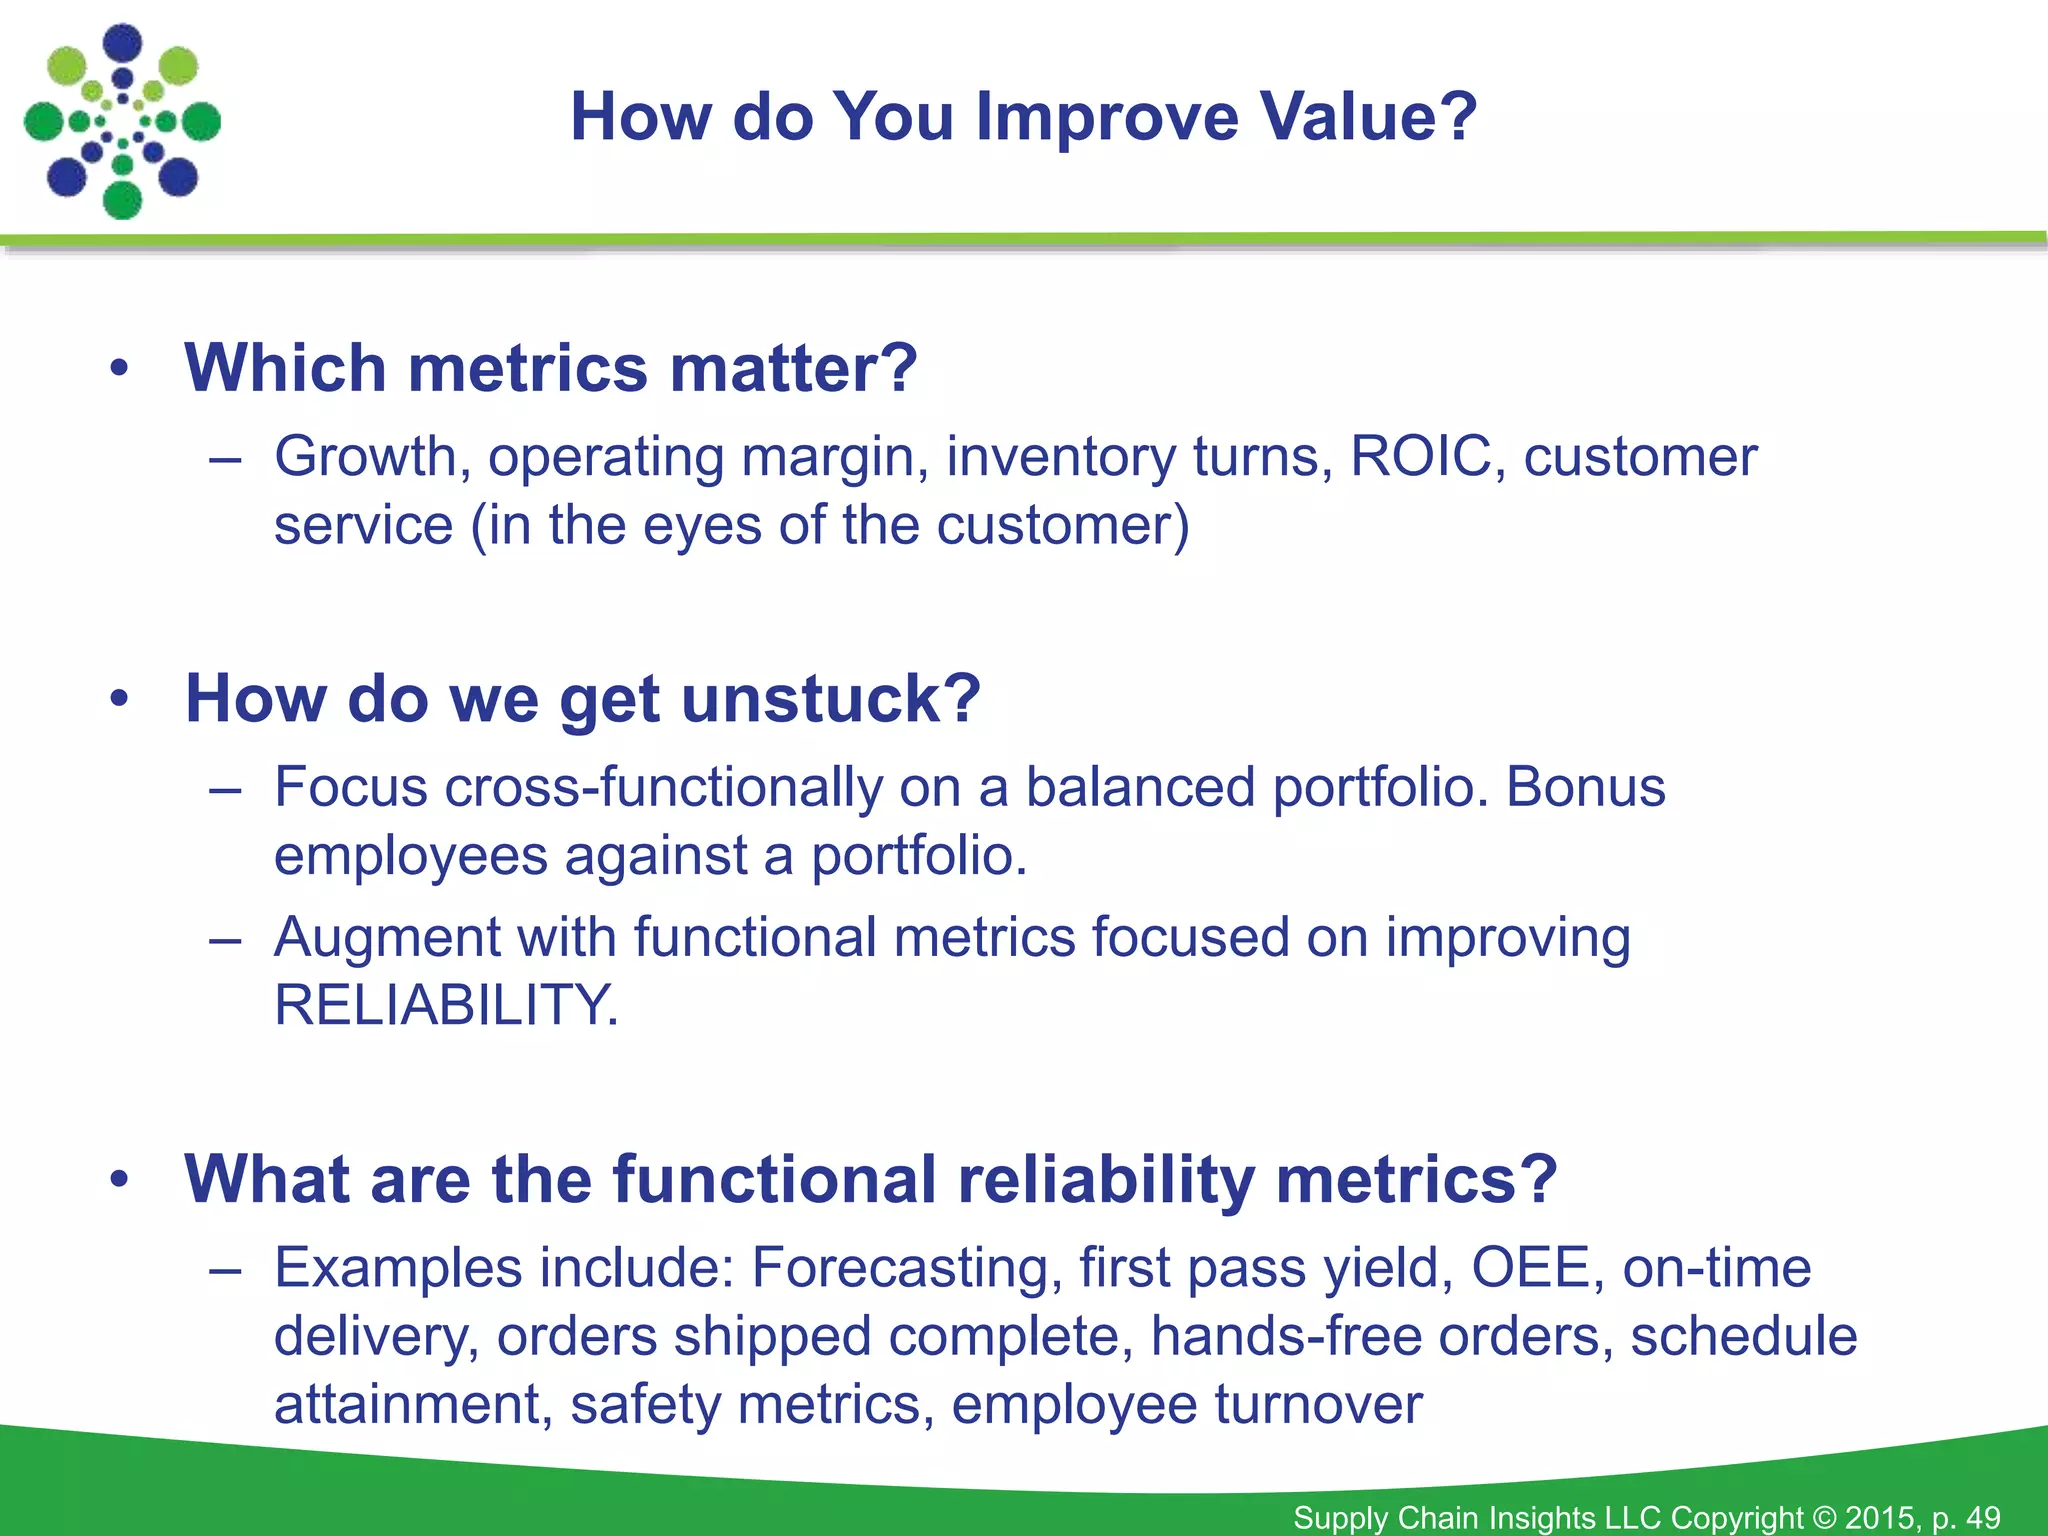
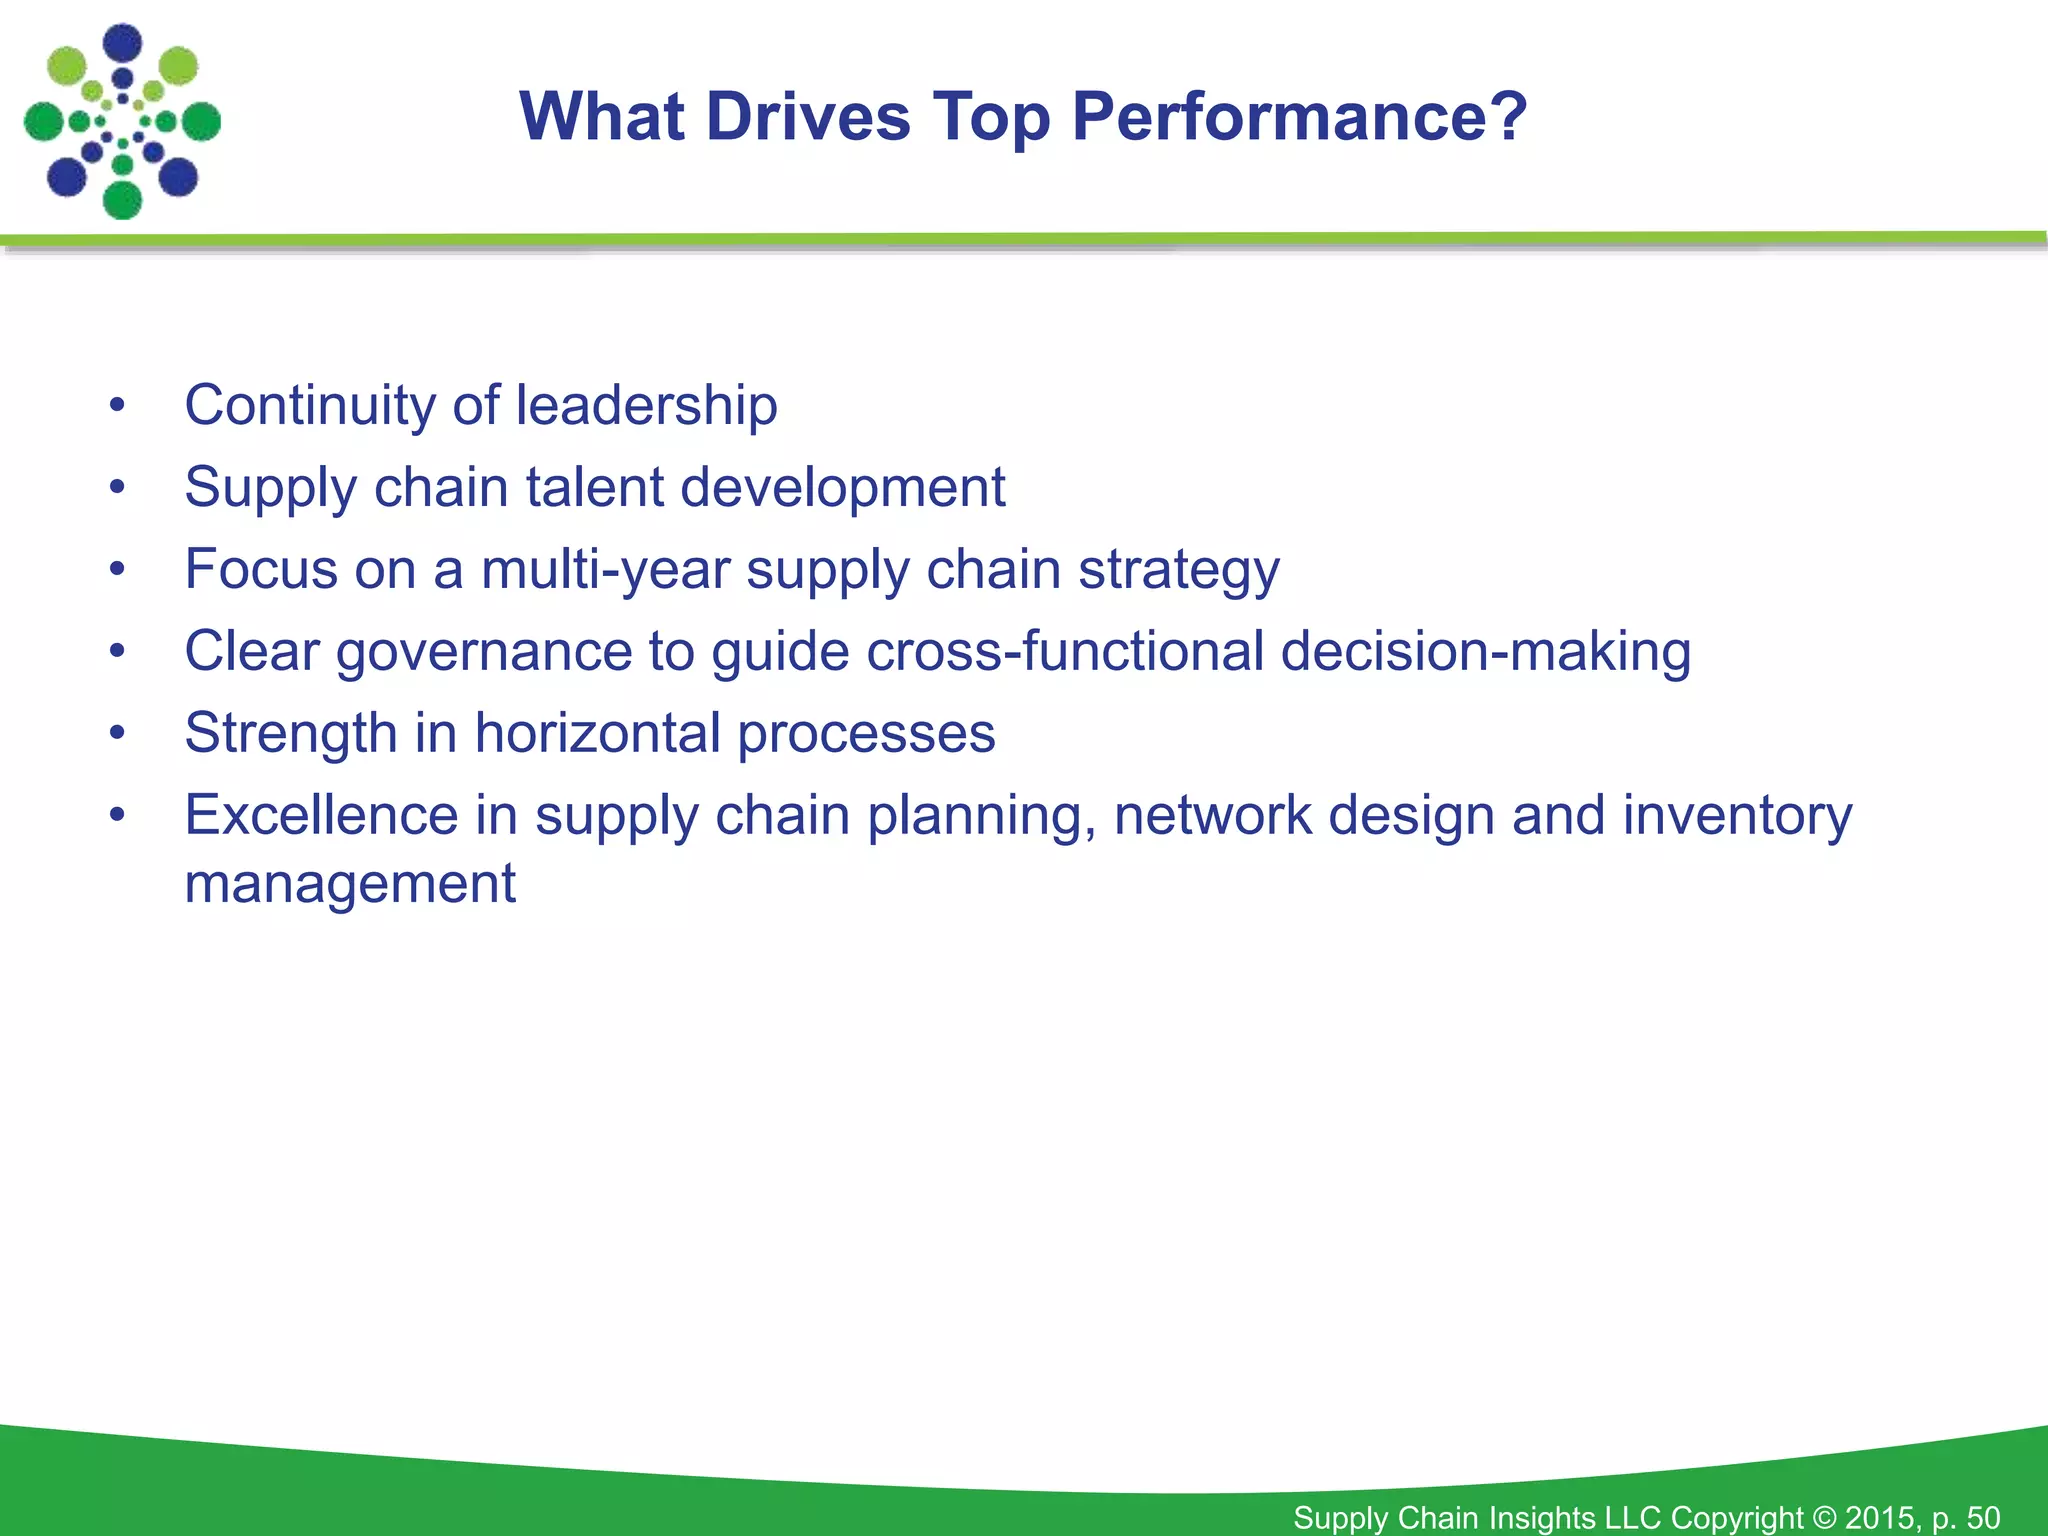
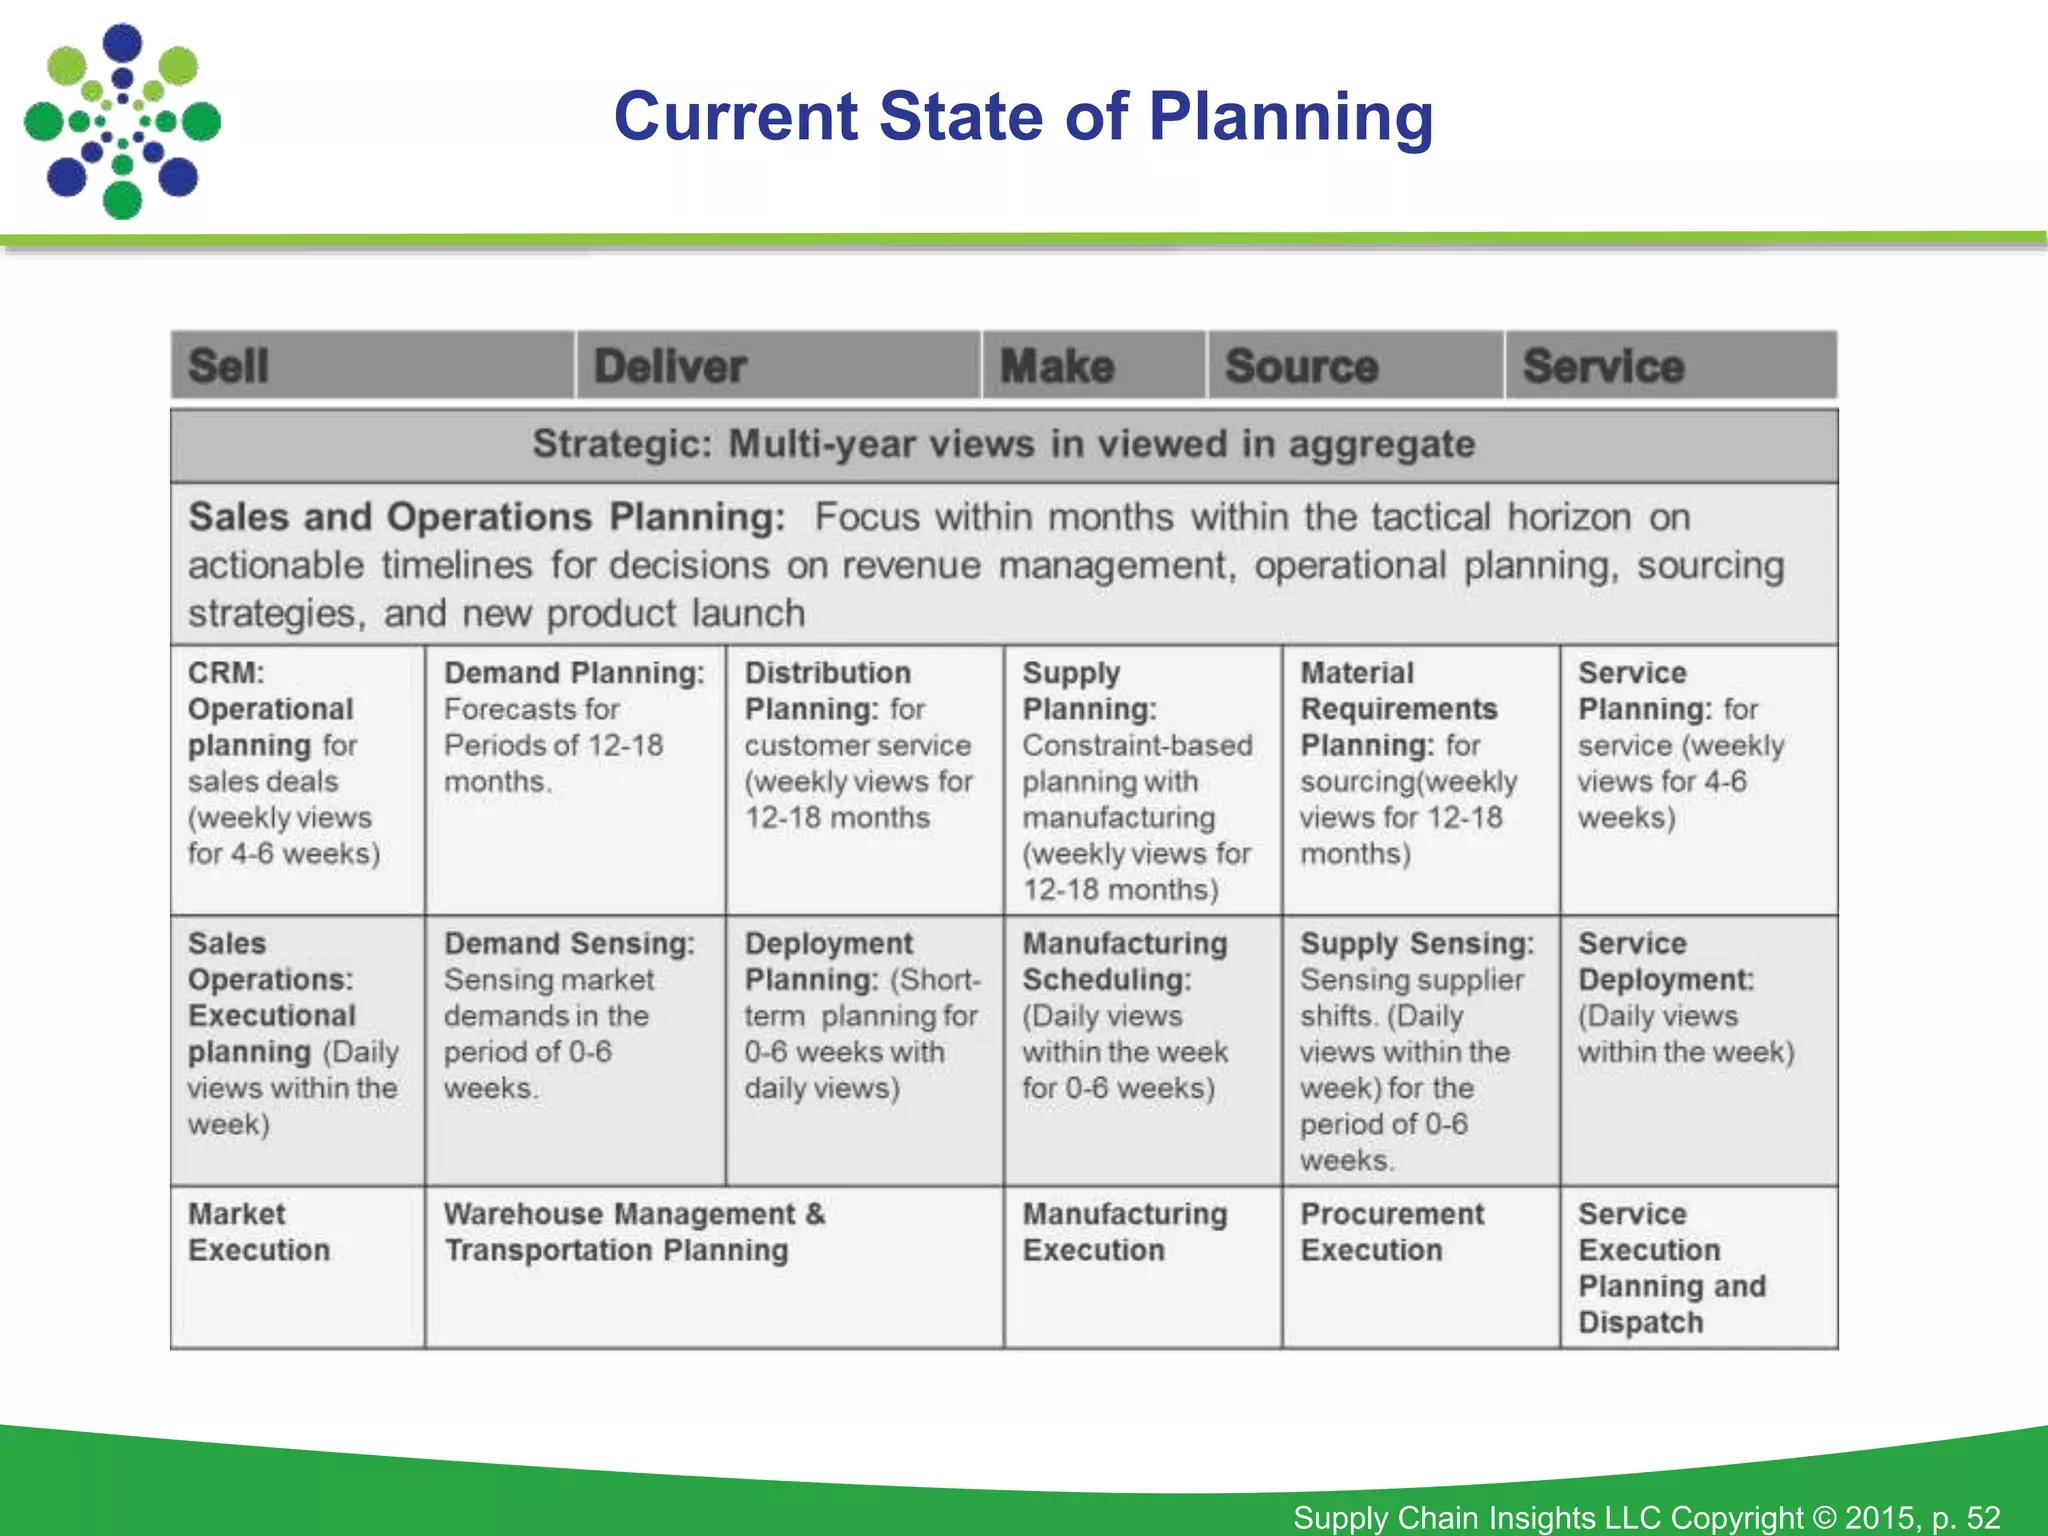
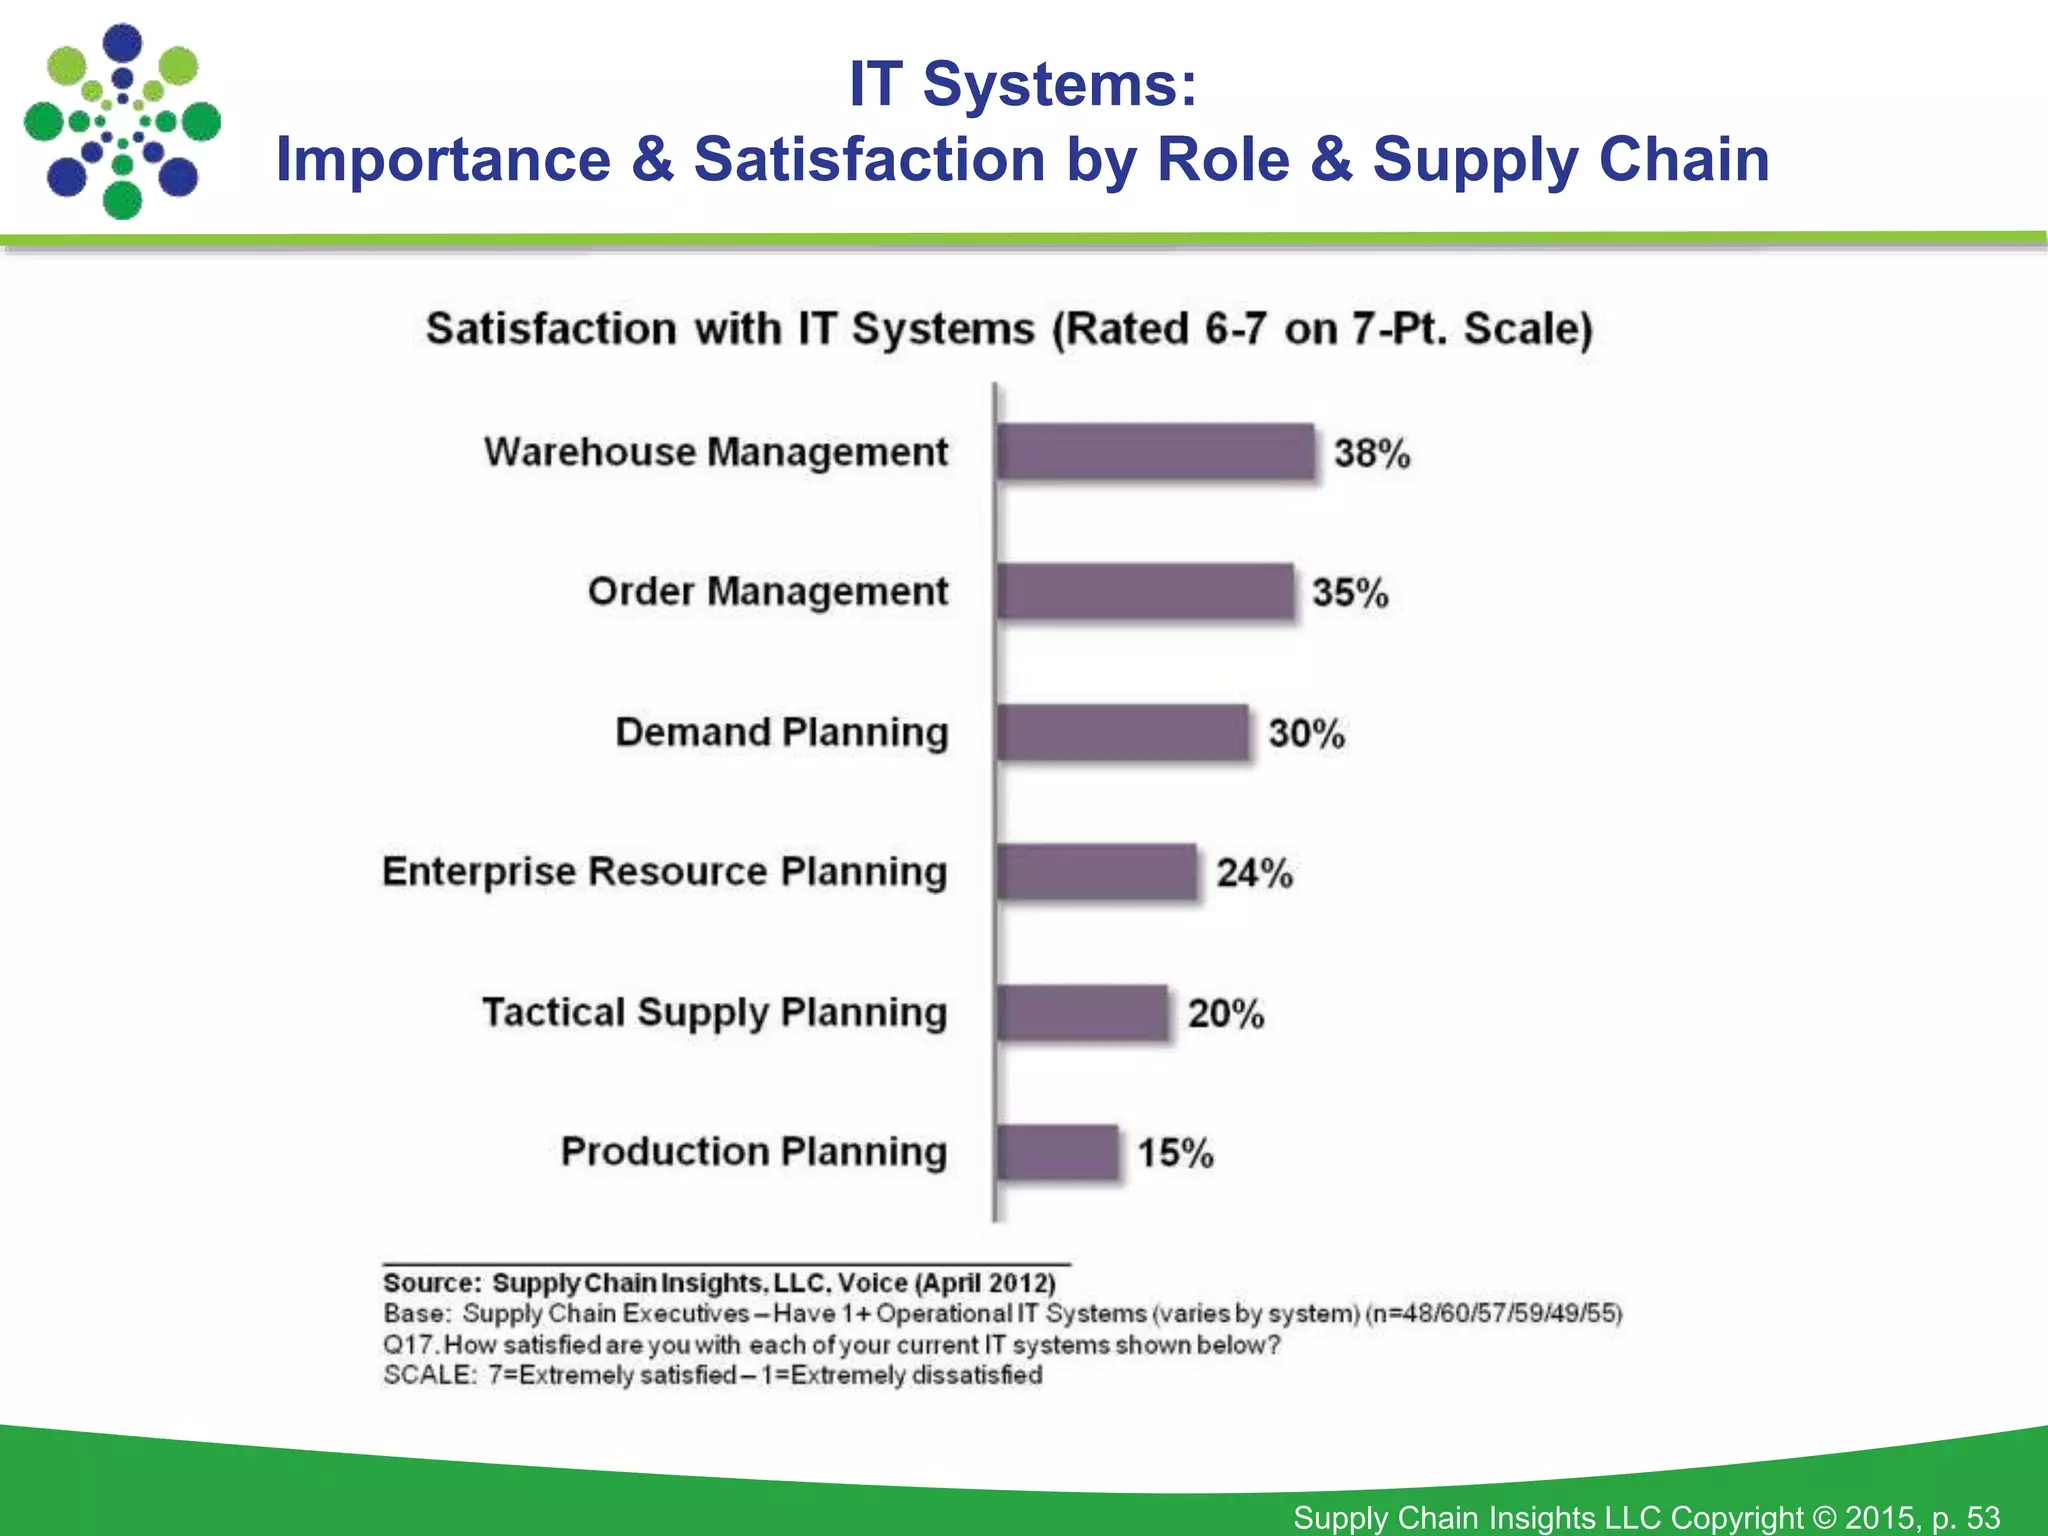
Supply Chain Insights LLC Copyright © 2015, p. 1
Metrics That Matter in a Market-
Driven World
September 2015
Supply Chain Insights LLC Copyright © 2015, p. 2
Disclaimer: I am a Skeptic
Supply Chain Insights LLC Copyright © 2015, p. 3
A Social Scientist
Supply Chain Insights LLC Copyright © 2015, p. 4
A Curmudgeon…
Supply Chain Insights LLC Copyright © 2015, p. 5
A Fortune-teller of Sorts….
Supply Chain Insights LLC Copyright © 2015, p. 6
We Write for the Supply Chain Leader
Supply Chain Insights LLC Copyright © 2015, p. 7
Four Years of Work
Wiley
December 2012
Wiley
December 2014
Self-published
September 2014
Self-publishing
September 2015
#SCIWEBINAR
Supply Chain Insights LLC Copyright © 2015, p. 8
What is Supply Chain Excellence?
Supply Chain Insights LLC Copyright © 2015, p. 9
• Metrics That Matter: Metrics that can be improved by the supply
chain leader and have high correlation to market capitalization.
• Market-Driven: The ability to sense and respond from market-to-
market (from the customer’s customer to the supplier’s supplier)
• NAICS Codes: US census classification(s) of industry groupings.
• Orbit Chart: A comparison of year-over-year improvement between
two supply chain metrics.
• Supply Chain Index: A methodology developed by Supply Chain
Insights in 2014 to measure supply chain improvement based on orbit
chart measurements.
• Supply Chains to Admire: An objective, and independent analysis of
supply chains that are outperforming in the Supply Chain Metrics That
Matter and are driving supply chain improvement as measured by the
Supply Chain Index.
Let’s Start with Definitions
Supply Chain Insights LLC Copyright © 2015, p. 10
Current State
Supply Chain Insights LLC Copyright © 2015, p. 11
9 out of 10 Supply Chains are Stuck
Supply Chain Insights LLC Copyright © 2015, p. 12
Progress: All Industries
Industry Snapshots (2006-2013)
Industry
Year –over-
Year Revenue
Growth
Operating
Margin
Inventory
Turns
Cash-to-
Cash Cycle
Revenue per
Employee
(K$)
SG&A
Ratio
Retail Apparel Industry
18%
39%
0.39
27%
05
05%
68
26%
325
18%
27%
05%
Apparel Manufacturing Industry
14%
82%
0.12
32%
05
68%
150
08%
400
355%
27%
63%
Mass Retail Industry
09%
50%
0.06
20%
06
06%
03
148%
350
48%
23%
6%
Beverage Industry
09%
61%
0.19
16%
02
04%
53
46%
512
NC
24%
16%
Pharmaceutical Industry
08%
47%
0.23
29%
03
16%
155
47%
572
32%
27%
08%
Chemical Industry
08%
45%
0.10
10%
06
04%
87
23%
557
23%
14%
27%
Medical Device Industry
06%
38%
0.14
32%
02
13%
206
16%
351
12%
34%
04%
Grocery Retail Industry
06%
31%
0.03
37%
17
01%
10
50%
405
54%
14%
06%
Consumer Packaged Goods
05%
25%
0.14
73%
08
482%
72
17%
333
14%
26%
09%
Food Industry
05%
55%
0.10
19%
07
17%
40
04%
534
55%
20%
18%
Source: Supply Chain Insights LLC, Corporate Annual Reports 2006-2013
Industry Average comprised of public companies (combined food & beverage industry: NAICS 3112% where % is any number from 0-9, 311320, 311520, 311821,
311941 & 312111), (chemical: NAICS 325188 & 325998), (consumer packaged goods: NAICS 3256% where % is any number from 0-9), (medical device
industry: NAICS 339112), (pharmaceutical industry: NAICS 325412) reporting in One Source with 20123annual sales greater than $1billion
NC=no change
Supply Chain Insights LLC Copyright © 2015, p. 13
Descriptors Used by Leaders
Supply Chain Insights LLC Copyright © 2015, p. 14
Improvement With Effective S&OP
Supply Chain Insights LLC Copyright © 2015, p. 15
Fallacy: Functional Excellence
Supply Chain Insights LLC Copyright © 2015, p. 16
A Project-based Focus
Supply Chain Insights LLC Copyright © 2015, p. 17
Which Metrics Matter?
Supply Chain Insights LLC Copyright © 2015, p. 18
What We Expected
Supply Chain Insights LLC Copyright © 2015, p. 19
A Supply Chain
is a Complex System
with Complex
Processes
with Increasing
Complexity
What We Learned….
Supply Chain Insights LLC Copyright © 2015, p. 20
The Supply Chain Effective Frontier
Supply Chain Insights LLC Copyright © 2015, p. 21
Why? The Long Tail of the Supply Chain:
Growing Complexity
Supply Chain Insights LLC Copyright © 2015, p. 22
Correlations to Market Capitalization
Supply Chain Insights LLC Copyright © 2015, p. 23
Orbit Chart: Wal-Mart
(Inventory Turns and Operating Margin)
Supply Chain Insights LLC Copyright © 2015, p. 24
Orbit Chart: Apple
(Inventory Turns and Operating Margin)
Supply Chain Insights LLC Copyright © 2015, p. 25
Orbit Charts: Dow Chemical Company
Supply Chain Insights LLC Copyright © 2015, p. 26
Measuring Supply Chain Improvement
Overall Ranking per Company
• Balance: Return on Invested Capital & Revenue Growth Vector Trajectory (30%)
• Strength: Inventory Turns & Operating Margin Vector Trajectory (30% of score)
• Resiliency: Inventory Turns & Operating Margin Mean Distance (30%)
𝑺𝒖𝒑𝒑𝒍𝒚 𝑪𝒉𝒂𝒊𝒏 𝑰𝒏𝒅𝒆𝒙 =
𝟏
𝟑
𝑩𝒂𝒍𝒂𝒏𝒄𝒆 𝑭𝒂𝒄𝒕𝒐𝒓 +
𝟏
𝟑
𝑺𝒕𝒓𝒆𝒏𝒈𝒕𝒉 𝑭𝒂𝒄𝒕𝒐𝒓 +
𝟏
𝟑
𝑹𝒆𝒔𝒊𝒍𝒊𝒆𝒏𝒄𝒚 𝑭𝒂𝒄𝒕𝒐𝒓
Supply Chain Insights LLC Copyright © 2015, p. 27
Supply Chains to Admire Methodology
Performance
Beats the industry
average for operating
margin, inventory turns
and ROIC for 2006-
2014 and 2009-2014
Improvement
Ranks above peer
group average on
The Supply Chain
Index for 2006-
2014 or 2009-2014
+
Supply Chain Insights LLC Copyright © 2015, p. 29
Winners Two Years in a Row
Supply Chain Insights LLC Copyright © 2015, p. 30
Consumer Products Group
Supply Chain Insights LLC Copyright © 2015, p. 31
Consumer Packaged Goods
Supply Chain Insights LLC Copyright © 2015, p. 32
Losing Ground: Kimberly-Clark
7.50
8.00
8.50
9.00
9.50
10.00
10.50
11.00
0.11 0.12 0.13 0.14 0.15 0.16 0.17 0.18 0.19
InventoryTurns
Operating Margin
Kimberly Clark
2000
2014
2001
2002
2003
2004
2005
2006
2007
2008
2009
2010
2011
2012
2013
Source: Supply Chain Insights LLC, Corporate Annual Reports 2002-2012 from YCharts
Best Scenario
KMB
0.15, 9.01
Trace the line from 2000
point to 2014 point to
follow the performance
over time.
The diamond shows the company’s
average over the period. Ex: The
Kimberly Clark Co. (KMB) has an
average of .15 for operating margin
and 9.01 for inventory turns.
Ideally,
companies are
increasing
inventory turns
and operating
margin moving
towards the
upper right
corner of the
graph over time.
Average (Operating Margin, Inventory Turns)
Here, we plot inventory turns (y-axis)
vs. operating margin (x-axis).
Supply Chain Insights LLC Copyright © 2015, p. 33
Colgate and Procter & Gamble
Supply Chain Insights LLC Copyright © 2015, p. 34
Colgate Versus Unilever
Supply Chain Insights LLC Copyright © 2015, p. 35
Beauty
Supply Chain Insights LLC Copyright © 2015, p. 36
Estee Lauder and L’Oreal
Supply Chain Insights LLC Copyright © 2015, p. 37
Food Manufacturing
Food
Supply Chain Insights LLC Copyright © 2015, p. 39
9.00
10.00
11.00
12.00
0.10 0.11 0.12 0.13 0.14 0.15 0.16 0.17 0.18 0.19 0.20 0.21 0.22 0.23 0.24 0.25
InventoryTurns
Operating Margin
General Mills
2000
2014
2001
2002
2003
2004
2005
2006
2007
2008
2009
2010
2011
2012
2013
General Mills:
Visualizing the Patterns
Source: Supply Chain Insights LLC, Corporate Annual Reports 2000-2014 from YCharts
Best Scenario
GIS
0.17, 10.77
Average (Revenue per Employee, Inventory Turns)
#SCIWEBINAR
Supply Chain Insights LLC Copyright © 2015, p. 40
General Mills versus Kellogg
5.0
7.0
9.0
11.0
13.0
15.0
0.06 0.08 0.10 0.12 0.14 0.16 0.18 0.20
Operating Margin
General Mills Kellogg
K
0.14, 12.68
2014
2006
2014
2006
Source: Supply Chain Insights LLC, Corporate Annual Reports 2006-2014
GIS
0.17, 11.00
Average (Operating Margin, Inventory Turns)
InventoryTurns
Best Scenario
Supply Chain Insights LLC Copyright © 2015, p. 41
Hershey and Danone
Supply Chain Insights LLC Copyright © 2015, p. 42
Beverages
Supply Chain Insights LLC Copyright © 2015, p. 43
10.00
12.00
14.00
16.00
18.00
20.00
22.00
0.08 0.11 0.14 0.17 0.20 0.23 0.26 0.29 0.32 0.35 0.38 0.41 0.44 0.47
InventoryTurns
Operating Margin
Anheuser-Busch Inbev SABMiller
2014
2006
2014
2006
AB Inbev versus SAB Miller
(2006 – 2014)
Source: Supply Chain Insights LLC, Corporate Annual Reports 2006-2014 from YCharts
Best Scenario
SBMRF
0.18, 17.14
Average (Operating Margin, Inventory Turns)
BUD
0.31, 14.57
#SCIWEBINAR
Supply Chain Insights LLC Copyright © 2015, p. 44
Coca-Cola and PepsiCo
Supply Chain Insights LLC Copyright © 2015, p. 45
Apparel
Apparel
Supply Chain Insights LLC Copyright © 2015, p. 47
Nike: Inventory Turns vs. Operating Margin
7.0
8.0
9.0
0.09 0.10 0.11 0.12 0.13 0.14 0.15
InventoryTurns
Operating Margin
Nike
2014
2006
Average (Operating Margin, Inventory Turns)
Source: Supply Chain Insights LLC, Corporate Annual Reports 2006-2014 from YCharts
Best Scenario
NKE
0.13, 6.10
Supply Chain Insights LLC Copyright © 2015, p. 48
Nike and Adidas
5.0
6.0
7.0
8.0
9.0
0.04 0.05 0.06 0.07 0.08 0.09 0.10 0.11 0.12 0.13 0.14 0.15 0.16 0.17 0.18 0.19
InventoryTurns
Operating Margin
Adidas Nike
2014
2006 2014
2006
Average (Operating Margin, Inventory Turns)
Source: Supply Chain Insights LLC, Corporate Annual Reports 2006-2014 from YCharts
Best Scenario
NKE
0.13, 6.10
ADDD
0.08, 6.10
Supply Chain Insights LLC Copyright © 2015, p. 49
• Which metrics matter?
– Growth, operating margin, inventory turns, ROIC, customer
service (in the eyes of the customer)
• How do we get unstuck?
– Focus cross-functionally on a balanced portfolio. Bonus
employees against a portfolio.
– Augment with functional metrics focused on improving
RELIABILITY.
• What are the functional reliability metrics?
– Examples include: Forecasting, first pass yield, OEE, on-time
delivery, orders shipped complete, hands-free orders, schedule
attainment, safety metrics, employee turnover
How do You Improve Value?
Supply Chain Insights LLC Copyright © 2015, p. 50
• Continuity of leadership
• Supply chain talent development
• Focus on a multi-year supply chain strategy
• Clear governance to guide cross-functional decision-making
• Strength in horizontal processes
• Excellence in supply chain planning, network design and inventory
management
What Drives Top Performance?
Supply Chain Insights LLC Copyright © 2015, p. 51
Why Technology
Matters
Supply Chain Insights LLC Copyright © 2015, p. 52
Current State of Planning
Supply Chain Insights LLC Copyright © 2015, p. 53
IT Systems:
Importance & Satisfaction by Role & Supply Chain
Supply Chain Insights LLC Copyright © 2015, p. 54
Gaps in Visibility
Supply Chain Insights LLC Copyright © 2015, p. 55
Best of Breed versus ERP Planning
Supply Chain Insights LLC Copyright © 2015, p. 56
S&OP: Technology Matters
Supply Chain Insights LLC Copyright © 2015, p. 57
4.4X Higher Agility
Supply Chain Insights LLC Copyright © 2015, p. 58
Effective S&OP: Improved Alignment
Supply Chain Insights LLC Copyright © 2015, p. 59
• Kill the Spreadsheet Ghettos!!!
• Work for Clarity of the Supply Chain Planning
Footprint and Time Horizons
• Carefully Define the Terms.
• Be Clear on the Goal: Responsive, Efficient and
Agile
• Ensure the Fit of the Model
• Redefine Demand to be About the Market
• Give Planners Time to Plan
How do You Improve Value Through Planning?
Supply Chain Insights LLC Copyright © 2015, p. 60
Launches
Oct. 15,
2015
Supply Chain Insights LLC Copyright © 2015, p. 62
Founder: Lora Cecere
• Founder of Supply Chain Insights
• “LinkedIn Influencer”
• Guest blogger for Forbes
• Author of 4 books: Bricks Matter (2012), Shaman’s Journal (2014)
and Supply Chain Metrics That Matter (December 2014), Shaman’s Journal (2014)
• Partner at Altimeter Group (leader in open research)
• 7 years of Management Experience leading Analyst Teams at Gartner
and AMR Research
• 8 years Experience in Marketing and Selling Supply Chain Software at
Descartes Systems Group and Manugistics (now JDA)
• 15 Years Leading teams in Manufacturing and Distribution operations for
Clorox, Kraft/General Foods, Nestle/Dreyers Grand Ice Cream and
Procter & Gamble.
Contact Information:
• Email: lora.cecere@supplychaininsights.com
• Blog: www.supplychainshaman.com (8,000 pageviews/month)
• Forbes: http://www.forbes.com/search/?q=lora+cecere
• Twitter: lcecere (6200 followers)
• LinkedIn: linkedin.com/pub/lora-cecere/0/196/573 (46,000 followers)

Metrics That Matter in a Market-Driven World

  • 1.
    Supply Chain InsightsLLC Copyright © 2015, p. 1 Metrics That Matter in a Market- Driven World September 2015
  • 2.
    Supply Chain InsightsLLC Copyright © 2015, p. 2 Disclaimer: I am a Skeptic
  • 3.
    Supply Chain InsightsLLC Copyright © 2015, p. 3 A Social Scientist
  • 4.
    Supply Chain InsightsLLC Copyright © 2015, p. 4 A Curmudgeon…
  • 5.
    Supply Chain InsightsLLC Copyright © 2015, p. 5 A Fortune-teller of Sorts….
  • 6.
    Supply Chain InsightsLLC Copyright © 2015, p. 6 We Write for the Supply Chain Leader
  • 7.
    Supply Chain InsightsLLC Copyright © 2015, p. 7 Four Years of Work Wiley December 2012 Wiley December 2014 Self-published September 2014 Self-publishing September 2015 #SCIWEBINAR
  • 8.
    Supply Chain InsightsLLC Copyright © 2015, p. 8 What is Supply Chain Excellence?
  • 9.
    Supply Chain InsightsLLC Copyright © 2015, p. 9 • Metrics That Matter: Metrics that can be improved by the supply chain leader and have high correlation to market capitalization. • Market-Driven: The ability to sense and respond from market-to- market (from the customer’s customer to the supplier’s supplier) • NAICS Codes: US census classification(s) of industry groupings. • Orbit Chart: A comparison of year-over-year improvement between two supply chain metrics. • Supply Chain Index: A methodology developed by Supply Chain Insights in 2014 to measure supply chain improvement based on orbit chart measurements. • Supply Chains to Admire: An objective, and independent analysis of supply chains that are outperforming in the Supply Chain Metrics That Matter and are driving supply chain improvement as measured by the Supply Chain Index. Let’s Start with Definitions
  • 10.
    Supply Chain InsightsLLC Copyright © 2015, p. 10 Current State
  • 11.
    Supply Chain InsightsLLC Copyright © 2015, p. 11 9 out of 10 Supply Chains are Stuck
  • 12.
    Supply Chain InsightsLLC Copyright © 2015, p. 12 Progress: All Industries Industry Snapshots (2006-2013) Industry Year –over- Year Revenue Growth Operating Margin Inventory Turns Cash-to- Cash Cycle Revenue per Employee (K$) SG&A Ratio Retail Apparel Industry 18% 39% 0.39 27% 05 05% 68 26% 325 18% 27% 05% Apparel Manufacturing Industry 14% 82% 0.12 32% 05 68% 150 08% 400 355% 27% 63% Mass Retail Industry 09% 50% 0.06 20% 06 06% 03 148% 350 48% 23% 6% Beverage Industry 09% 61% 0.19 16% 02 04% 53 46% 512 NC 24% 16% Pharmaceutical Industry 08% 47% 0.23 29% 03 16% 155 47% 572 32% 27% 08% Chemical Industry 08% 45% 0.10 10% 06 04% 87 23% 557 23% 14% 27% Medical Device Industry 06% 38% 0.14 32% 02 13% 206 16% 351 12% 34% 04% Grocery Retail Industry 06% 31% 0.03 37% 17 01% 10 50% 405 54% 14% 06% Consumer Packaged Goods 05% 25% 0.14 73% 08 482% 72 17% 333 14% 26% 09% Food Industry 05% 55% 0.10 19% 07 17% 40 04% 534 55% 20% 18% Source: Supply Chain Insights LLC, Corporate Annual Reports 2006-2013 Industry Average comprised of public companies (combined food & beverage industry: NAICS 3112% where % is any number from 0-9, 311320, 311520, 311821, 311941 & 312111), (chemical: NAICS 325188 & 325998), (consumer packaged goods: NAICS 3256% where % is any number from 0-9), (medical device industry: NAICS 339112), (pharmaceutical industry: NAICS 325412) reporting in One Source with 20123annual sales greater than $1billion NC=no change
  • 13.
    Supply Chain InsightsLLC Copyright © 2015, p. 13 Descriptors Used by Leaders
  • 14.
    Supply Chain InsightsLLC Copyright © 2015, p. 14 Improvement With Effective S&OP
  • 15.
    Supply Chain InsightsLLC Copyright © 2015, p. 15 Fallacy: Functional Excellence
  • 16.
    Supply Chain InsightsLLC Copyright © 2015, p. 16 A Project-based Focus
  • 17.
    Supply Chain InsightsLLC Copyright © 2015, p. 17 Which Metrics Matter?
  • 18.
    Supply Chain InsightsLLC Copyright © 2015, p. 18 What We Expected
  • 19.
    Supply Chain InsightsLLC Copyright © 2015, p. 19 A Supply Chain is a Complex System with Complex Processes with Increasing Complexity What We Learned….
  • 20.
    Supply Chain InsightsLLC Copyright © 2015, p. 20 The Supply Chain Effective Frontier
  • 21.
    Supply Chain InsightsLLC Copyright © 2015, p. 21 Why? The Long Tail of the Supply Chain: Growing Complexity
  • 22.
    Supply Chain InsightsLLC Copyright © 2015, p. 22 Correlations to Market Capitalization
  • 23.
    Supply Chain InsightsLLC Copyright © 2015, p. 23 Orbit Chart: Wal-Mart (Inventory Turns and Operating Margin)
  • 24.
    Supply Chain InsightsLLC Copyright © 2015, p. 24 Orbit Chart: Apple (Inventory Turns and Operating Margin)
  • 25.
    Supply Chain InsightsLLC Copyright © 2015, p. 25 Orbit Charts: Dow Chemical Company
  • 26.
    Supply Chain InsightsLLC Copyright © 2015, p. 26 Measuring Supply Chain Improvement Overall Ranking per Company • Balance: Return on Invested Capital & Revenue Growth Vector Trajectory (30%) • Strength: Inventory Turns & Operating Margin Vector Trajectory (30% of score) • Resiliency: Inventory Turns & Operating Margin Mean Distance (30%) 𝑺𝒖𝒑𝒑𝒍𝒚 𝑪𝒉𝒂𝒊𝒏 𝑰𝒏𝒅𝒆𝒙 = 𝟏 𝟑 𝑩𝒂𝒍𝒂𝒏𝒄𝒆 𝑭𝒂𝒄𝒕𝒐𝒓 + 𝟏 𝟑 𝑺𝒕𝒓𝒆𝒏𝒈𝒕𝒉 𝑭𝒂𝒄𝒕𝒐𝒓 + 𝟏 𝟑 𝑹𝒆𝒔𝒊𝒍𝒊𝒆𝒏𝒄𝒚 𝑭𝒂𝒄𝒕𝒐𝒓
  • 27.
    Supply Chain InsightsLLC Copyright © 2015, p. 27 Supply Chains to Admire Methodology Performance Beats the industry average for operating margin, inventory turns and ROIC for 2006- 2014 and 2009-2014 Improvement Ranks above peer group average on The Supply Chain Index for 2006- 2014 or 2009-2014 +
  • 29.
    Supply Chain InsightsLLC Copyright © 2015, p. 29 Winners Two Years in a Row
  • 30.
    Supply Chain InsightsLLC Copyright © 2015, p. 30 Consumer Products Group
  • 31.
    Supply Chain InsightsLLC Copyright © 2015, p. 31 Consumer Packaged Goods
  • 32.
    Supply Chain InsightsLLC Copyright © 2015, p. 32 Losing Ground: Kimberly-Clark 7.50 8.00 8.50 9.00 9.50 10.00 10.50 11.00 0.11 0.12 0.13 0.14 0.15 0.16 0.17 0.18 0.19 InventoryTurns Operating Margin Kimberly Clark 2000 2014 2001 2002 2003 2004 2005 2006 2007 2008 2009 2010 2011 2012 2013 Source: Supply Chain Insights LLC, Corporate Annual Reports 2002-2012 from YCharts Best Scenario KMB 0.15, 9.01 Trace the line from 2000 point to 2014 point to follow the performance over time. The diamond shows the company’s average over the period. Ex: The Kimberly Clark Co. (KMB) has an average of .15 for operating margin and 9.01 for inventory turns. Ideally, companies are increasing inventory turns and operating margin moving towards the upper right corner of the graph over time. Average (Operating Margin, Inventory Turns) Here, we plot inventory turns (y-axis) vs. operating margin (x-axis).
  • 33.
    Supply Chain InsightsLLC Copyright © 2015, p. 33 Colgate and Procter & Gamble
  • 34.
    Supply Chain InsightsLLC Copyright © 2015, p. 34 Colgate Versus Unilever
  • 35.
    Supply Chain InsightsLLC Copyright © 2015, p. 35 Beauty
  • 36.
    Supply Chain InsightsLLC Copyright © 2015, p. 36 Estee Lauder and L’Oreal
  • 37.
    Supply Chain InsightsLLC Copyright © 2015, p. 37 Food Manufacturing
  • 38.
  • 39.
    Supply Chain InsightsLLC Copyright © 2015, p. 39 9.00 10.00 11.00 12.00 0.10 0.11 0.12 0.13 0.14 0.15 0.16 0.17 0.18 0.19 0.20 0.21 0.22 0.23 0.24 0.25 InventoryTurns Operating Margin General Mills 2000 2014 2001 2002 2003 2004 2005 2006 2007 2008 2009 2010 2011 2012 2013 General Mills: Visualizing the Patterns Source: Supply Chain Insights LLC, Corporate Annual Reports 2000-2014 from YCharts Best Scenario GIS 0.17, 10.77 Average (Revenue per Employee, Inventory Turns) #SCIWEBINAR
  • 40.
    Supply Chain InsightsLLC Copyright © 2015, p. 40 General Mills versus Kellogg 5.0 7.0 9.0 11.0 13.0 15.0 0.06 0.08 0.10 0.12 0.14 0.16 0.18 0.20 Operating Margin General Mills Kellogg K 0.14, 12.68 2014 2006 2014 2006 Source: Supply Chain Insights LLC, Corporate Annual Reports 2006-2014 GIS 0.17, 11.00 Average (Operating Margin, Inventory Turns) InventoryTurns Best Scenario
  • 41.
    Supply Chain InsightsLLC Copyright © 2015, p. 41 Hershey and Danone
  • 42.
    Supply Chain InsightsLLC Copyright © 2015, p. 42 Beverages
  • 43.
    Supply Chain InsightsLLC Copyright © 2015, p. 43 10.00 12.00 14.00 16.00 18.00 20.00 22.00 0.08 0.11 0.14 0.17 0.20 0.23 0.26 0.29 0.32 0.35 0.38 0.41 0.44 0.47 InventoryTurns Operating Margin Anheuser-Busch Inbev SABMiller 2014 2006 2014 2006 AB Inbev versus SAB Miller (2006 – 2014) Source: Supply Chain Insights LLC, Corporate Annual Reports 2006-2014 from YCharts Best Scenario SBMRF 0.18, 17.14 Average (Operating Margin, Inventory Turns) BUD 0.31, 14.57 #SCIWEBINAR
  • 44.
    Supply Chain InsightsLLC Copyright © 2015, p. 44 Coca-Cola and PepsiCo
  • 45.
    Supply Chain InsightsLLC Copyright © 2015, p. 45 Apparel
  • 46.
  • 47.
    Supply Chain InsightsLLC Copyright © 2015, p. 47 Nike: Inventory Turns vs. Operating Margin 7.0 8.0 9.0 0.09 0.10 0.11 0.12 0.13 0.14 0.15 InventoryTurns Operating Margin Nike 2014 2006 Average (Operating Margin, Inventory Turns) Source: Supply Chain Insights LLC, Corporate Annual Reports 2006-2014 from YCharts Best Scenario NKE 0.13, 6.10
  • 48.
    Supply Chain InsightsLLC Copyright © 2015, p. 48 Nike and Adidas 5.0 6.0 7.0 8.0 9.0 0.04 0.05 0.06 0.07 0.08 0.09 0.10 0.11 0.12 0.13 0.14 0.15 0.16 0.17 0.18 0.19 InventoryTurns Operating Margin Adidas Nike 2014 2006 2014 2006 Average (Operating Margin, Inventory Turns) Source: Supply Chain Insights LLC, Corporate Annual Reports 2006-2014 from YCharts Best Scenario NKE 0.13, 6.10 ADDD 0.08, 6.10
  • 49.
    Supply Chain InsightsLLC Copyright © 2015, p. 49 • Which metrics matter? – Growth, operating margin, inventory turns, ROIC, customer service (in the eyes of the customer) • How do we get unstuck? – Focus cross-functionally on a balanced portfolio. Bonus employees against a portfolio. – Augment with functional metrics focused on improving RELIABILITY. • What are the functional reliability metrics? – Examples include: Forecasting, first pass yield, OEE, on-time delivery, orders shipped complete, hands-free orders, schedule attainment, safety metrics, employee turnover How do You Improve Value?
  • 50.
    Supply Chain InsightsLLC Copyright © 2015, p. 50 • Continuity of leadership • Supply chain talent development • Focus on a multi-year supply chain strategy • Clear governance to guide cross-functional decision-making • Strength in horizontal processes • Excellence in supply chain planning, network design and inventory management What Drives Top Performance?
  • 51.
    Supply Chain InsightsLLC Copyright © 2015, p. 51 Why Technology Matters
  • 52.
    Supply Chain InsightsLLC Copyright © 2015, p. 52 Current State of Planning
  • 53.
    Supply Chain InsightsLLC Copyright © 2015, p. 53 IT Systems: Importance & Satisfaction by Role & Supply Chain
  • 54.
    Supply Chain InsightsLLC Copyright © 2015, p. 54 Gaps in Visibility
  • 55.
    Supply Chain InsightsLLC Copyright © 2015, p. 55 Best of Breed versus ERP Planning
  • 56.
    Supply Chain InsightsLLC Copyright © 2015, p. 56 S&OP: Technology Matters
  • 57.
    Supply Chain InsightsLLC Copyright © 2015, p. 57 4.4X Higher Agility
  • 58.
    Supply Chain InsightsLLC Copyright © 2015, p. 58 Effective S&OP: Improved Alignment
  • 59.
    Supply Chain InsightsLLC Copyright © 2015, p. 59 • Kill the Spreadsheet Ghettos!!! • Work for Clarity of the Supply Chain Planning Footprint and Time Horizons • Carefully Define the Terms. • Be Clear on the Goal: Responsive, Efficient and Agile • Ensure the Fit of the Model • Redefine Demand to be About the Market • Give Planners Time to Plan How do You Improve Value Through Planning?
  • 60.
    Supply Chain InsightsLLC Copyright © 2015, p. 60
  • 61.
  • 62.
    Supply Chain InsightsLLC Copyright © 2015, p. 62 Founder: Lora Cecere • Founder of Supply Chain Insights • “LinkedIn Influencer” • Guest blogger for Forbes • Author of 4 books: Bricks Matter (2012), Shaman’s Journal (2014) and Supply Chain Metrics That Matter (December 2014), Shaman’s Journal (2014) • Partner at Altimeter Group (leader in open research) • 7 years of Management Experience leading Analyst Teams at Gartner and AMR Research • 8 years Experience in Marketing and Selling Supply Chain Software at Descartes Systems Group and Manugistics (now JDA) • 15 Years Leading teams in Manufacturing and Distribution operations for Clorox, Kraft/General Foods, Nestle/Dreyers Grand Ice Cream and Procter & Gamble. Contact Information: • Email: lora.cecere@supplychaininsights.com • Blog: www.supplychainshaman.com (8,000 pageviews/month) • Forbes: http://www.forbes.com/search/?q=lora+cecere • Twitter: lcecere (6200 followers) • LinkedIn: linkedin.com/pub/lora-cecere/0/196/573 (46,000 followers)