Download to read offline


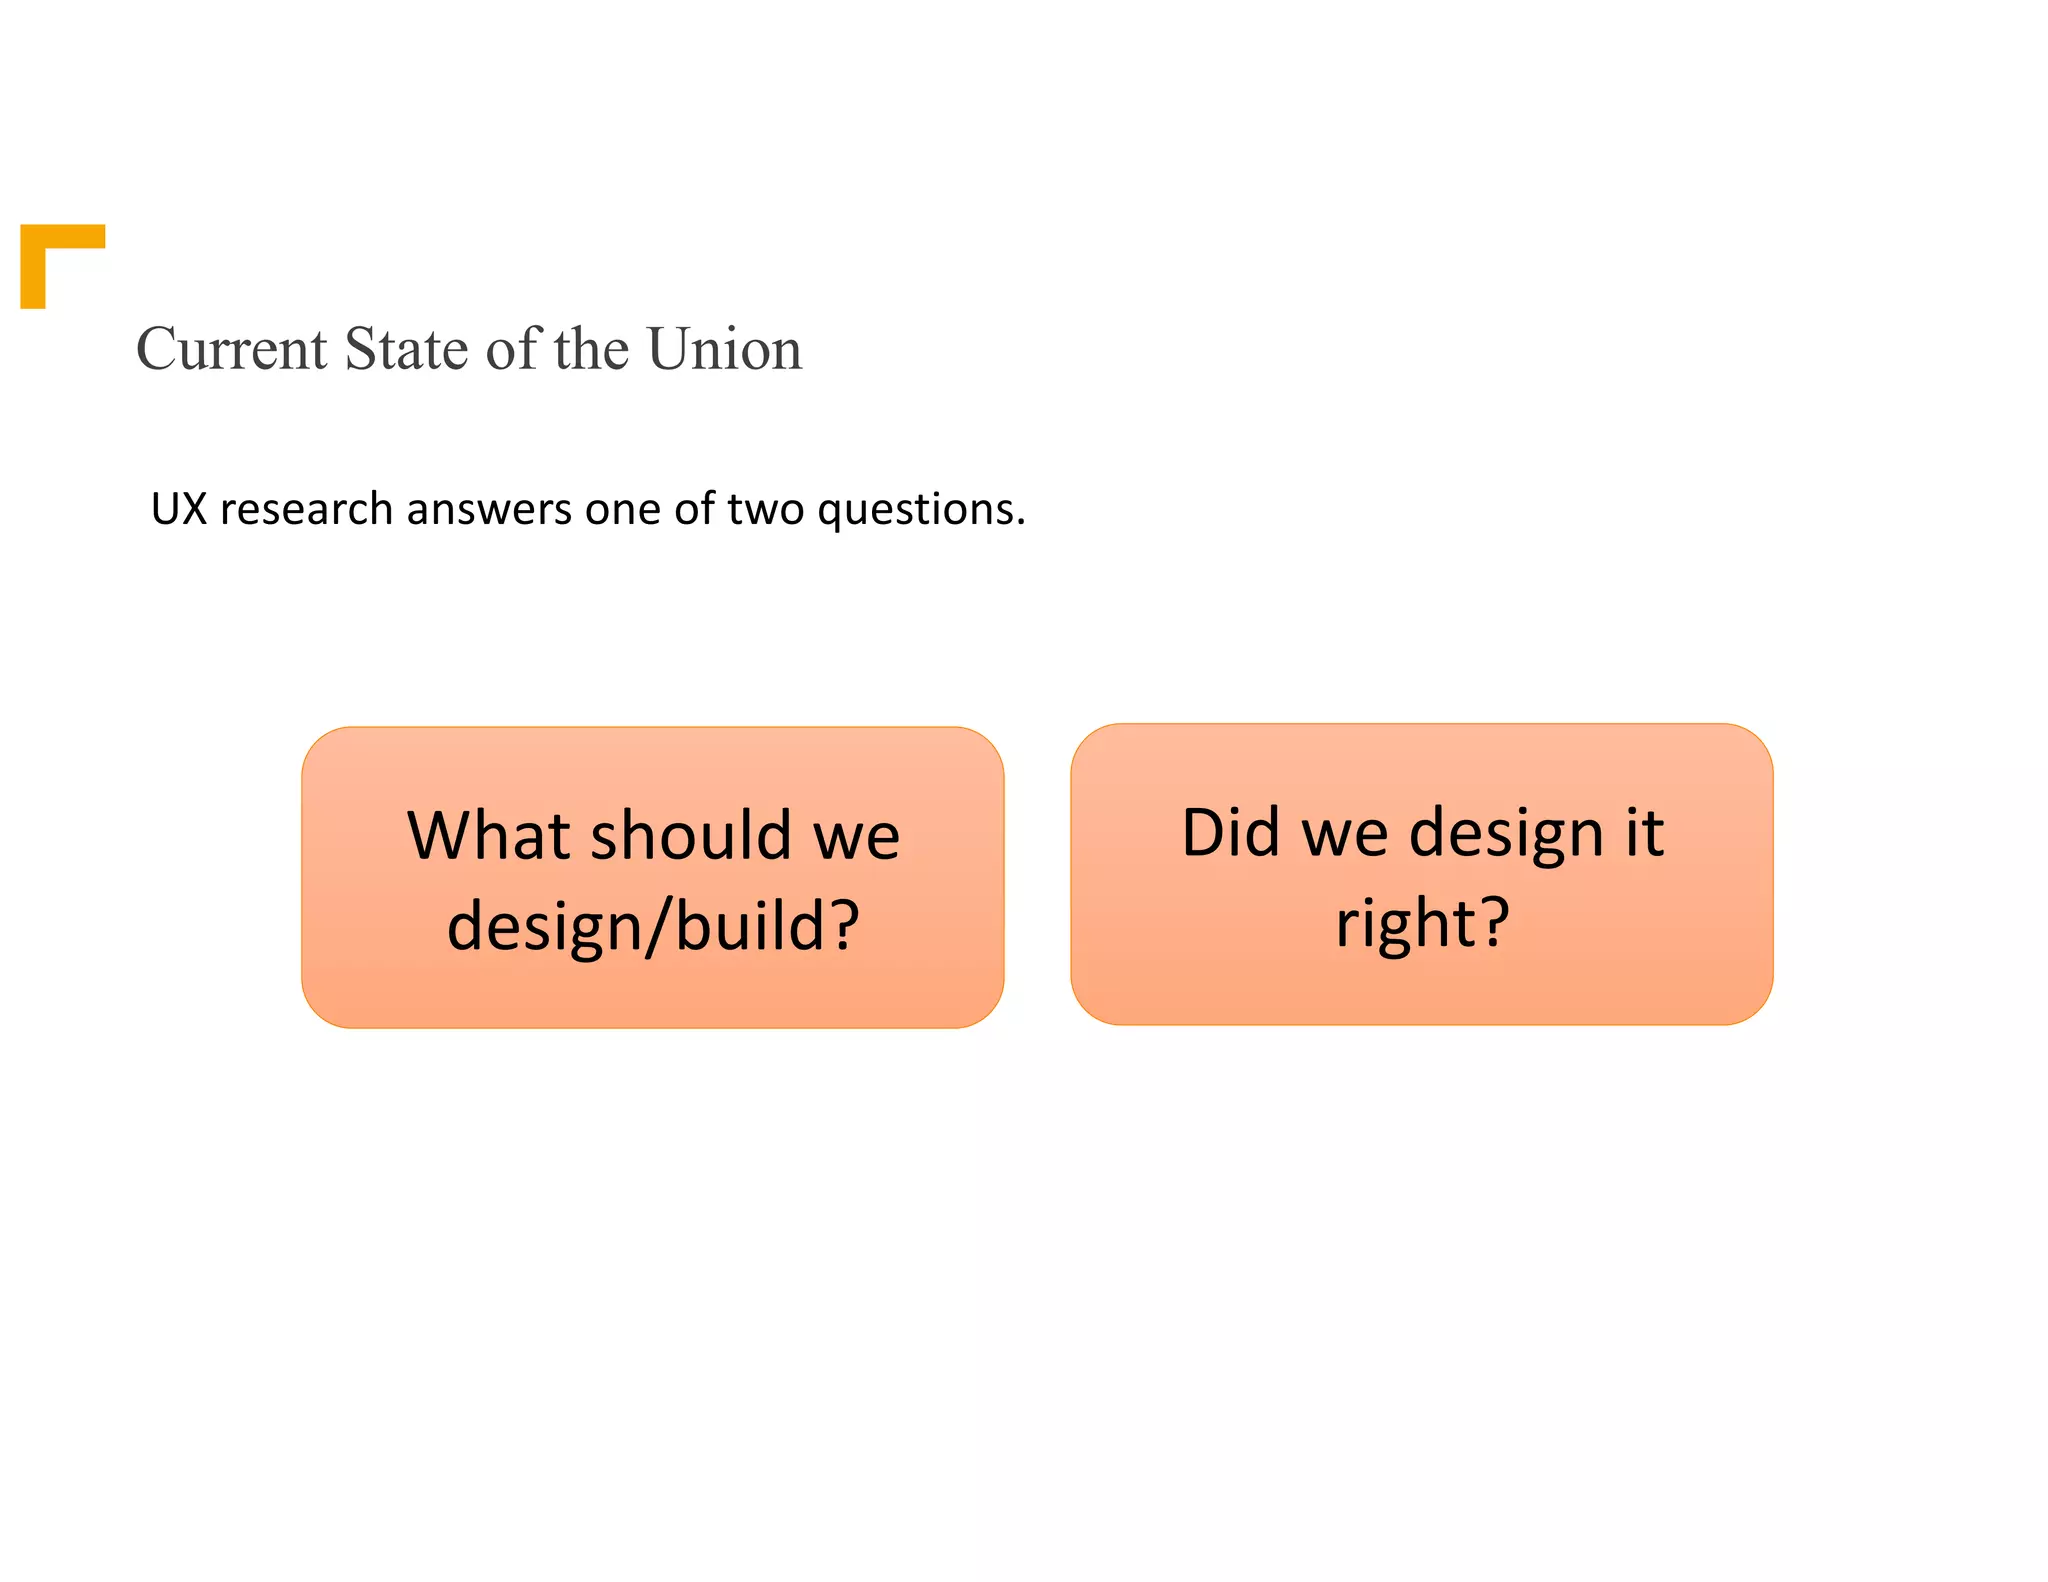

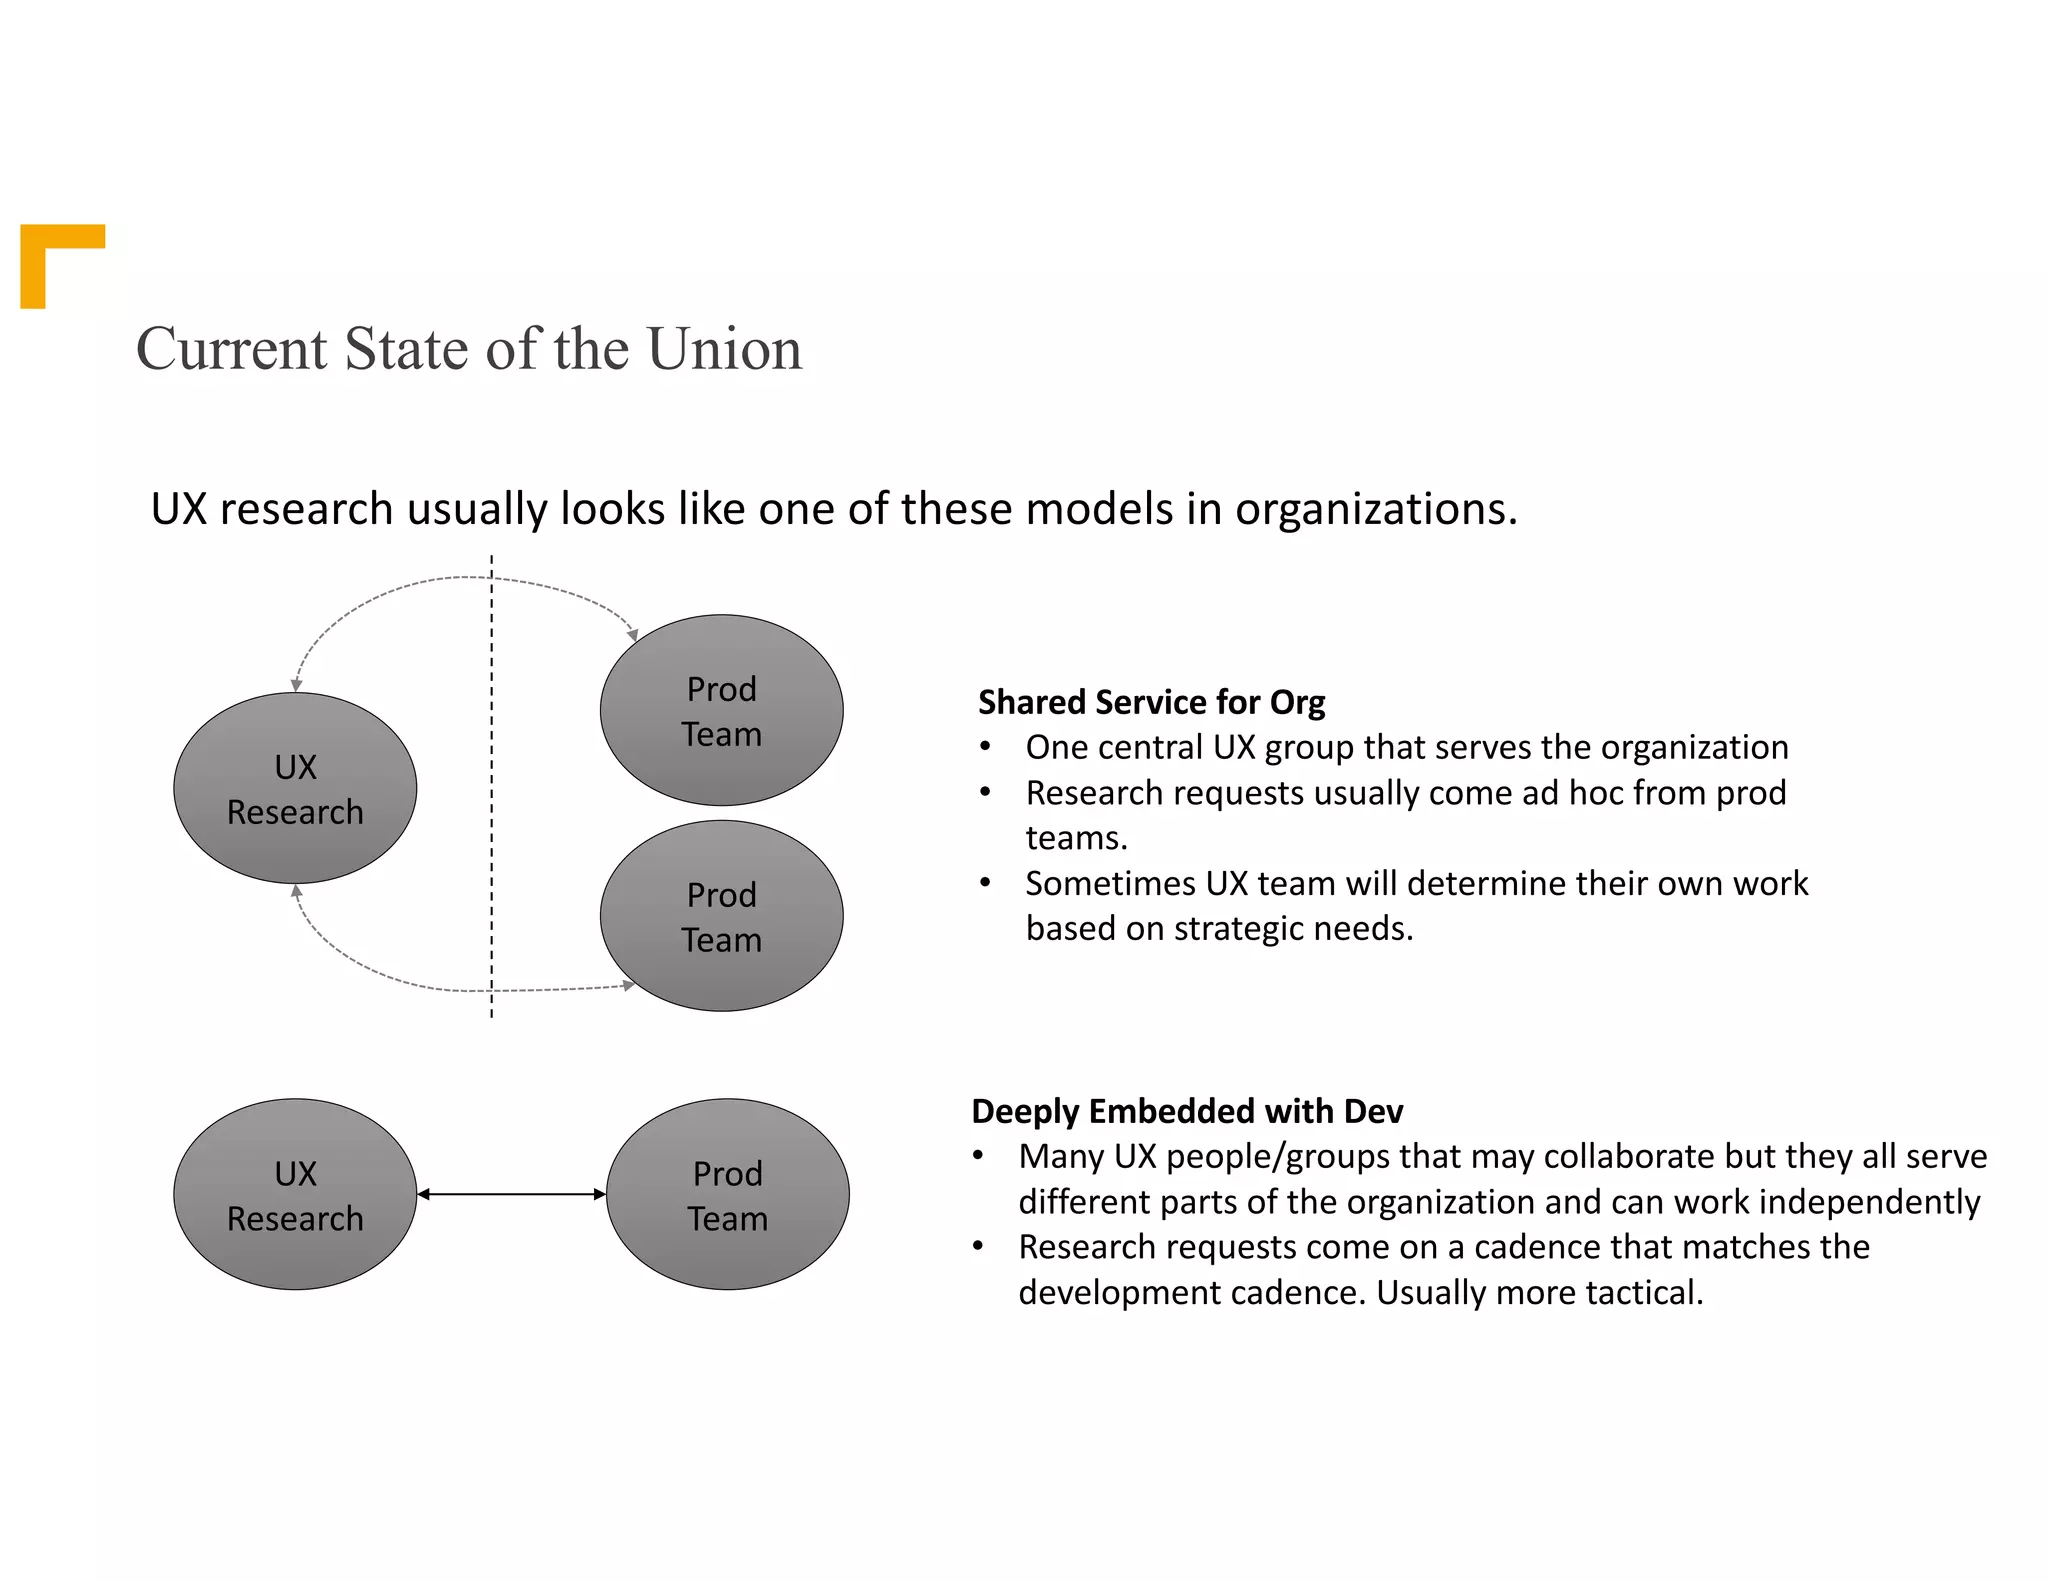

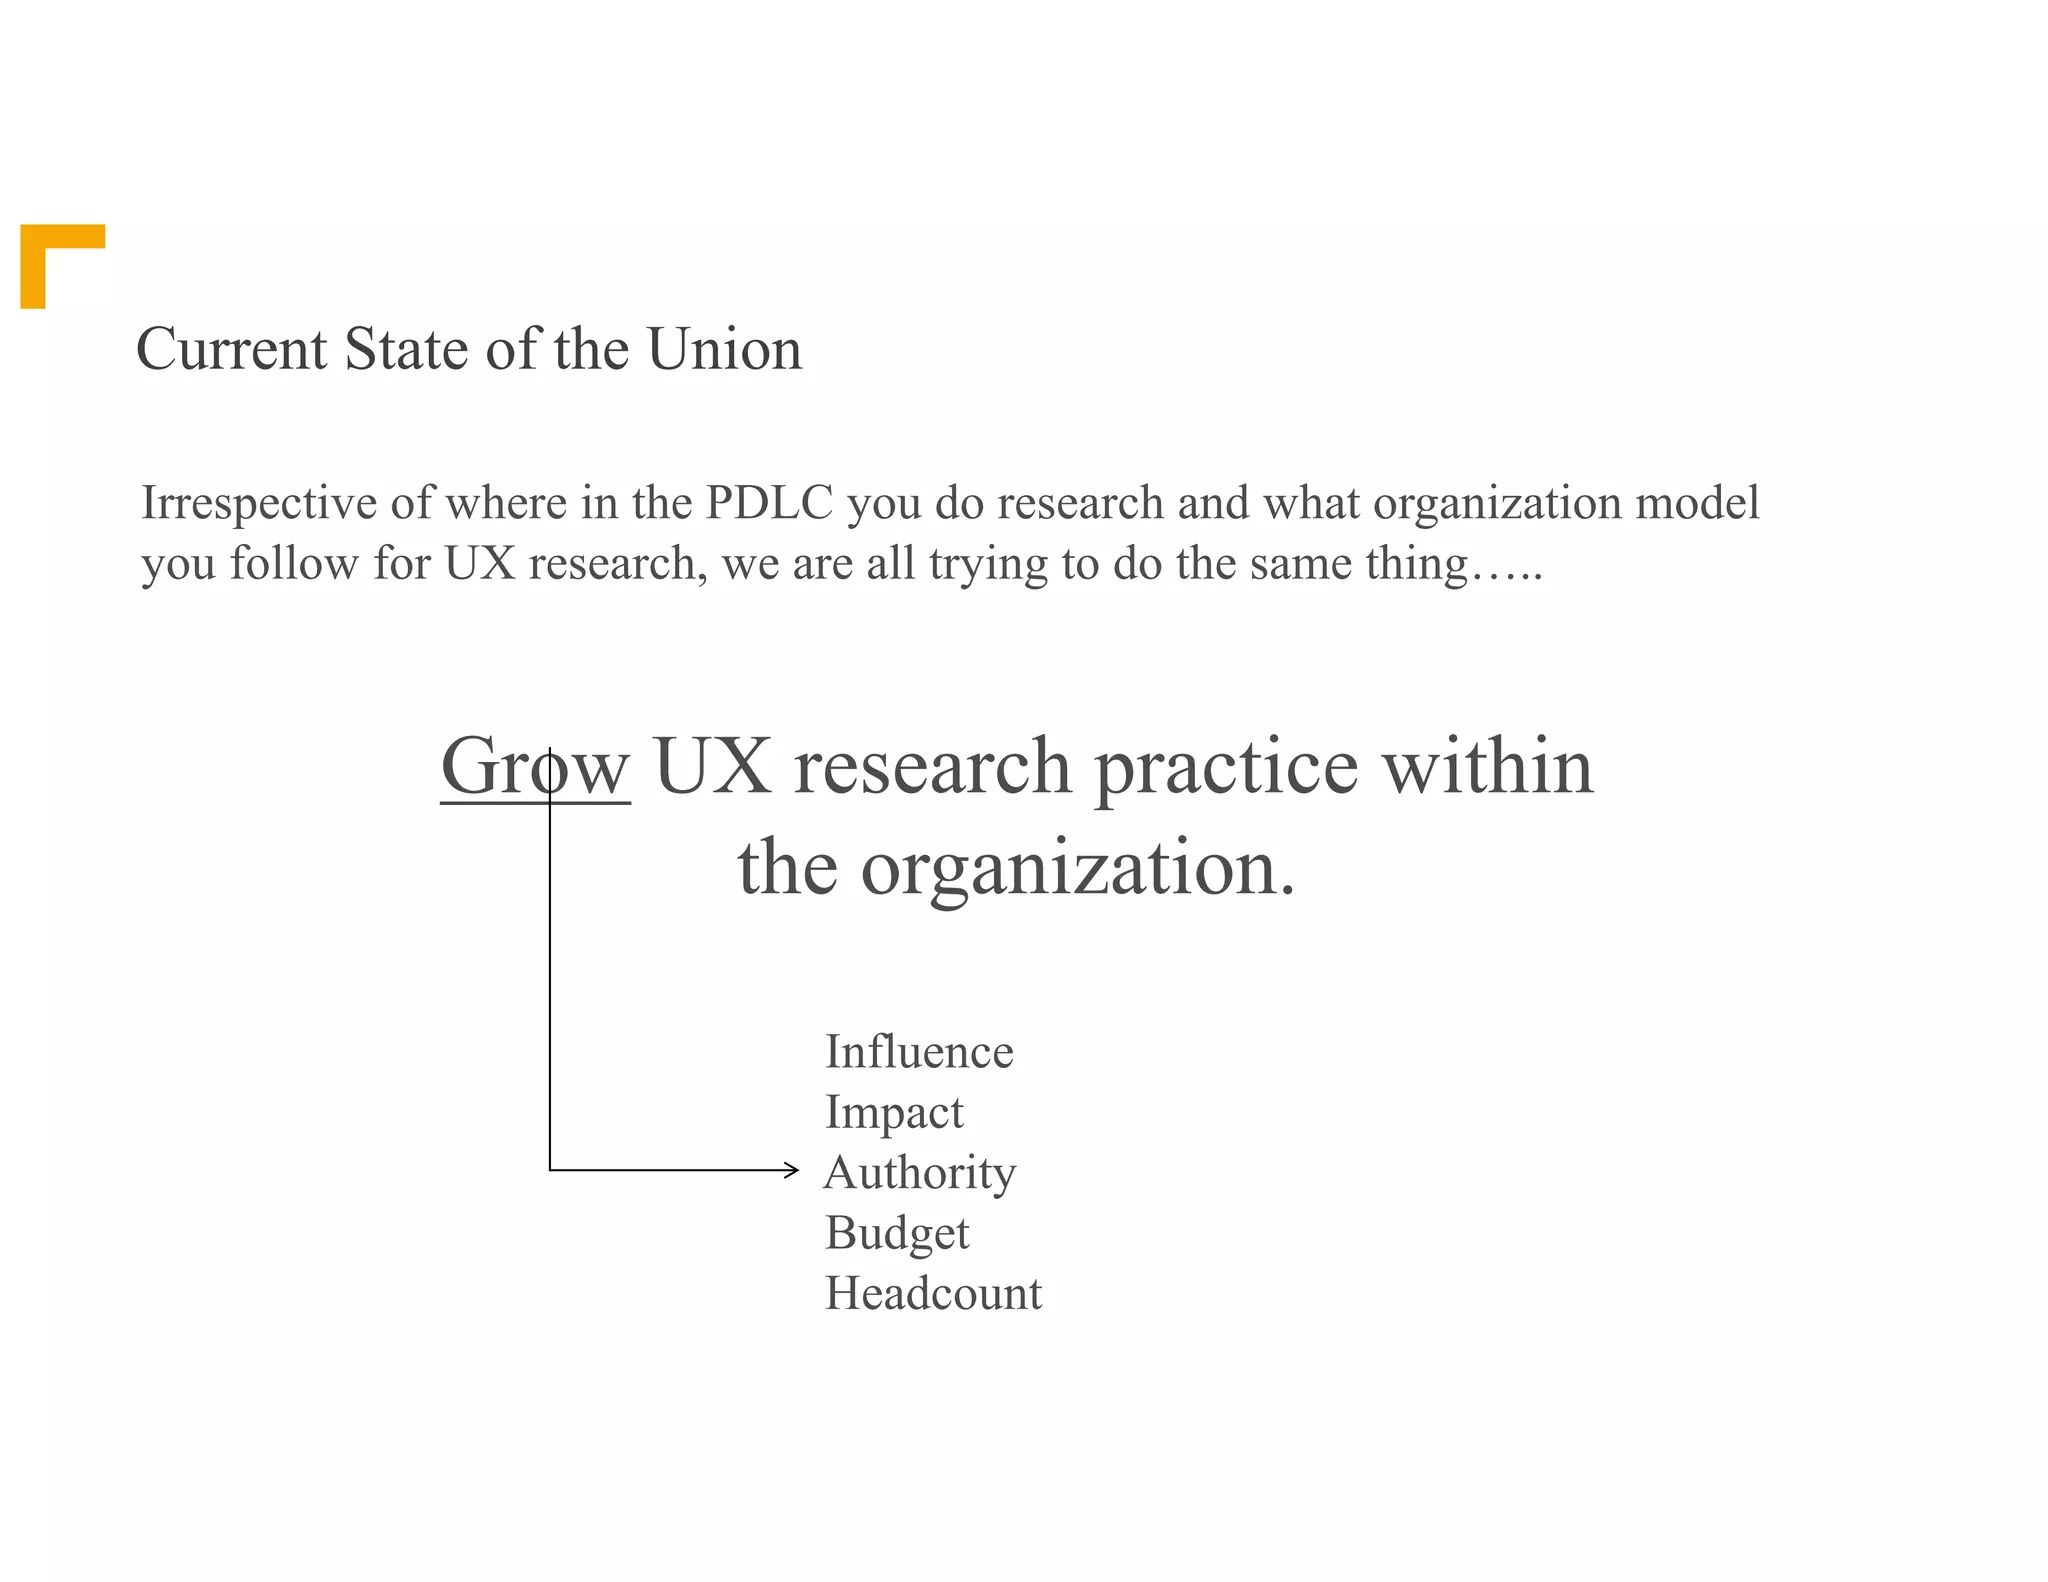


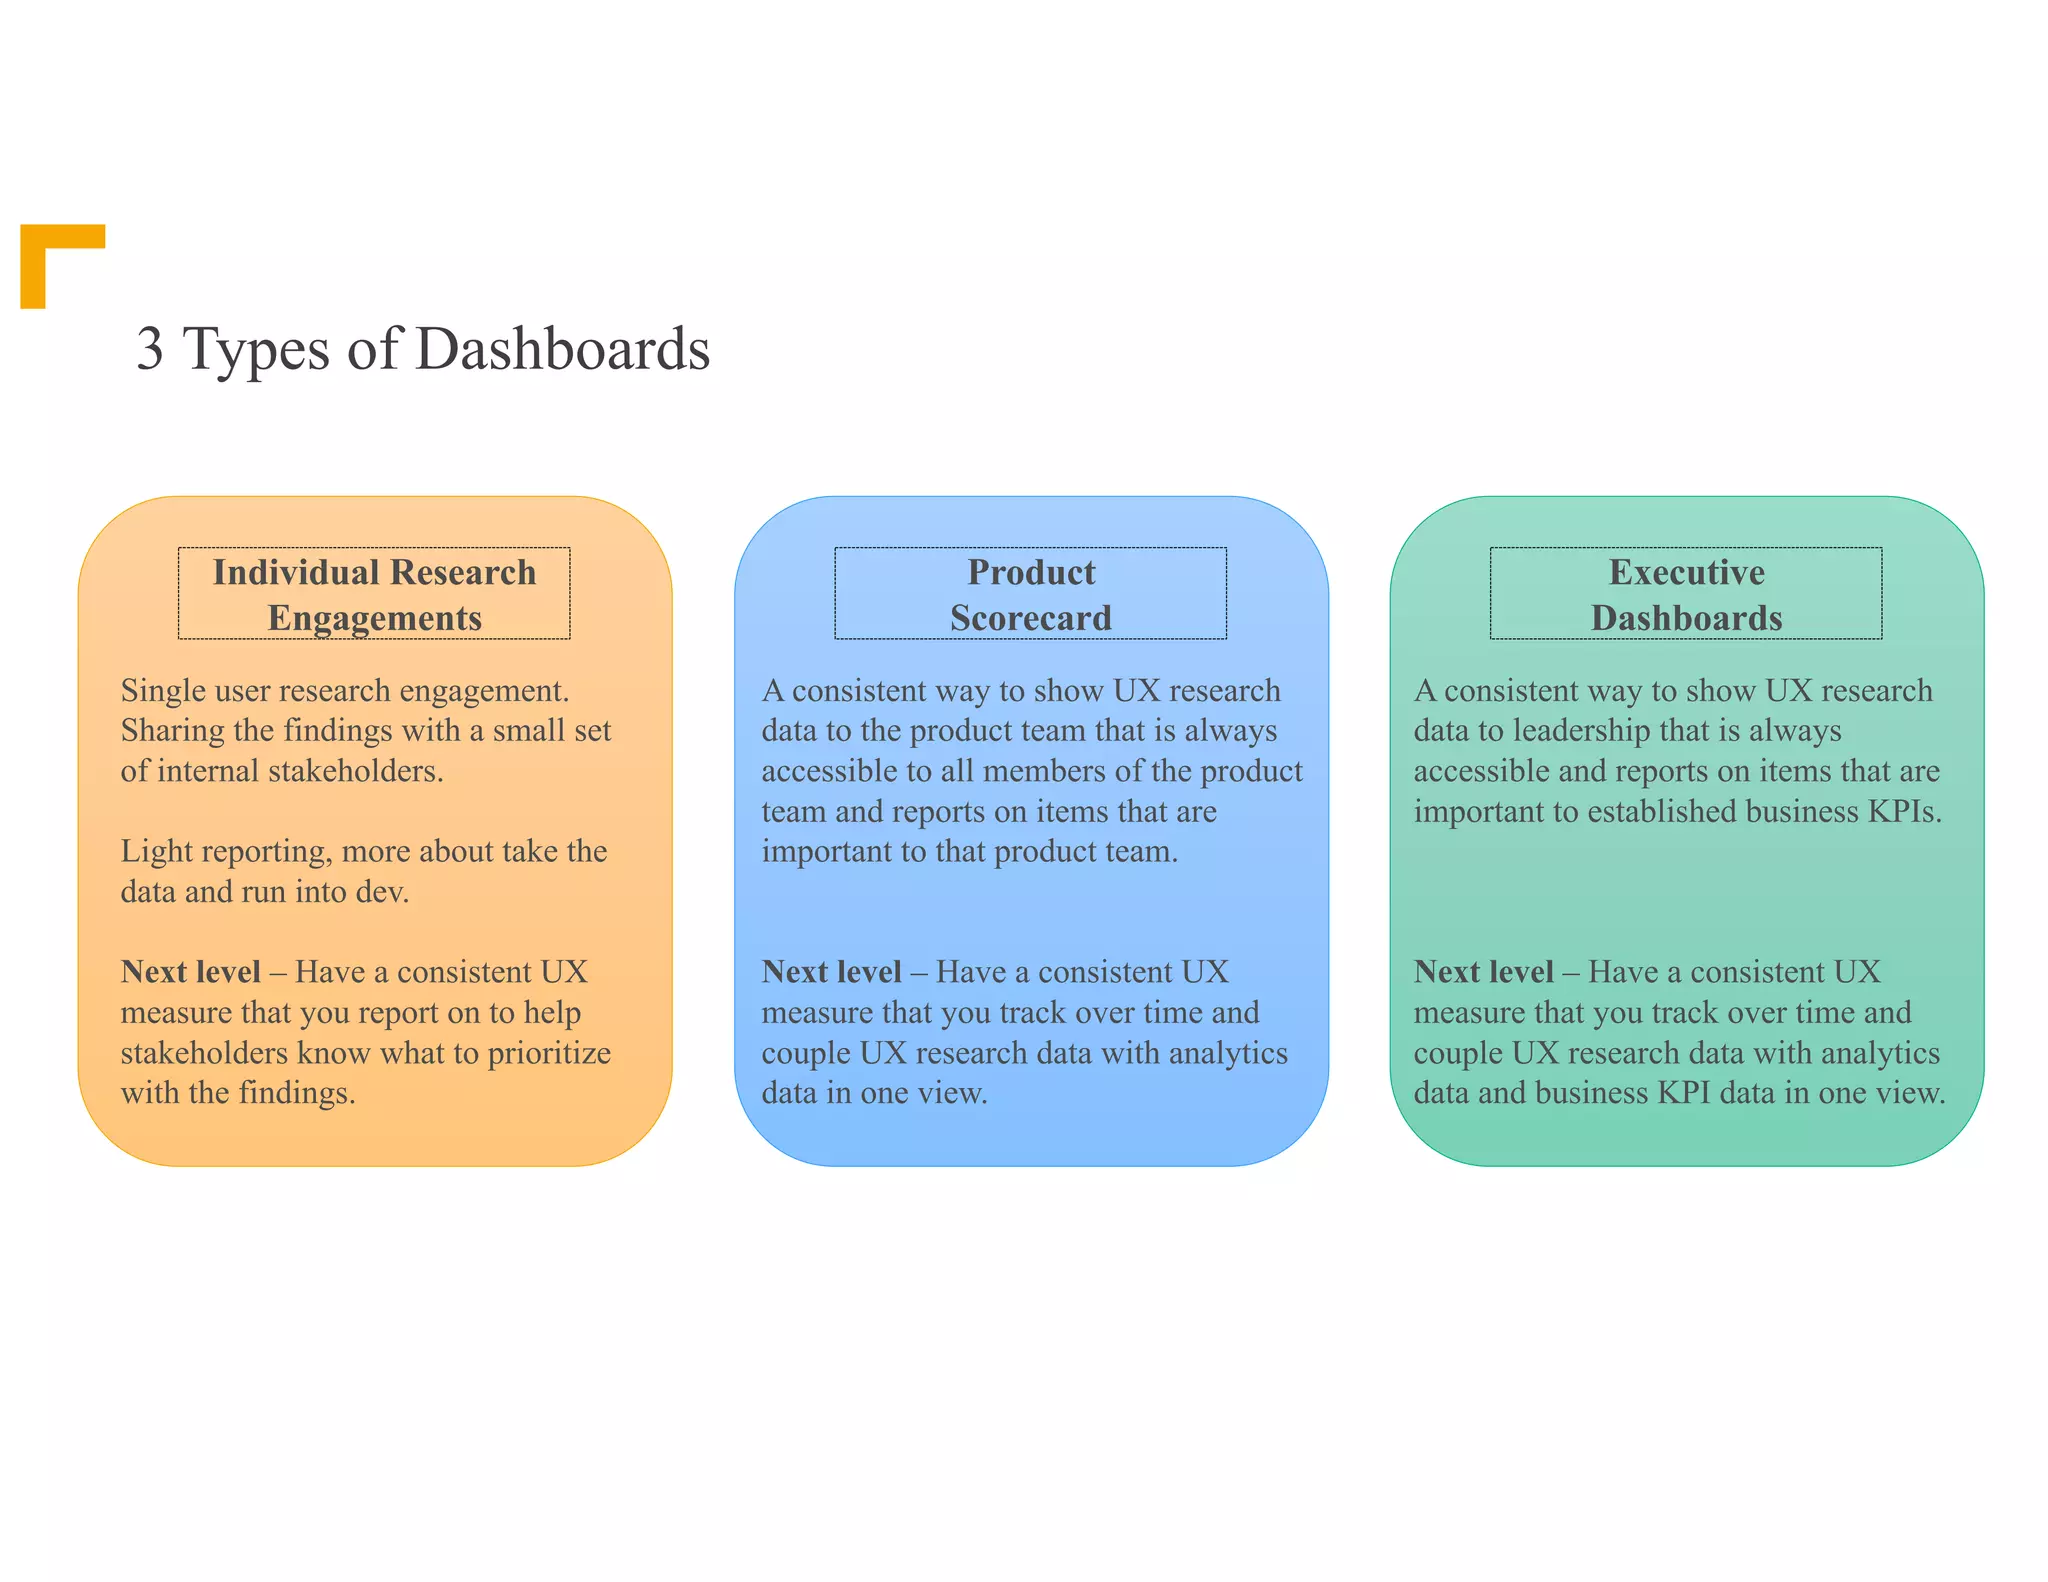


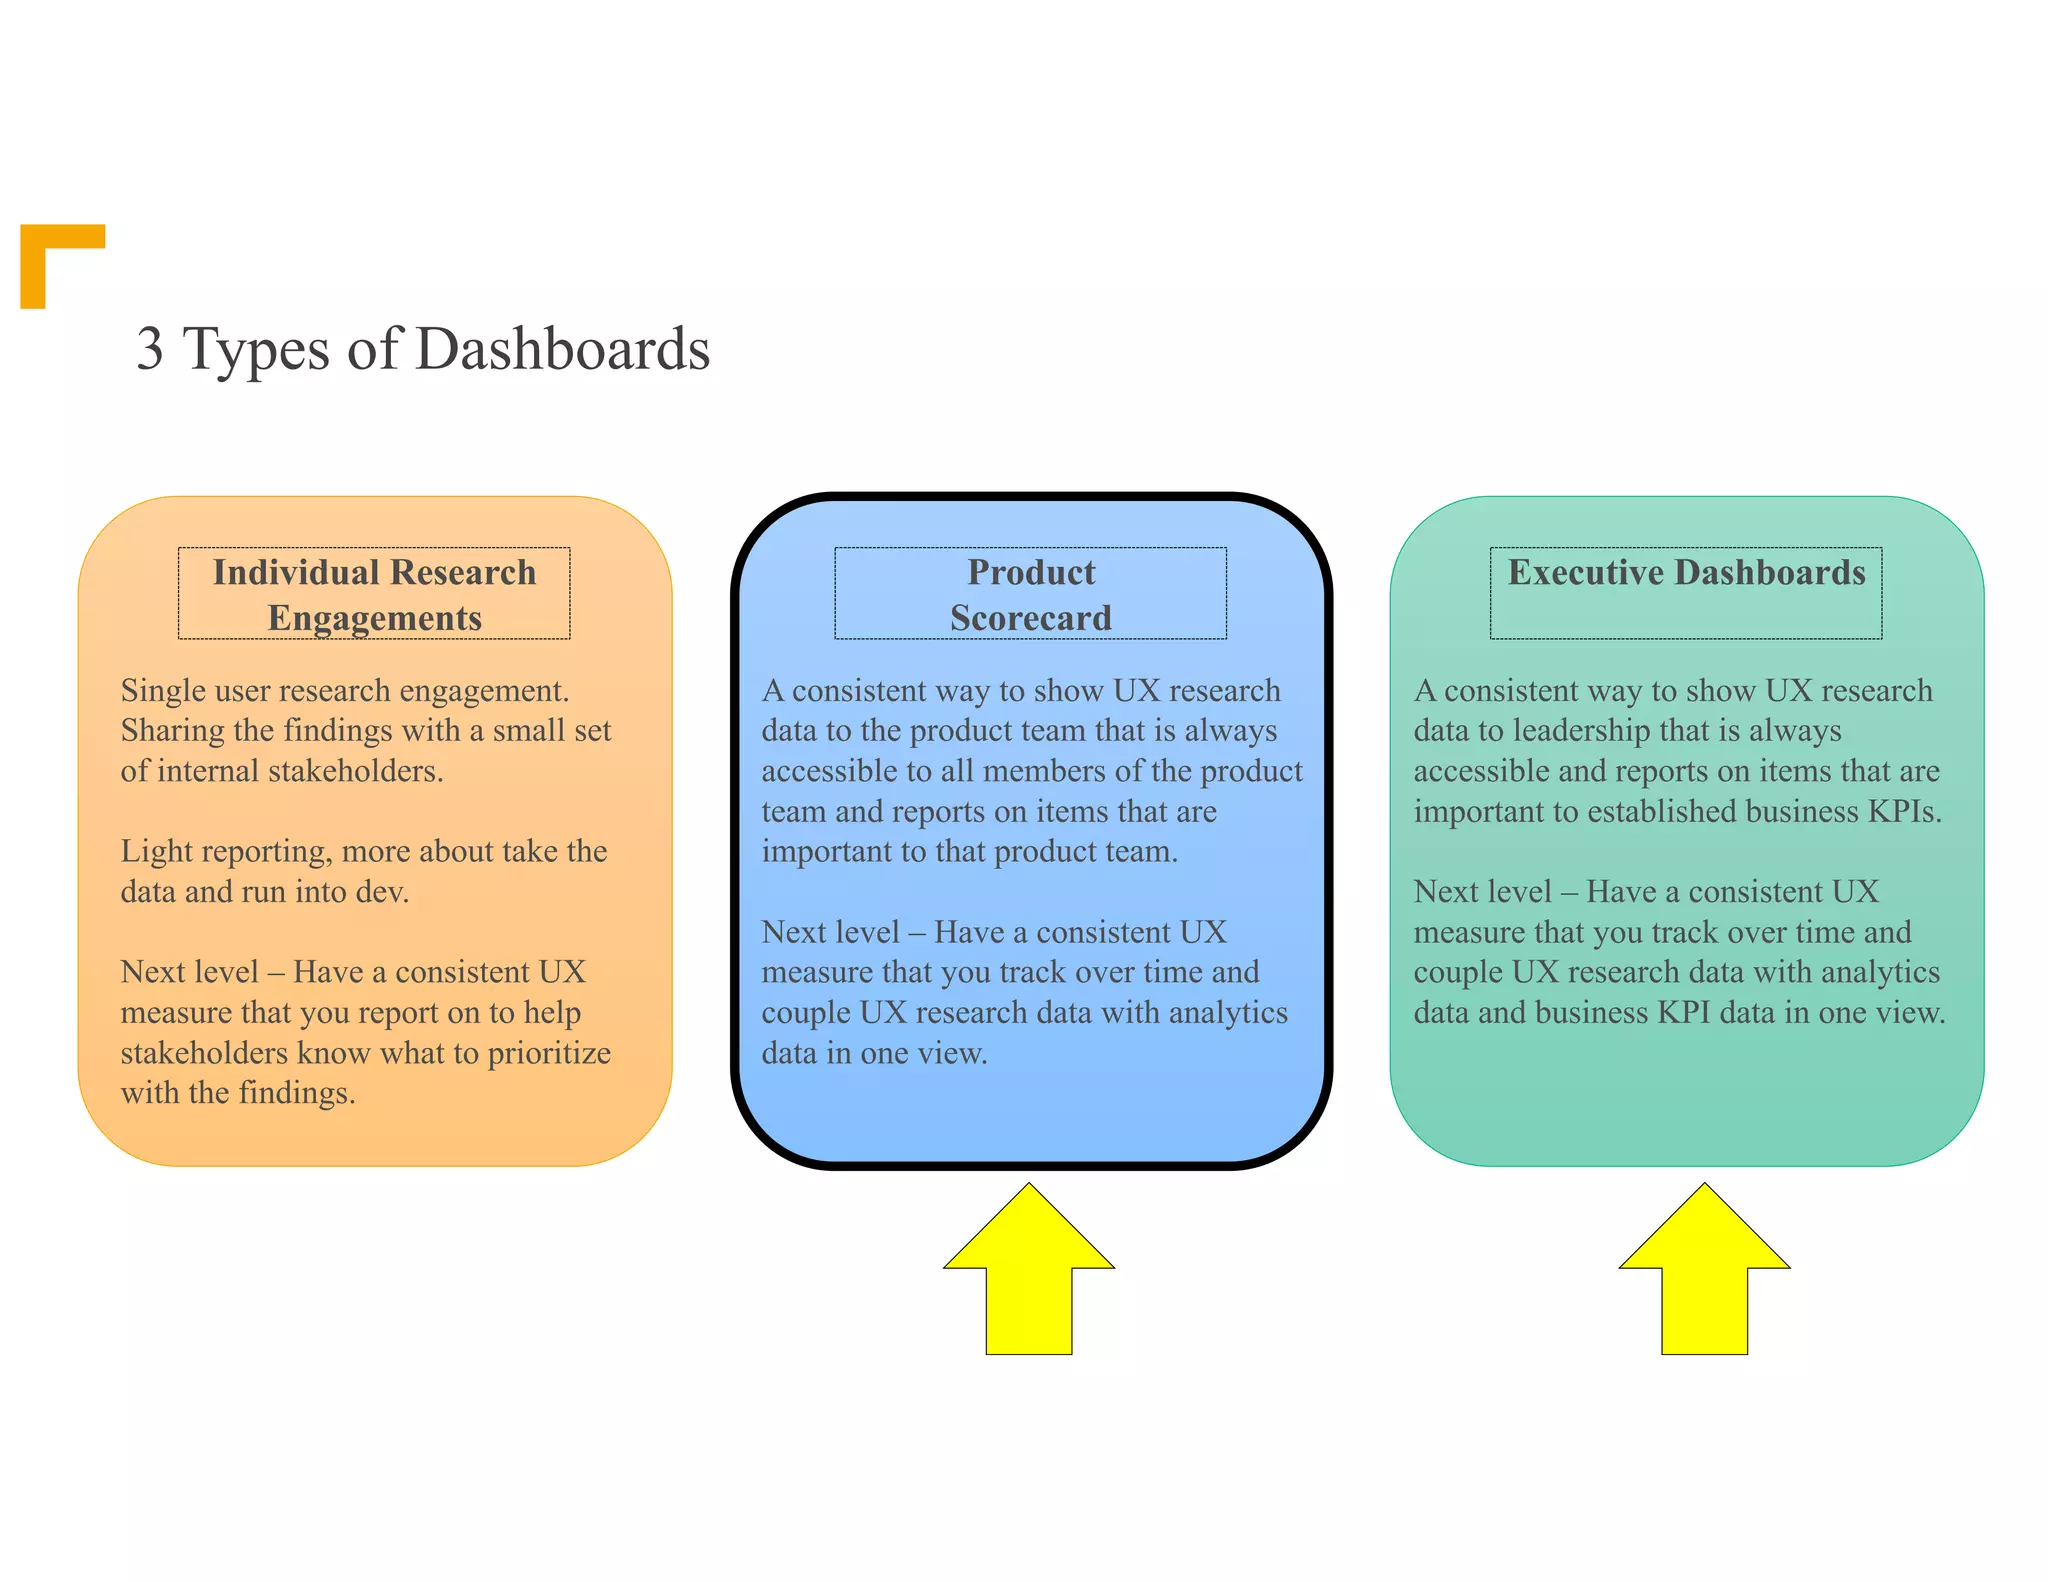


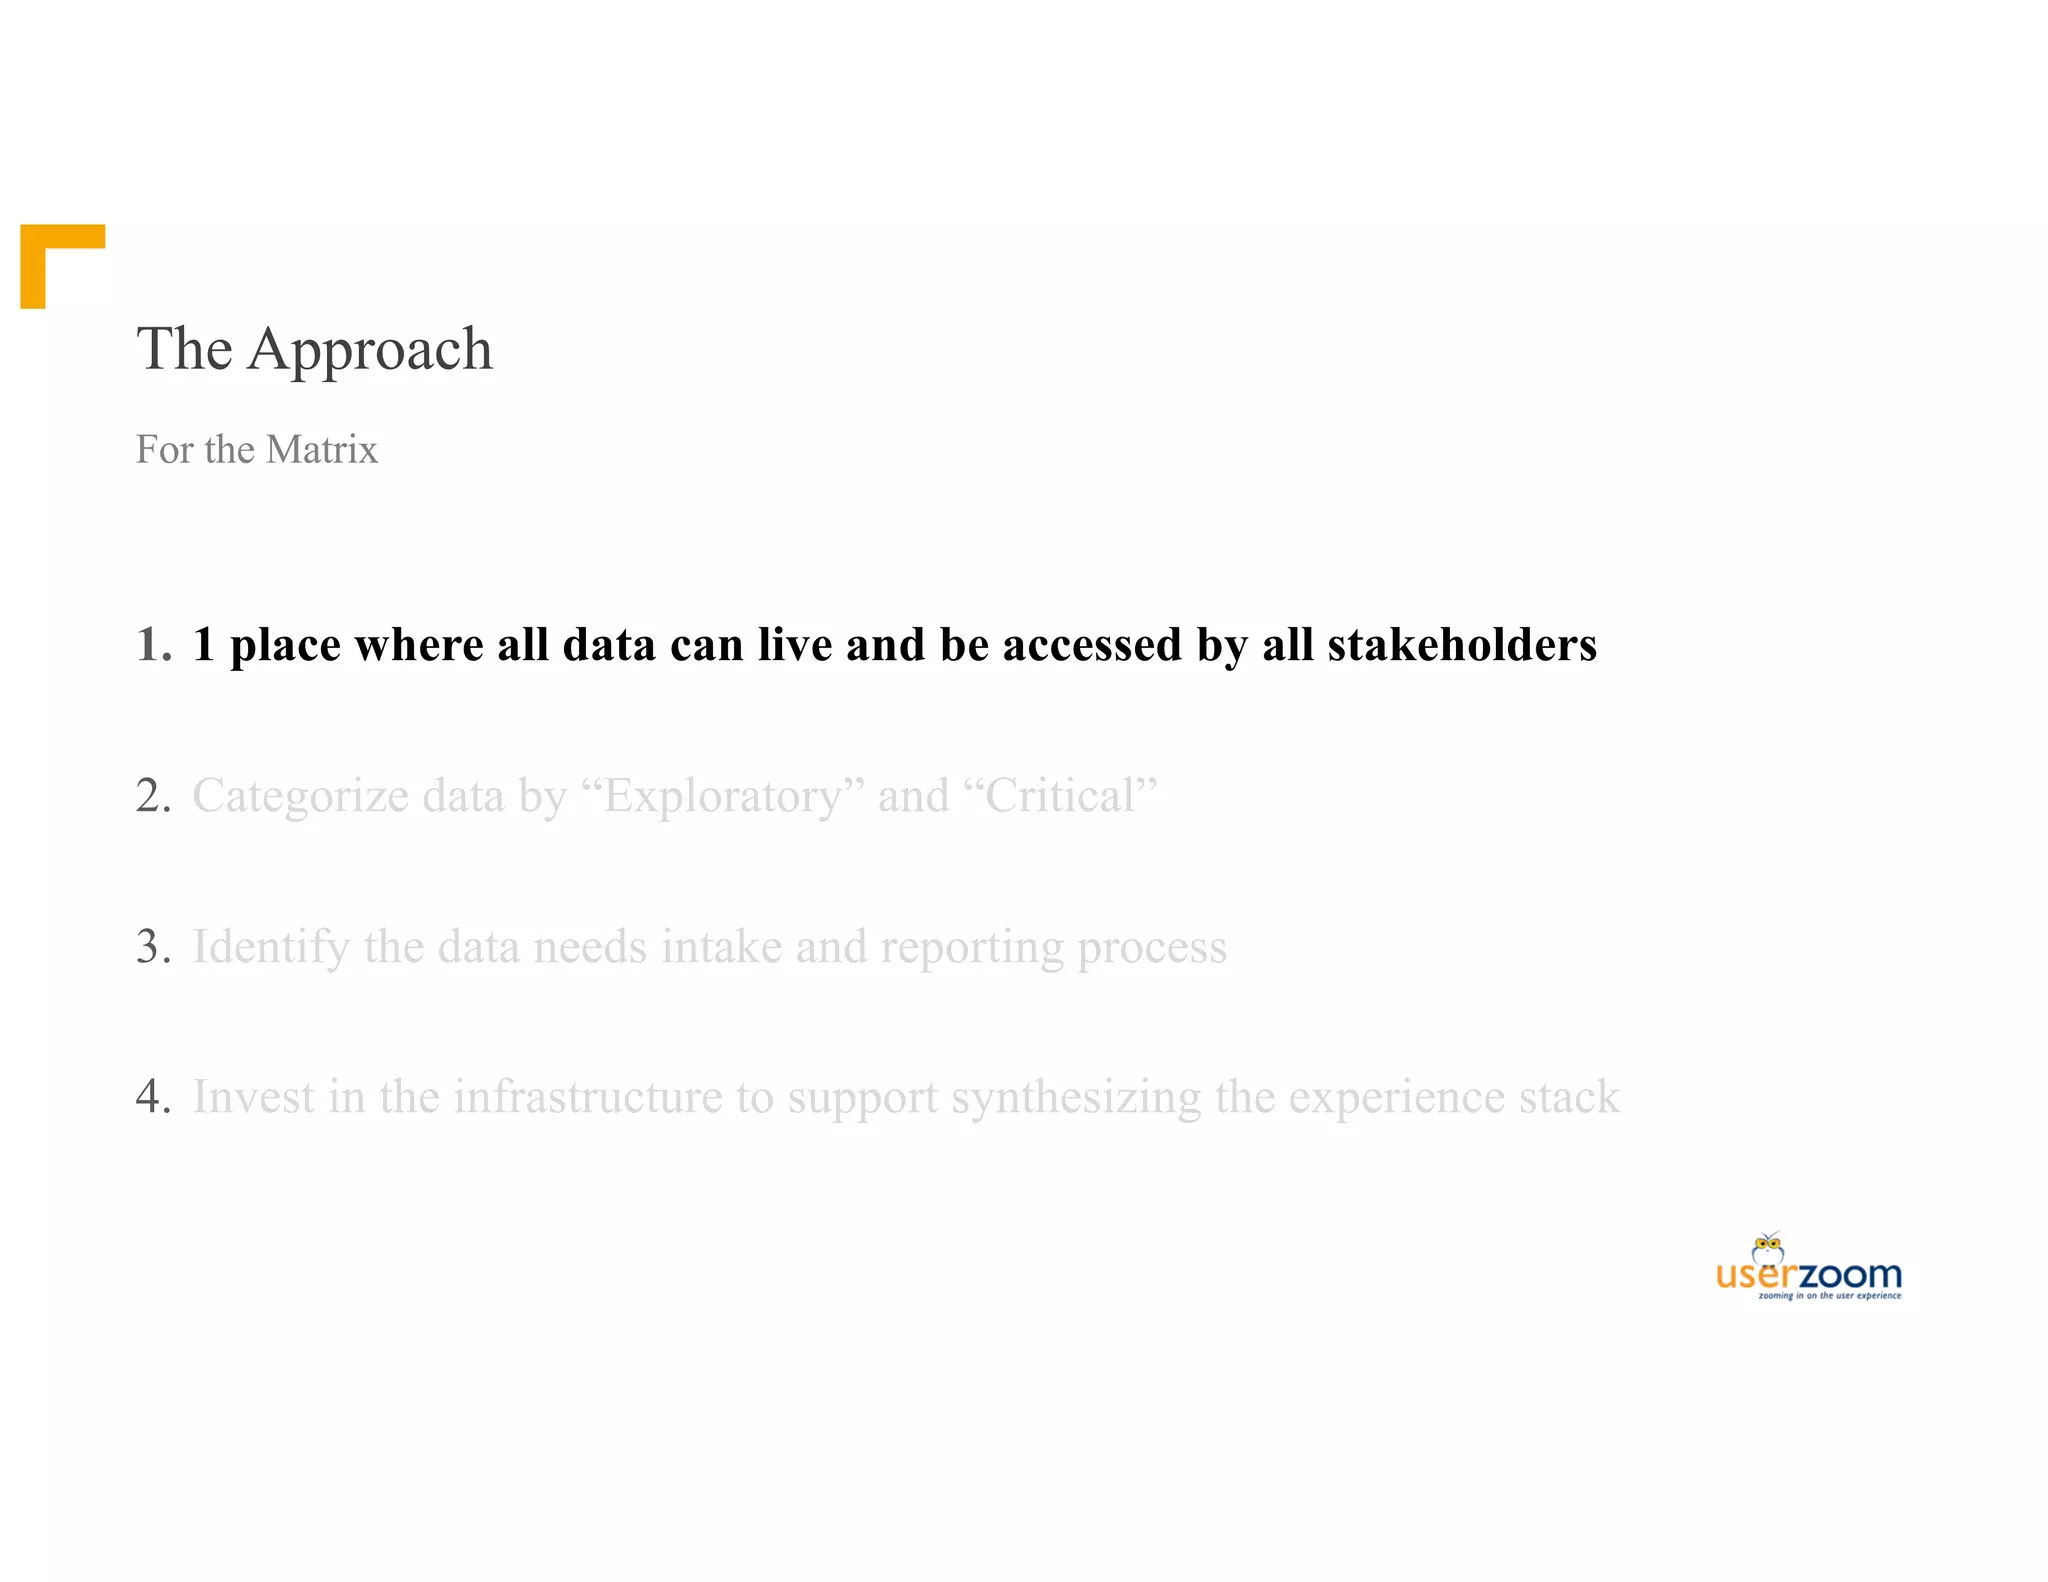


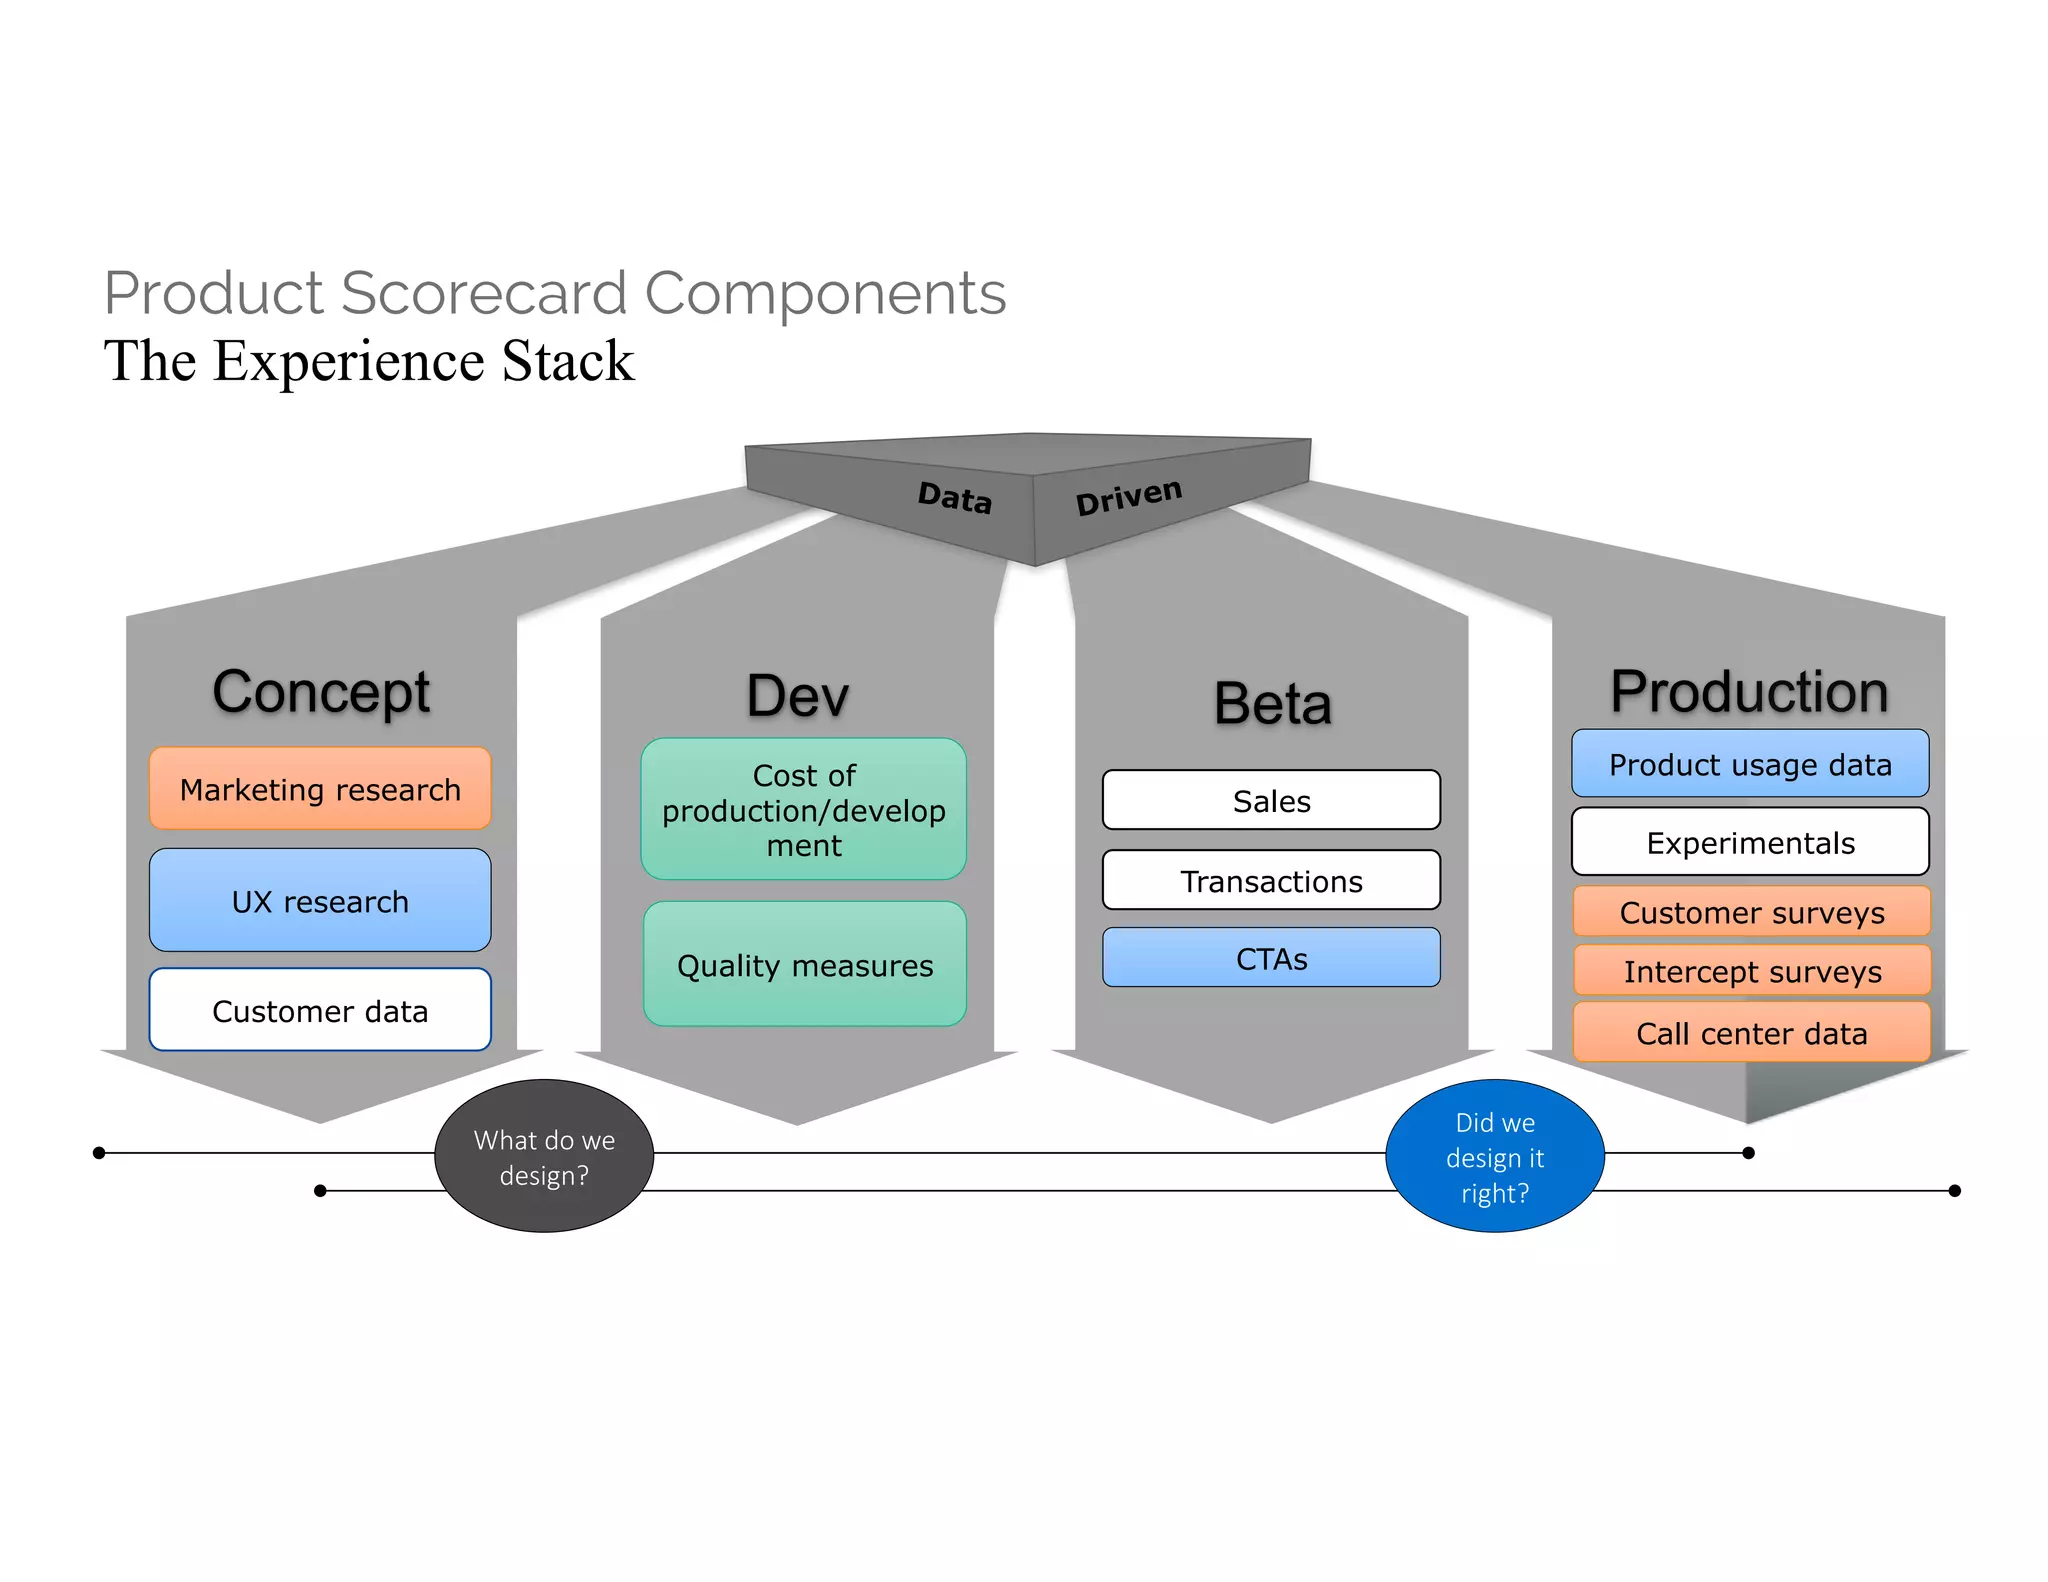


This document discusses supercharging corporate dashboards with UserZoom. It begins with polls to understand the audience. It then discusses the current state of user research, including common organizational models and goals to grow the practice. It defines three types of dashboards - individual research engagements, product scorecards, and executive dashboards. Product scorecards provide consistent reporting of UX measures to product teams. Executive dashboards do the same for leadership. The document outlines a vision for UserZoom to be a single place for all dashboard data and describes plans to provide this capability starting in 2017.


![[Product Release Highlight] Accelerate Your UX Research - Gaining Fast & Flex...](https://cdn.slidesharecdn.com/ss_thumbnails/18-180808191911-thumbnail.jpg?width=640&height=640&fit=bounds)

![[Webinar] Transitioning to Remote Research](https://cdn.slidesharecdn.com/ss_thumbnails/webinartransitioningtoremoteresearch-200501100412-thumbnail.jpg?width=640&height=640&fit=bounds)

![[19.2 UserZoom Spring Release Webinar] Get Card Sort Insights with Confidence](https://cdn.slidesharecdn.com/ss_thumbnails/19-190509203842-thumbnail.jpg?width=640&height=640&fit=bounds)


![[Product Release Highlight] Seamlessly Discover and Share Your User Experienc...](https://cdn.slidesharecdn.com/ss_thumbnails/seamlesslydiscoverandshareyouruserexperiencestory-181101164620-thumbnail.jpg?width=640&height=640&fit=bounds)


![[UserZoom Webinar] The Online Shopping Experience: Benchmarking Four Ecommerc...](https://cdn.slidesharecdn.com/ss_thumbnails/webinarecommerceretailbenchmarking7-24-18final-180724180818-thumbnail.jpg?width=640&height=640&fit=bounds)


