Download as PDF, PPTX


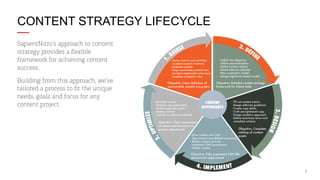


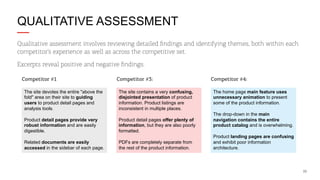
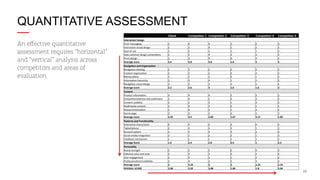

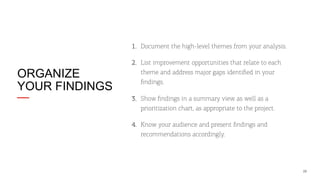
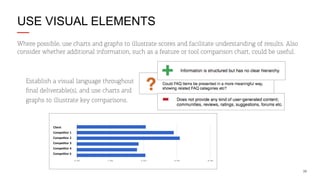
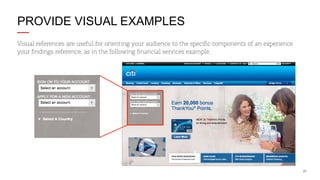
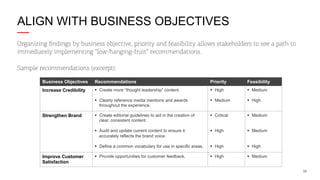
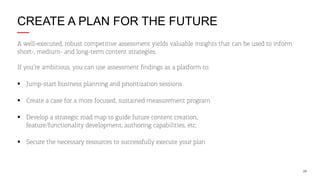


The document outlines a structured approach to competitive assessment for content strategy, emphasizing the importance of understanding market position and identifying gaps. It provides a step-by-step guide including setting up the assessment, gathering data, analyzing results, and creating actionable recommendations. The insights gained are aimed at informing content strategies that align with business objectives and enhance user experience.


![[AIIM16] Don’t Talk to Me about Content Management](https://cdn.slidesharecdn.com/ss_thumbnails/donttalktomeaboutcontentmanagement-160502152951-thumbnail.jpg?width=640&height=640&fit=bounds)


![Marketing Plan [gtm] demo version 2020](https://cdn.slidesharecdn.com/ss_thumbnails/marketinggtm-demoversion2020-200703120249-thumbnail.jpg?width=640&height=640&fit=bounds)


