Download as PDF, PPTX
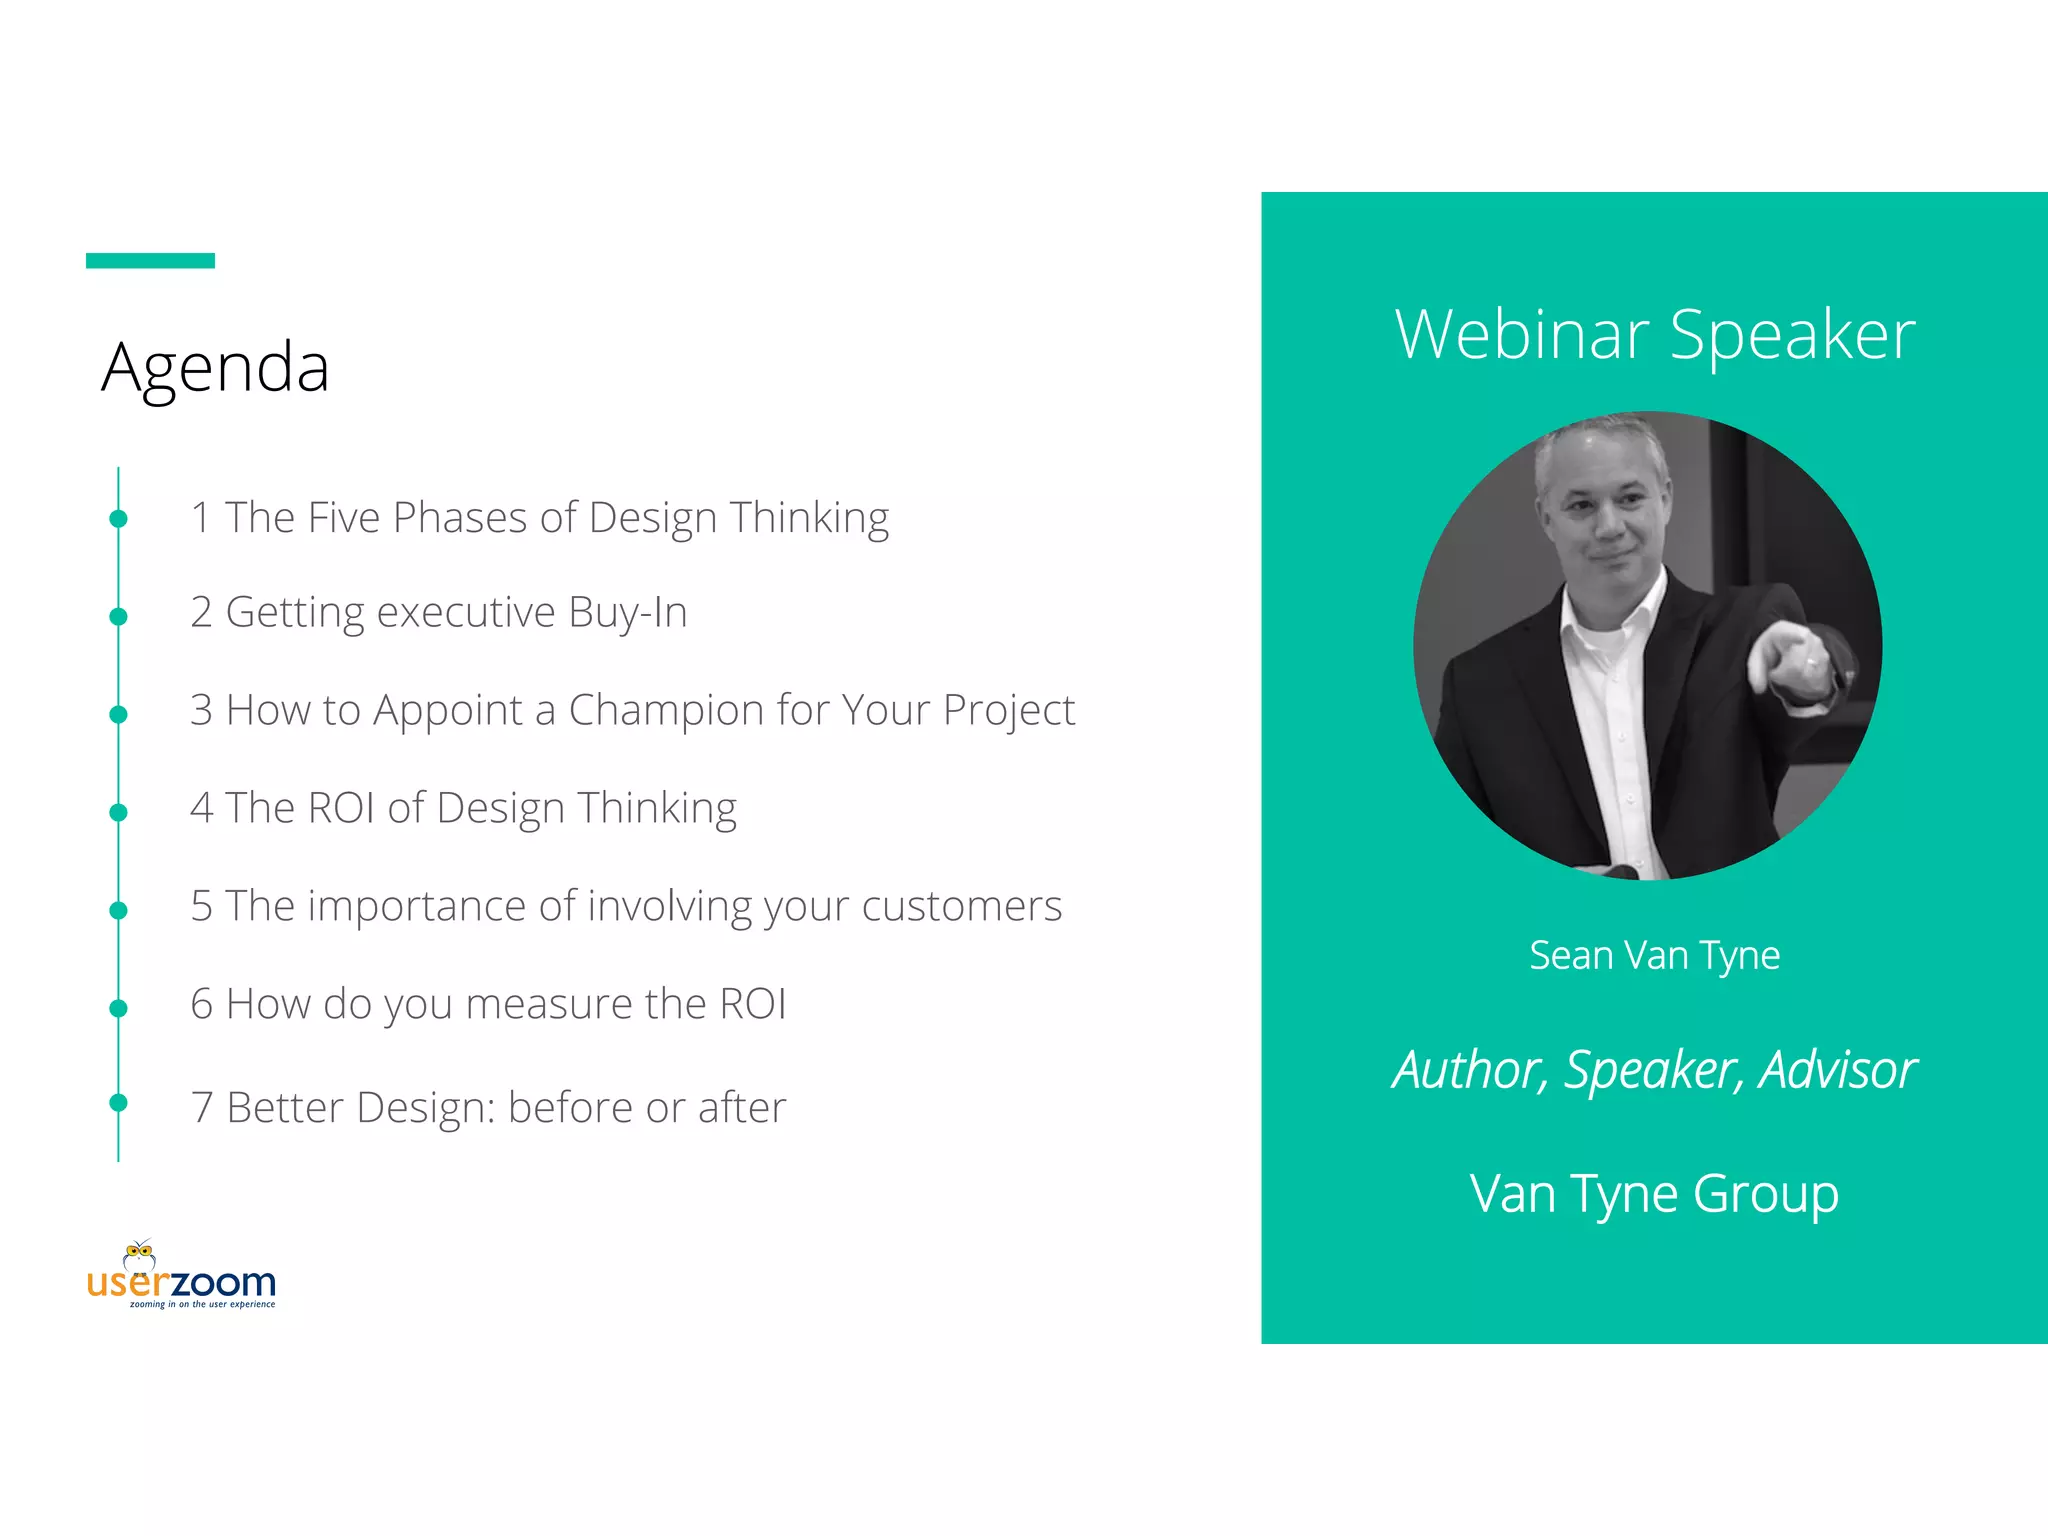
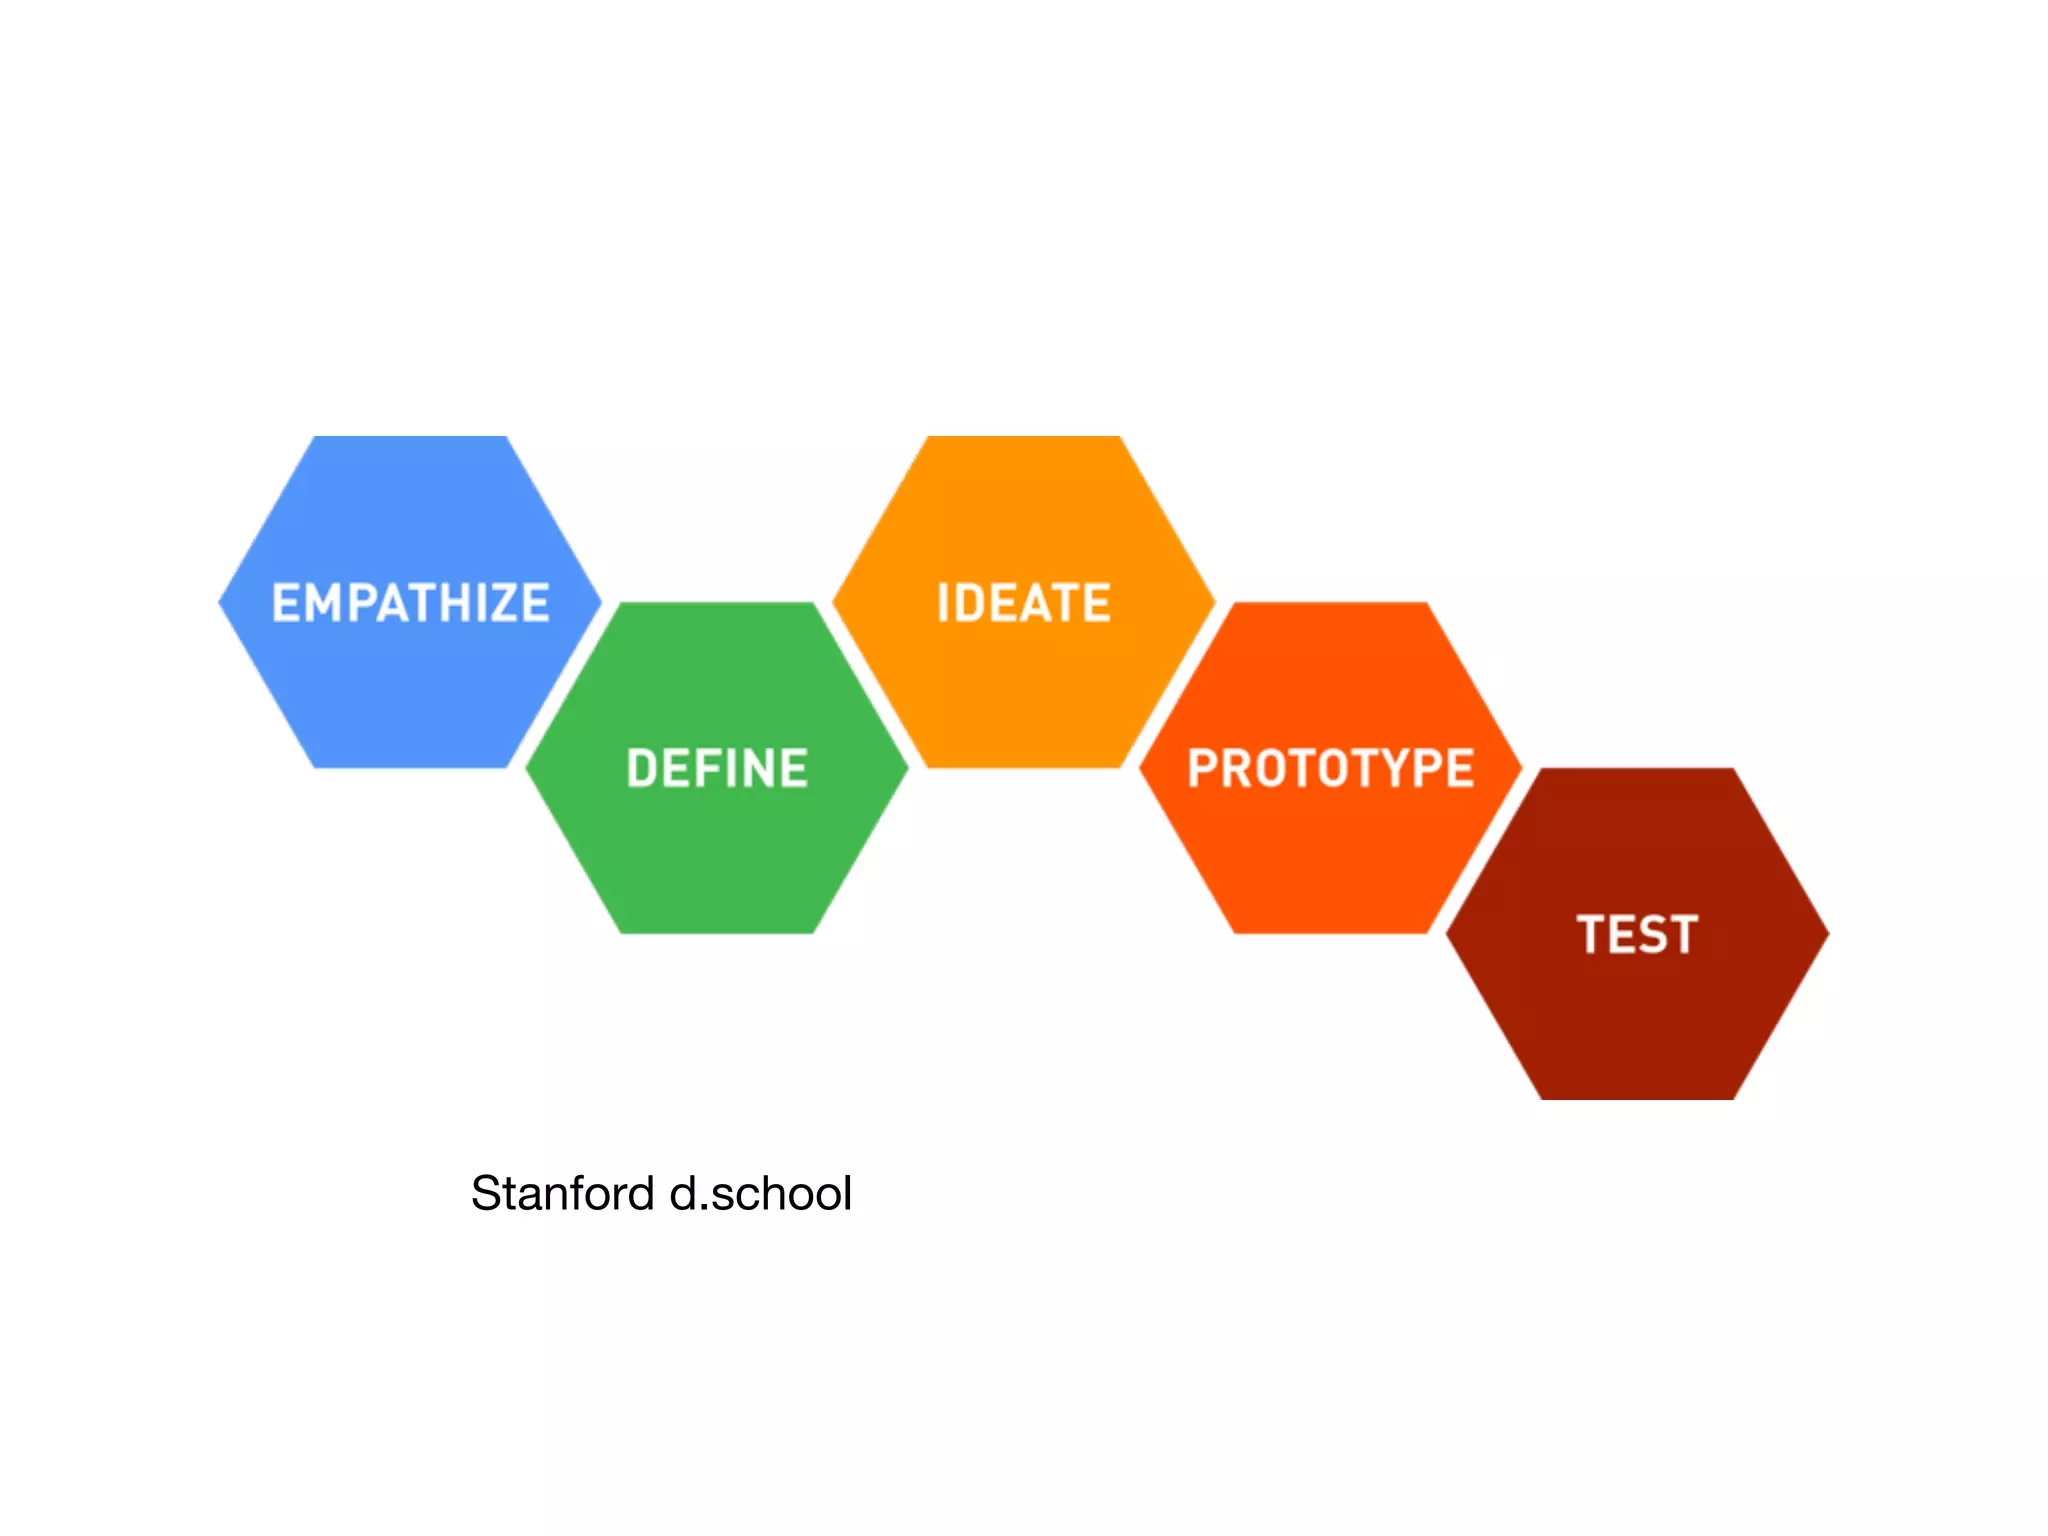
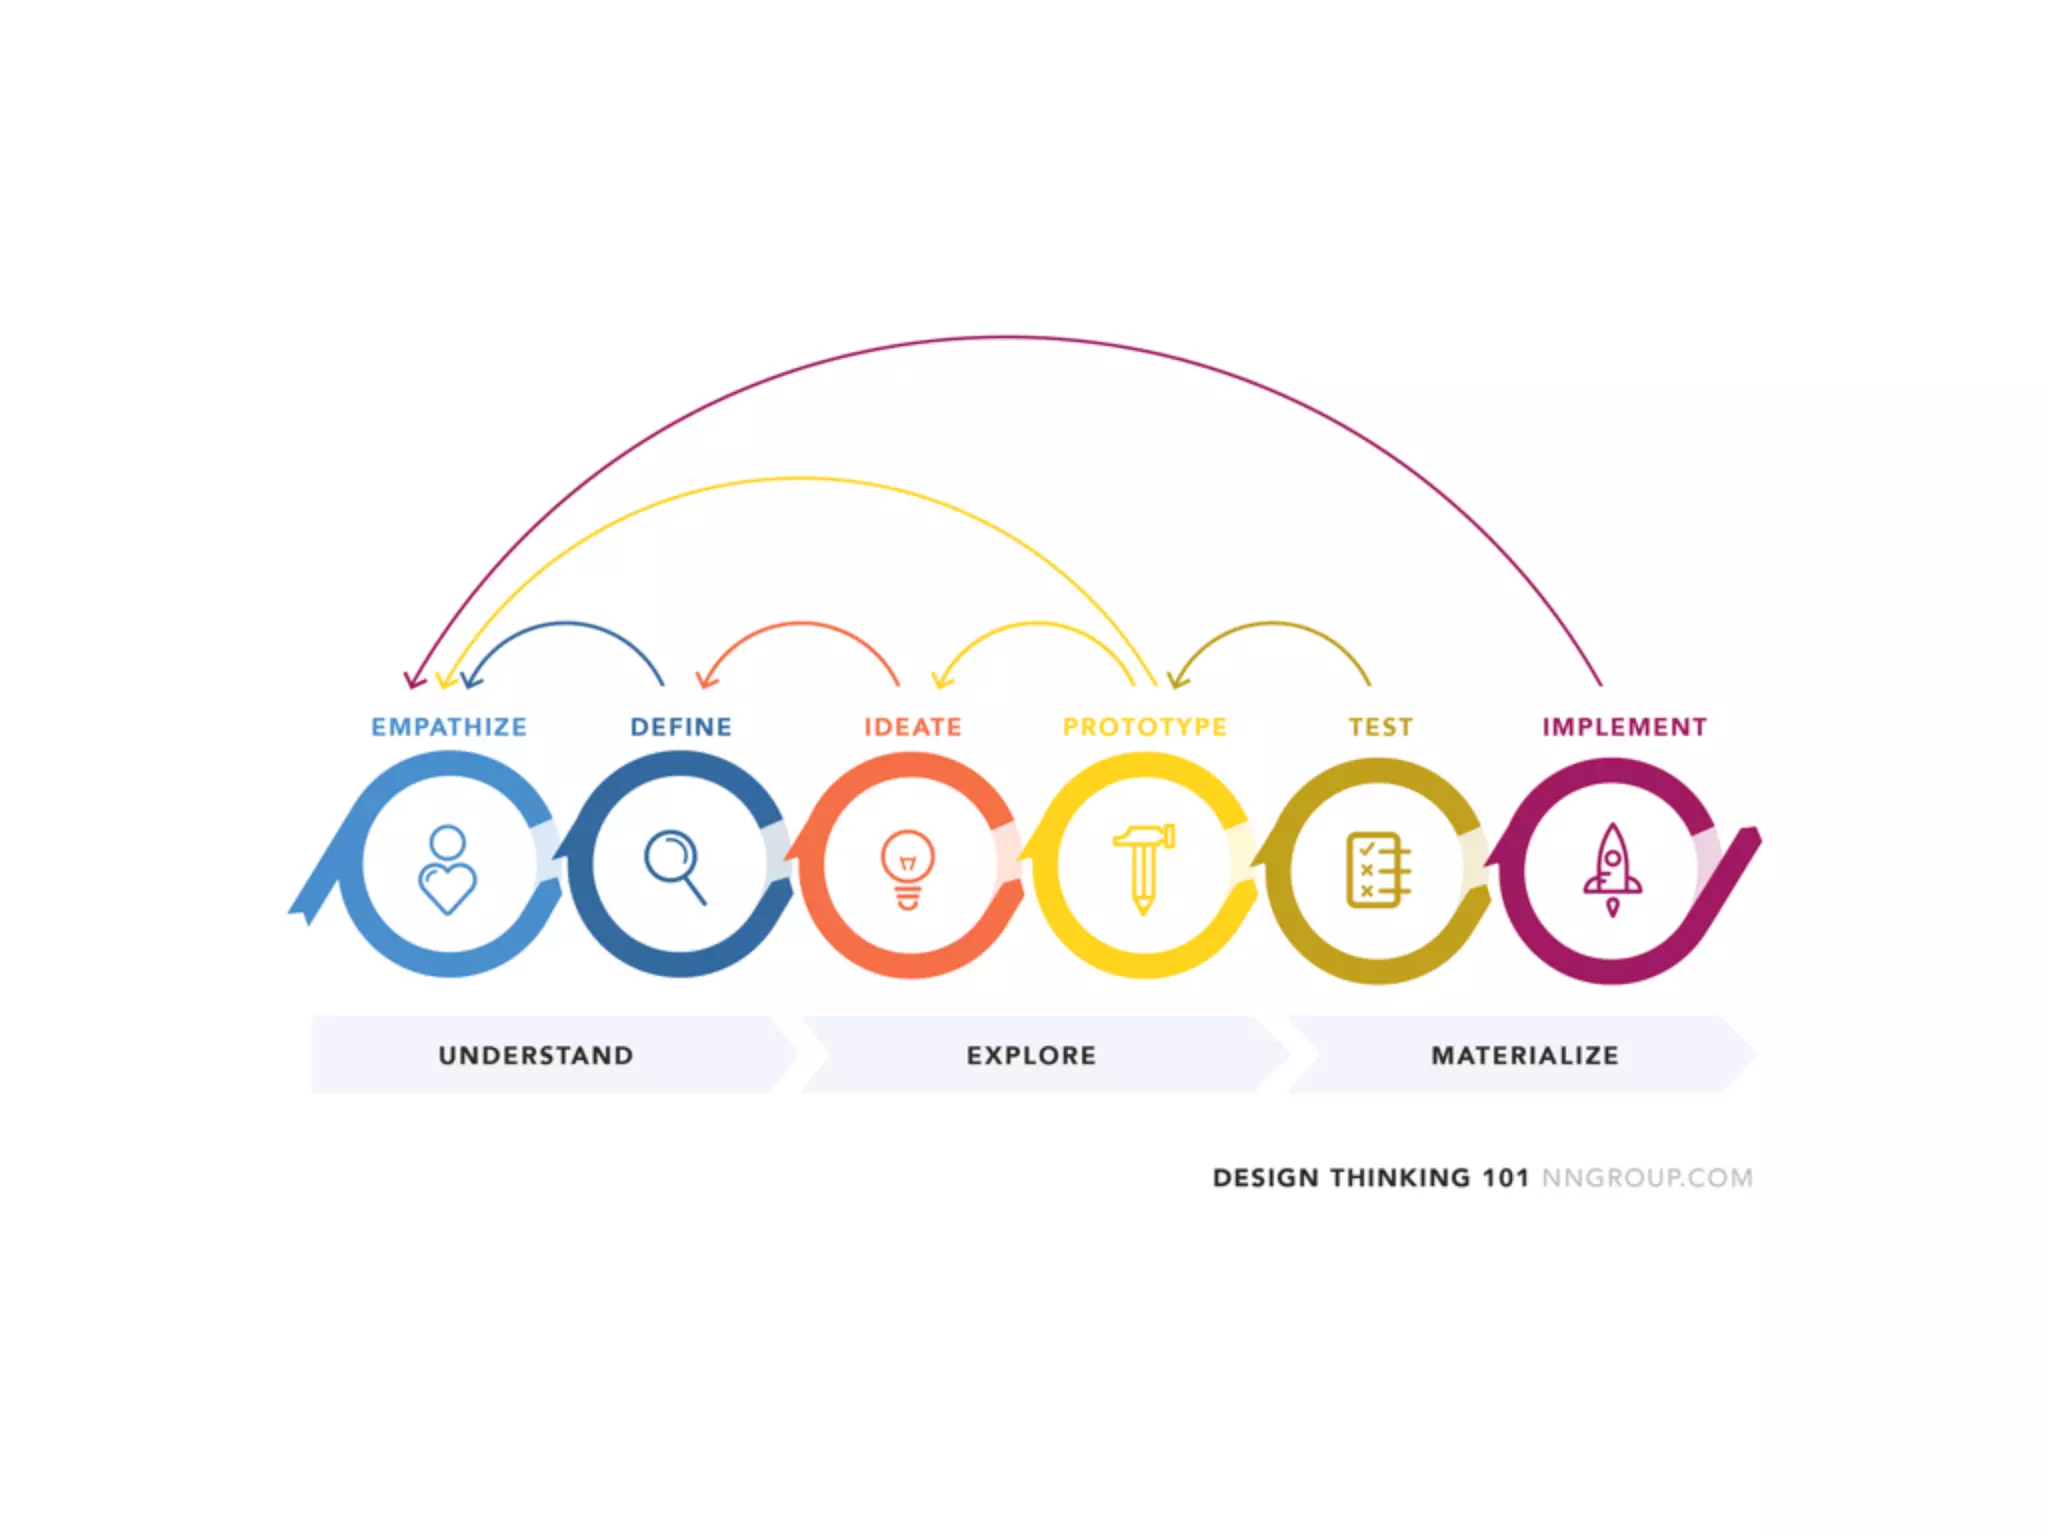
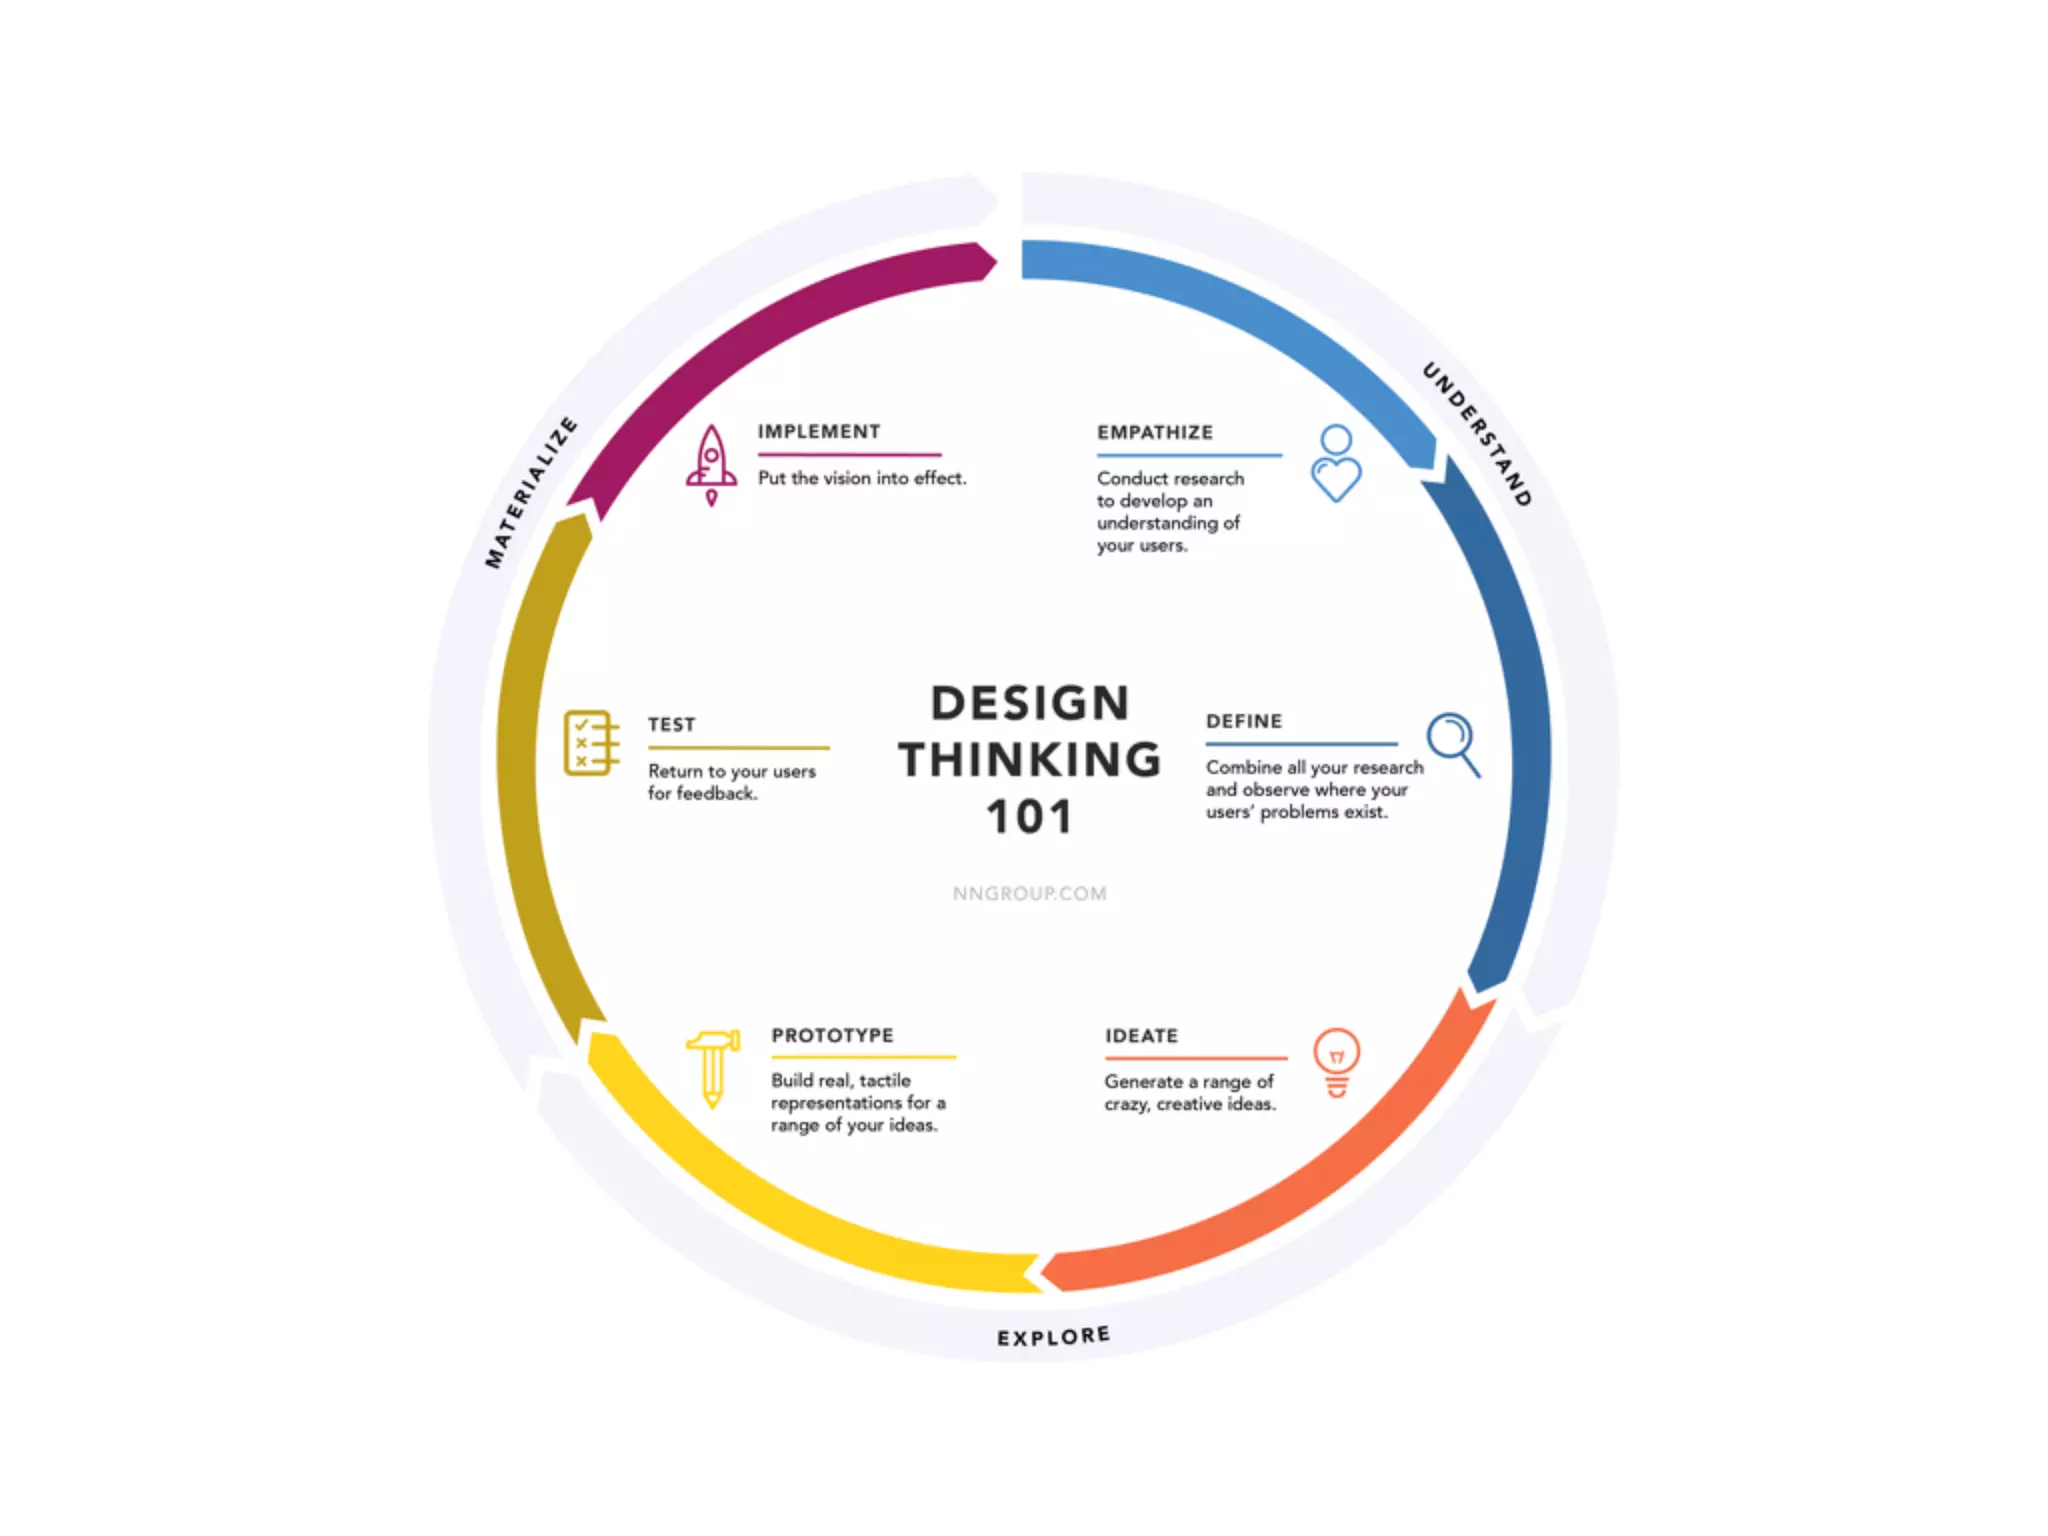
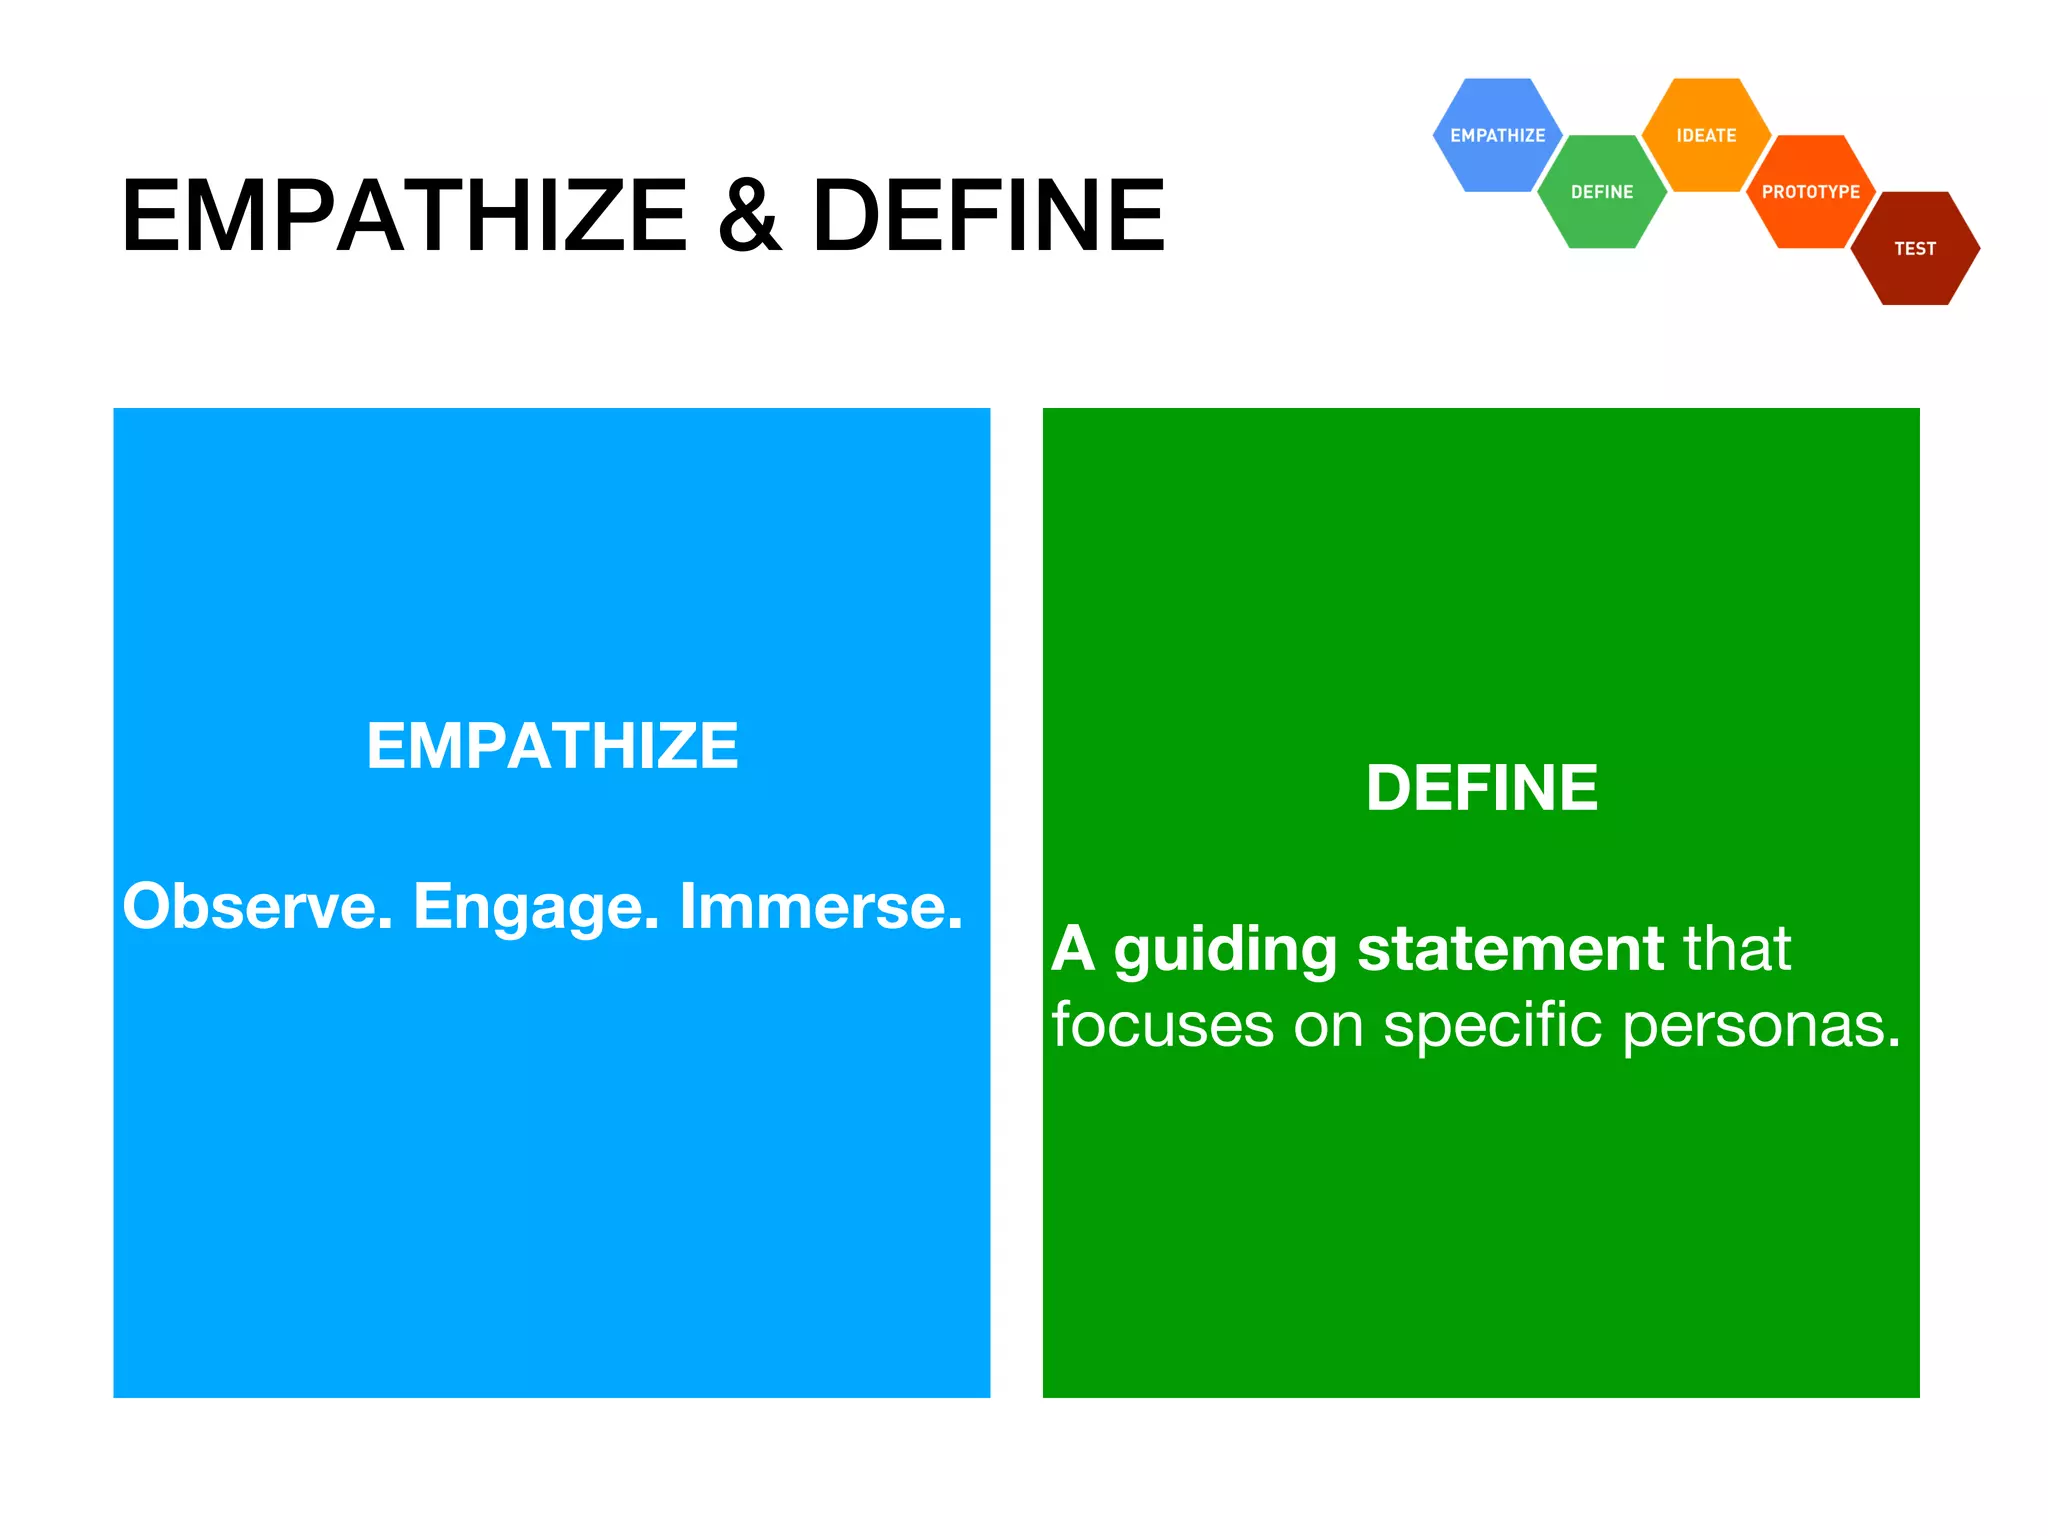
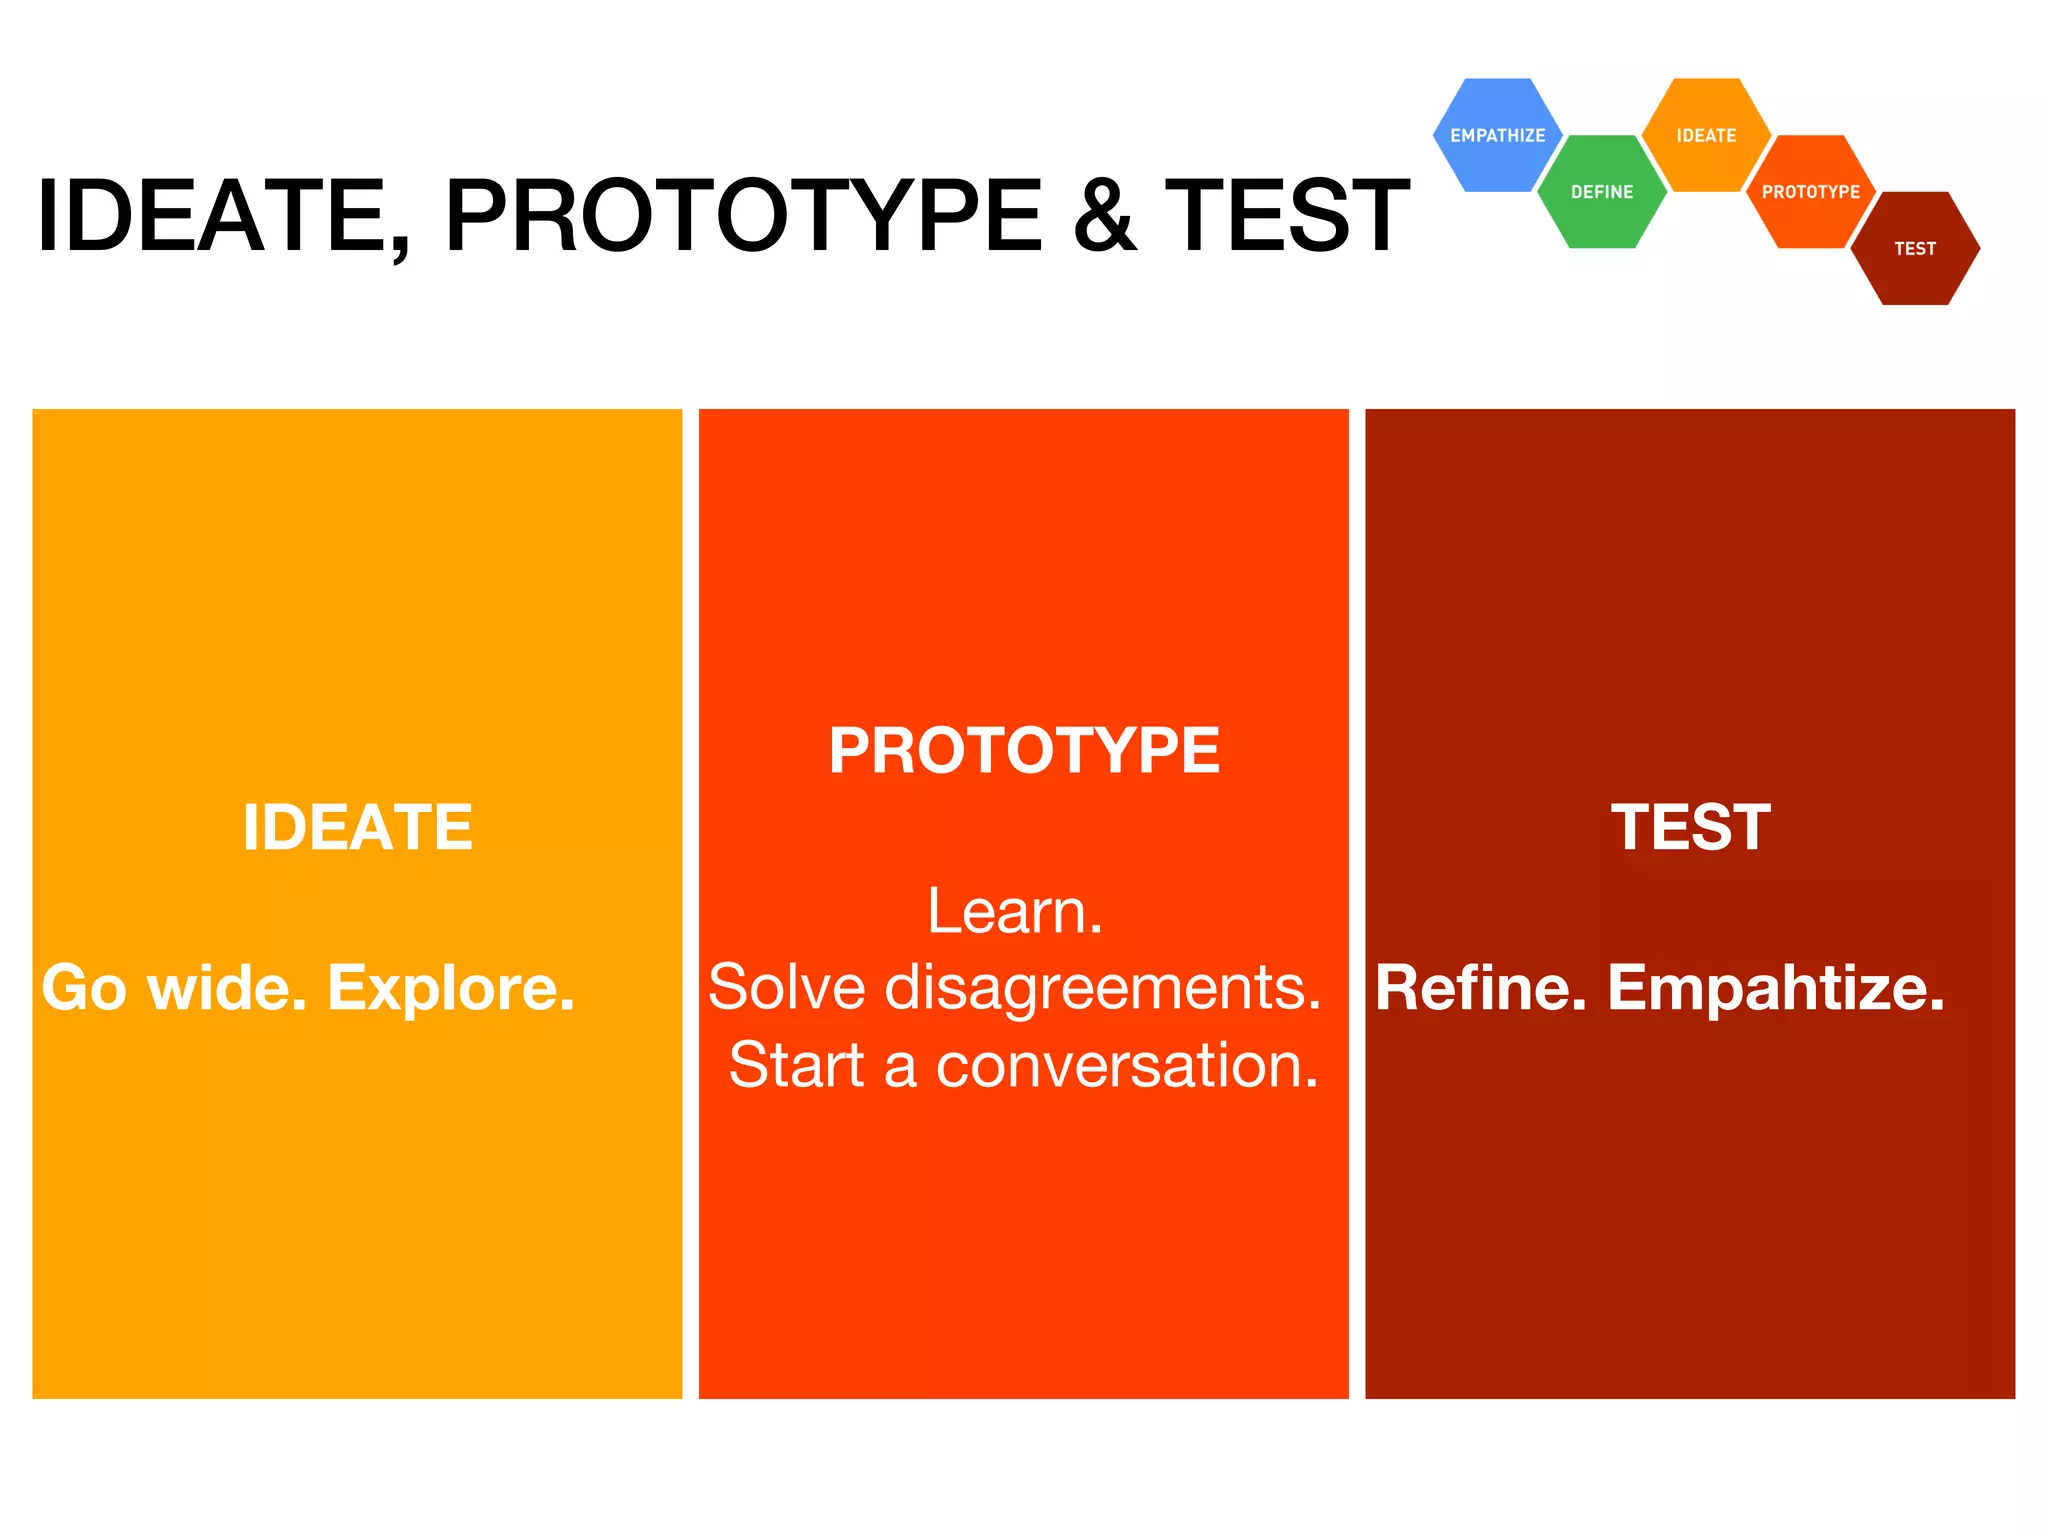
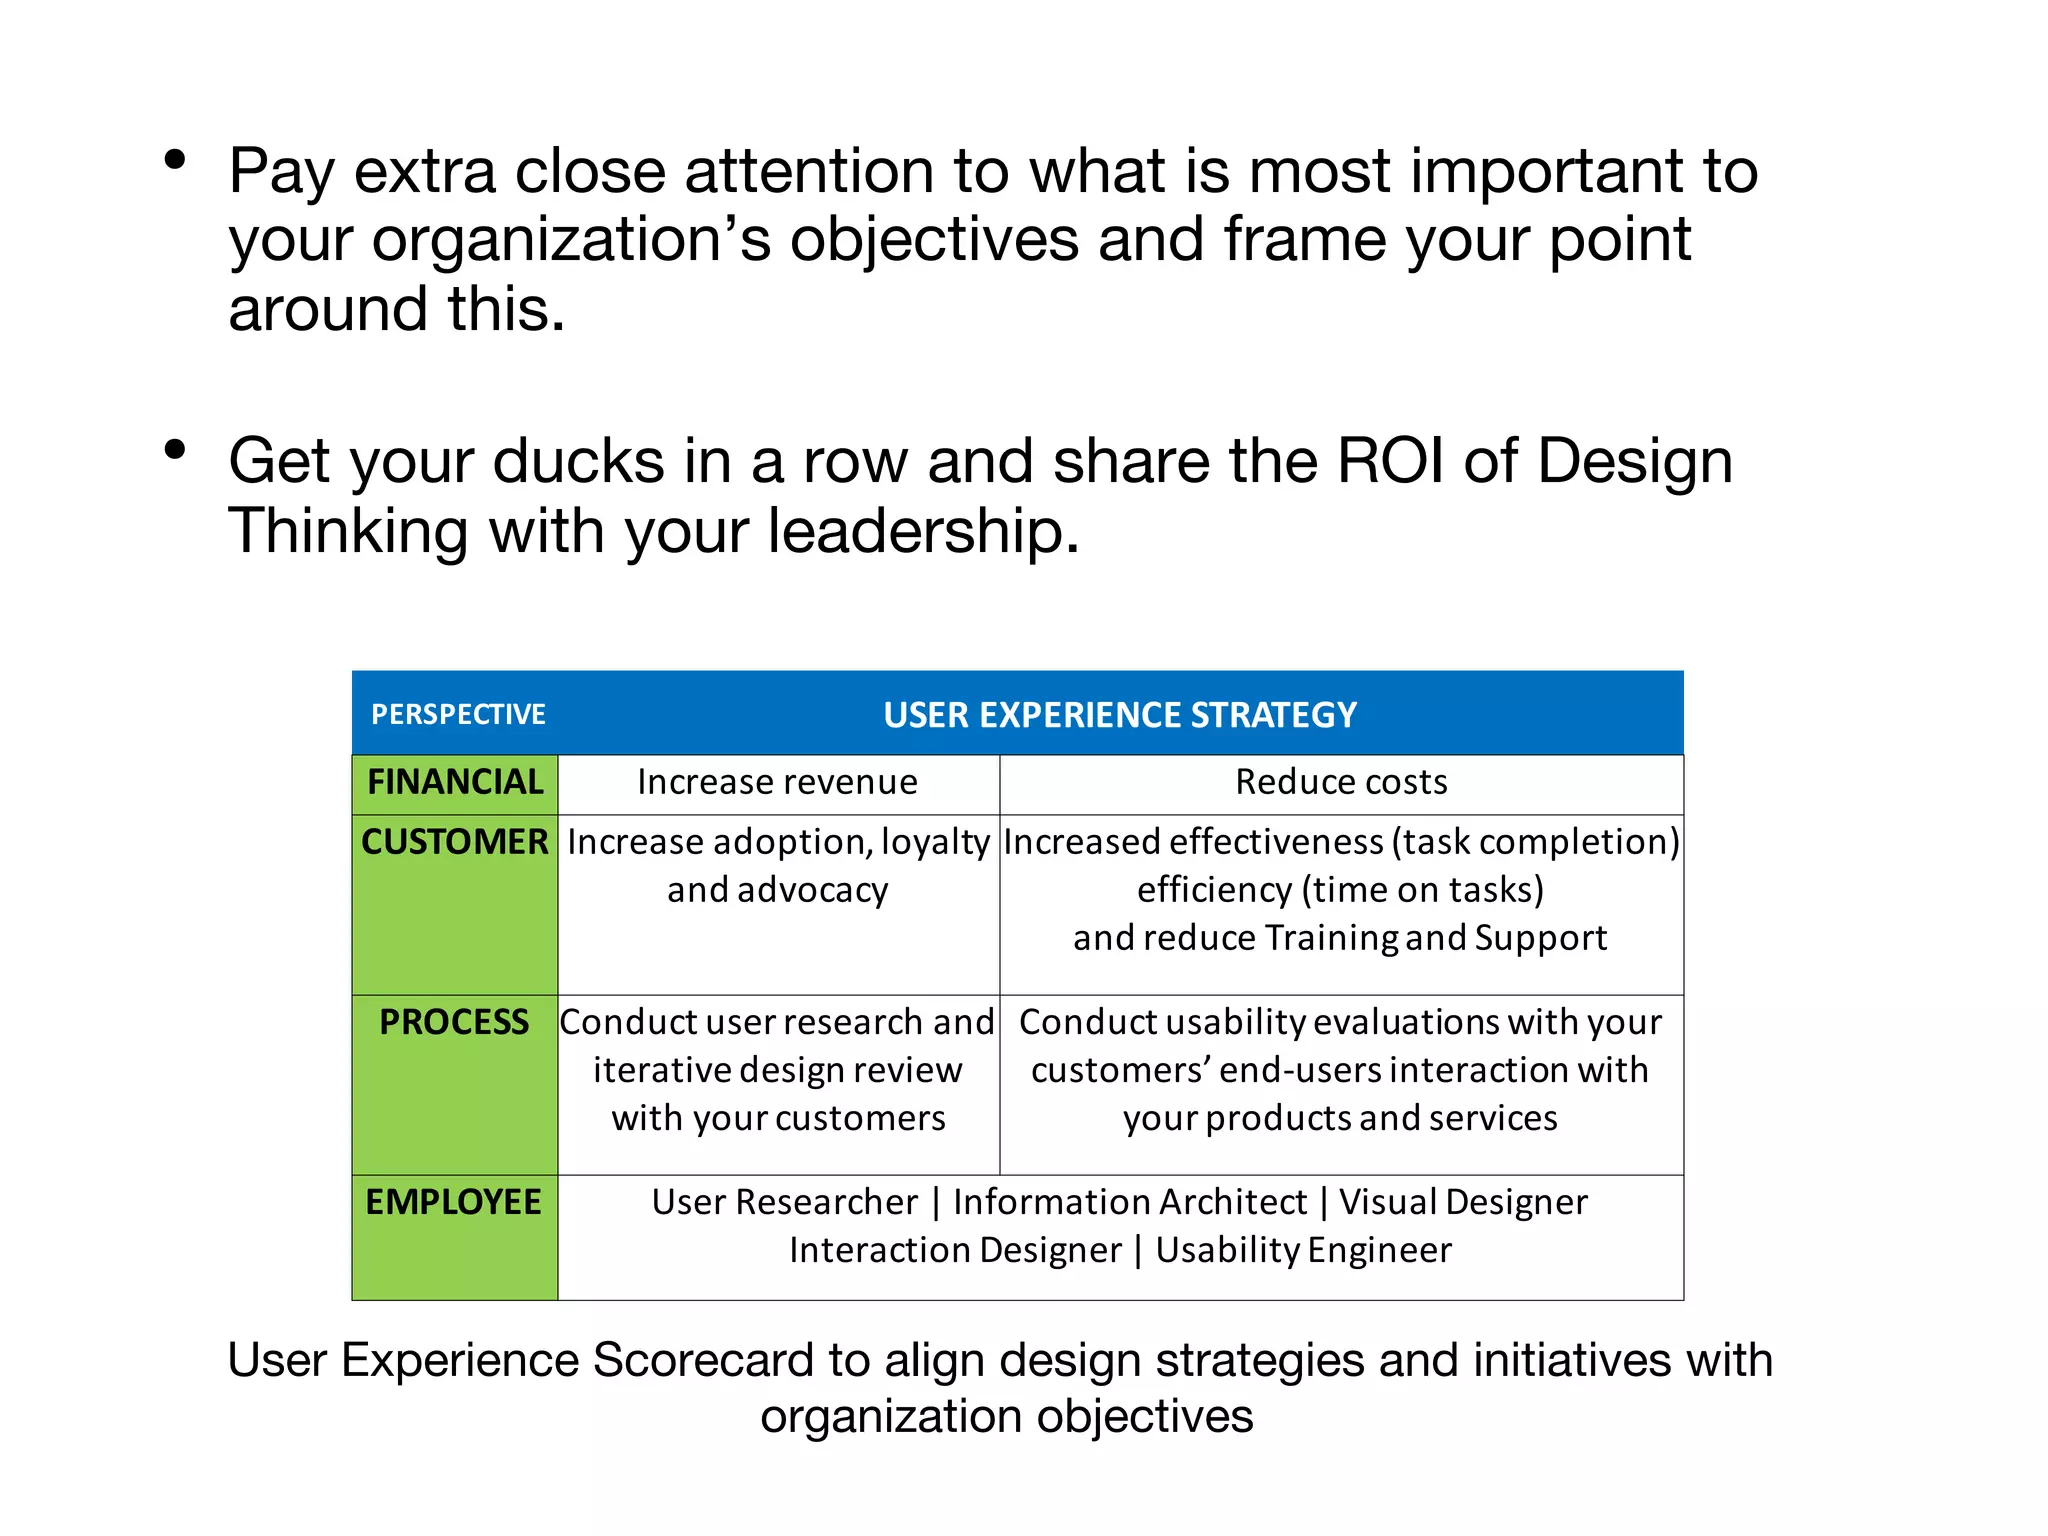
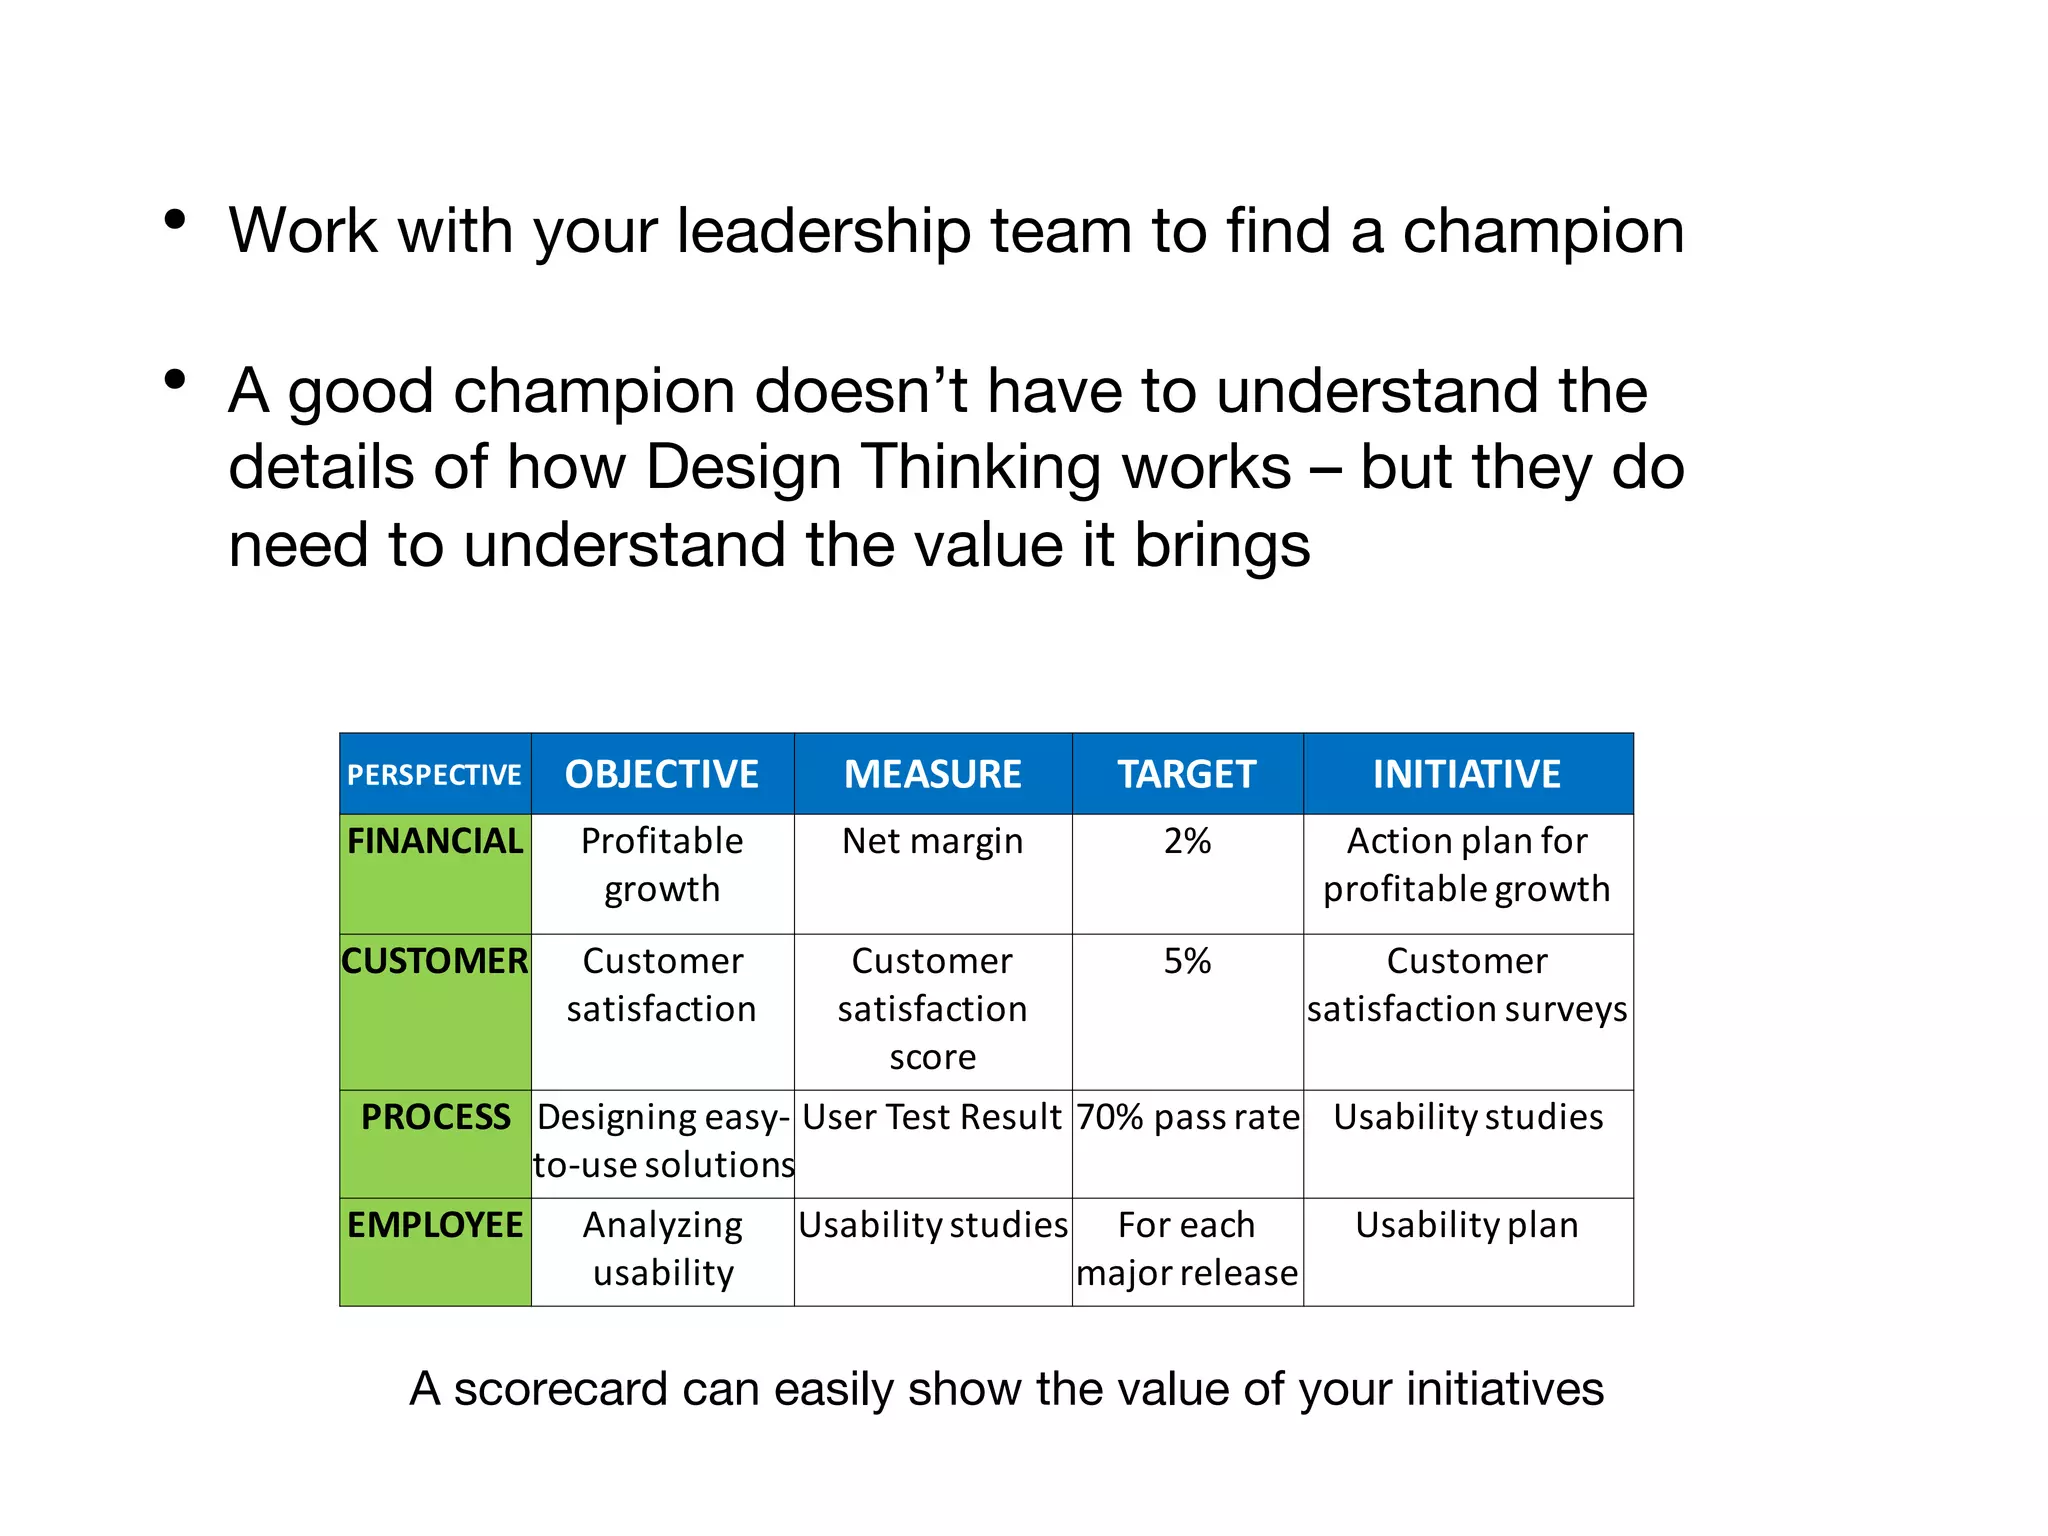

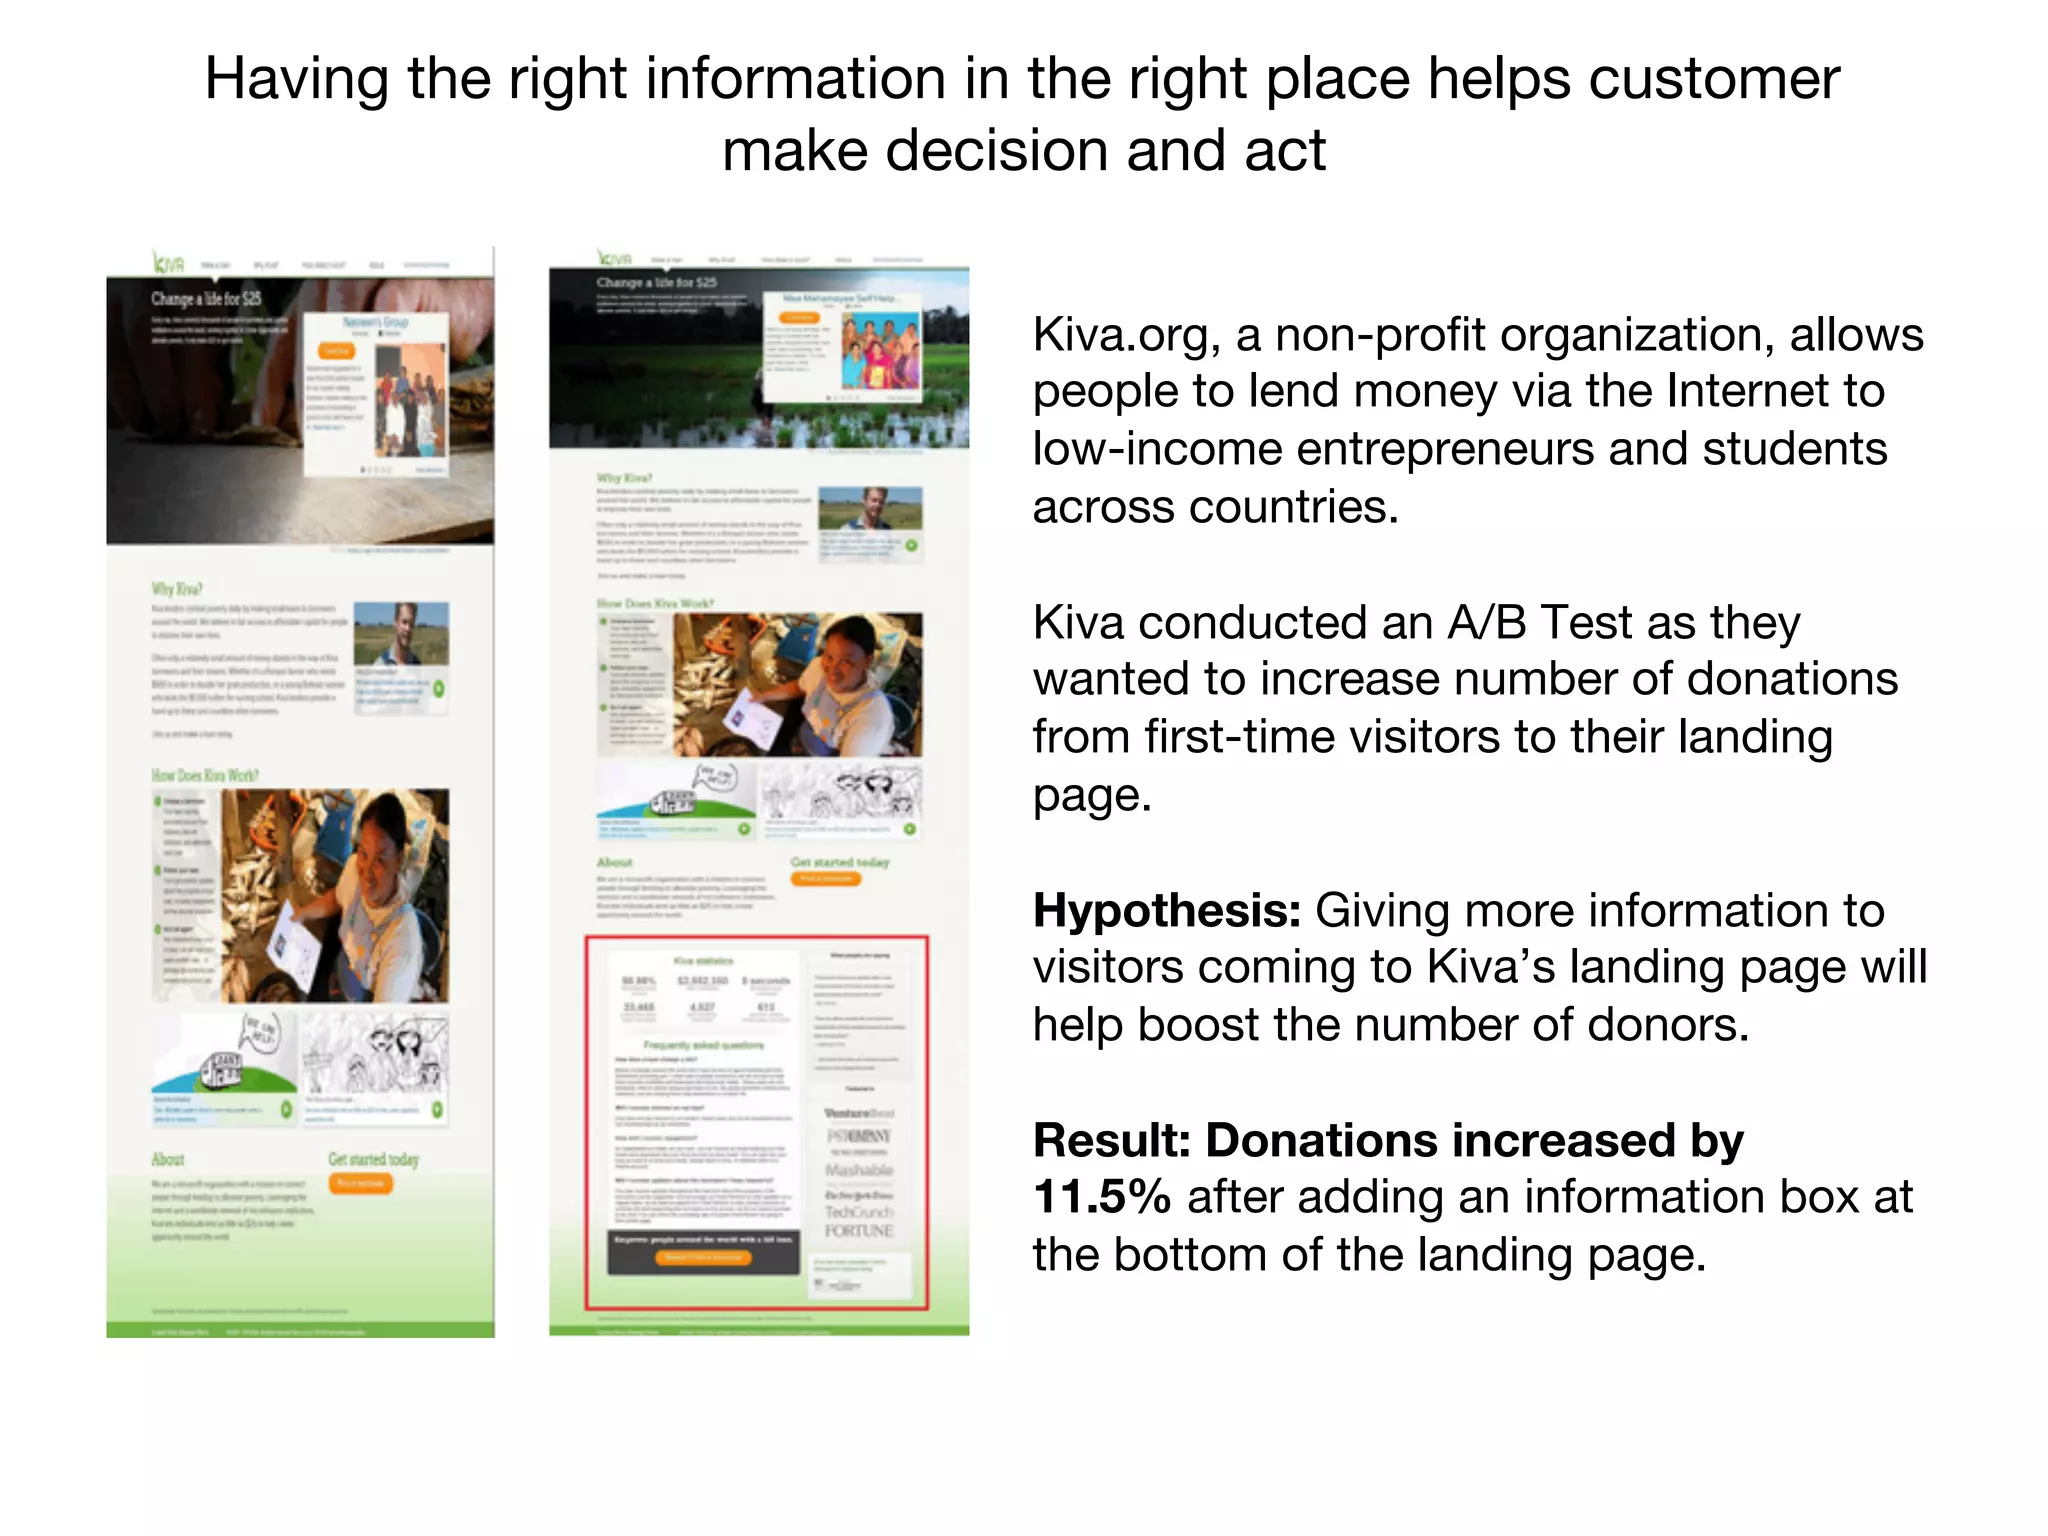
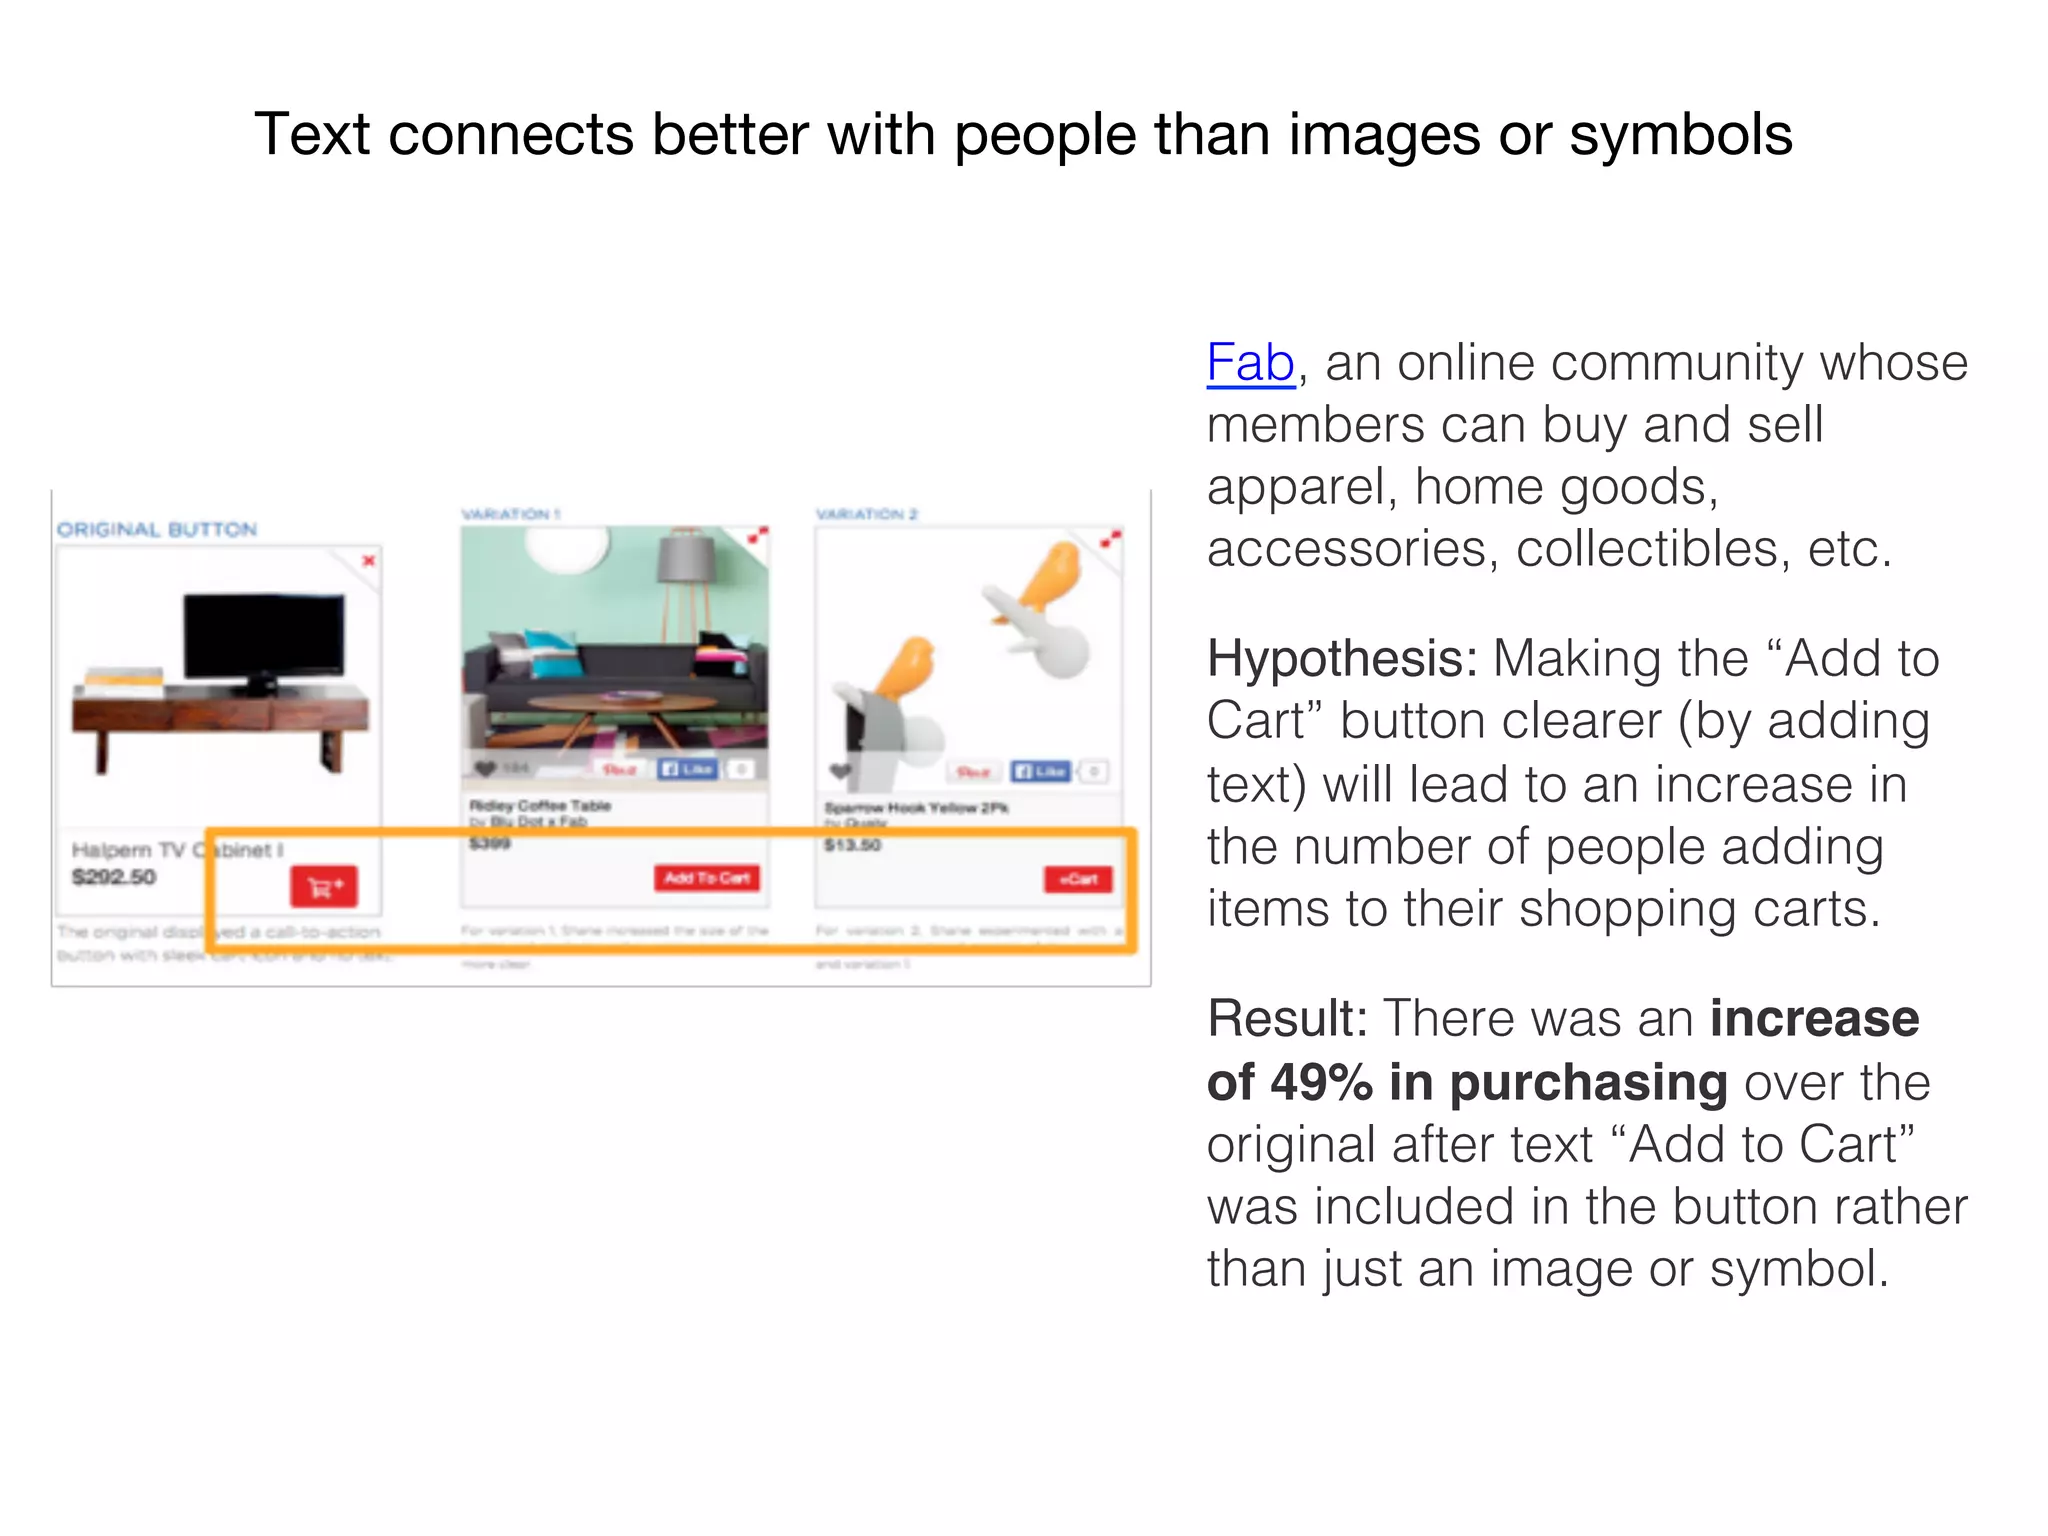

This document summarizes a webinar about optimizing strategy through combining design thinking and ROI metrics. The webinar covered the five phases of design thinking, getting executive buy-in by focusing on organizational objectives and sharing ROI examples. It also discussed appointing a champion, measuring ROI through factors like time savings and reduced defects, and examples of how design improvements led to better outcomes for companies like Kiva and Fab. The webinar concluded with a Q&A section.


![[Webinar] Transitioning to Remote Research](https://cdn.slidesharecdn.com/ss_thumbnails/webinartransitioningtoremoteresearch-200501100412-thumbnail.jpg?width=640&height=640&fit=bounds)


![[19.2 UserZoom Spring Release Webinar] Get Card Sort Insights with Confidence](https://cdn.slidesharecdn.com/ss_thumbnails/19-190509203842-thumbnail.jpg?width=640&height=640&fit=bounds)


![[Product Release Highlight] Seamlessly Discover and Share Your User Experienc...](https://cdn.slidesharecdn.com/ss_thumbnails/seamlesslydiscoverandshareyouruserexperiencestory-181101164620-thumbnail.jpg?width=640&height=640&fit=bounds)


![Vibe Coding vs. Spec-Driven Development [Free Meetup]](https://cdn.slidesharecdn.com/ss_thumbnails/vibecodingvsspecdrivendevelopment-251209105622-43f455e7-thumbnail.jpg?width=640&height=640&fit=bounds)


