
More Related Content
Similar to SUEC 高中 Adv Maths (Statistic).pptx
Similar to SUEC 高中 Adv Maths (Statistic).pptx (20)
More from tungwc
More from tungwc (20)
Recently uploaded
Recently uploaded (20)
SUEC 高中 Adv Maths (Statistic).pptx
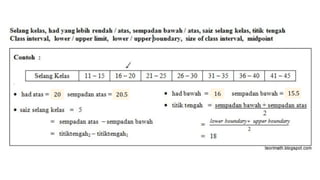
- 1. 20 20.5 16 15.5
- 4. 𝒑𝒈 𝟏𝟕𝟐 ℎ𝑒𝑖𝑔ℎ𝑡 𝑑𝑖𝑠𝑡𝑟𝑖𝑏𝑢𝑡𝑖𝑜𝑛 𝑜𝑓 100 𝑐ℎ𝑖𝑙𝑑𝑟𝑒𝑛
- 5. 𝒑𝒈 𝟏𝟕𝟑 𝑠𝑐𝑜𝑟𝑒 𝑜𝑓 100 𝑠𝑡𝑢𝑑𝑒𝑛𝑡𝑠
- 6. 𝒑𝒈 𝟏𝟕𝟒 − 𝟏𝟕𝟓 12 𝑐𝑙𝑎𝑠𝑠 𝑖𝑛𝑡𝑒𝑟𝑣𝑎𝑙 𝑤𝑖𝑡ℎ 𝑠𝑖𝑧𝑒 = 0.3 𝑐𝑚 Class Interval f 3.6 - 3.9 0 4.0 - 4.3 1 4.4 - 4.7 3 4.8 - 5.1 5 5.2 - 5.5 16 5.6 - 5.9 22 6.0 - 6.3 29 6.4 - 6.7 15 6.8 - 7.1 8 7.2 - 7.5 1 7.6 - 7.9 0 8.0 - 8.3 0 100
- 7. 𝒑𝒈 𝟏𝟕𝟓 Class Interval f 1 - 2 0 3 - 4 22 5 - 6 53 7 - 8 15 9 - 10 0 90
- 8. 𝒑𝒈 𝟏𝟕𝟓 70 max 85 min 15 Class Interval f 0 - 10 0 11 - 20 2 21 - 30 1 31 - 40 3 41 - 50 8 51 - 60 14 61 - 70 11 71 - 80 5 81 - 90 1 91 - 100 0 45
- 9. 𝒑𝒈 𝟏𝟕𝟓 𝑙𝑖𝑓𝑒𝑠𝑝𝑎𝑛 𝑜𝑓 100 𝑡𝑦𝑟𝑒𝑠
- 11. 100 %
- 12. 𝒑𝒈 𝟏𝟕𝟕 𝑢𝑝𝑝𝑒𝑟 𝑏𝑜𝑢𝑛𝑑𝑎𝑟𝑦 𝑐𝑢𝑚𝑢𝑙𝑎𝑡𝑖𝑣𝑒 𝑓 𝑟𝑎𝑛𝑘𝑖𝑛𝑔 𝑝𝑜𝑖𝑛𝑡𝑠 𝑓𝑟𝑜𝑚 ℎ𝑖𝑔ℎ 𝑡𝑜 𝑙𝑜𝑤, 50 − 10
- 13. 𝒑𝒈 𝟏𝟕𝟗 𝑤𝑒𝑖𝑔ℎ𝑡 𝑜𝑓 90 𝑖𝑛𝑓𝑎𝑛𝑡𝑠 Upper Boundary ∑f 1.55 0 2.05 2 2.55 6 3.05 19 3.55 51 4.05 79 4.55 89 5.05 90 100 %
- 14. 𝒑𝒈 𝟏𝟕𝟗 𝑠𝑐𝑜𝑟𝑒 𝑜𝑓 50 𝑔𝑖𝑟𝑙𝑠 Upper Boundary ∑f 50.5 0 60.5 5 70.5 13 80.5 27 90.5 41 100.5 50 100 % 30 % 38
- 15. 𝒑𝒈 𝟏𝟕𝟗 Upper Boundary ∑f 3.445 0 3.545 1 3.645 4 3.745 10 3.845 16 3.945 28 4.045 36 4.145 40 100 %
- 16. 𝒑𝒈 𝟏𝟕𝟗 Upper Boundary ∑f 9.5 0 19.5 5 29.5 17 39.5 31 49.5 52 59.5 70 69.5 86 79.5 94 89.5 100 53.9 10 𝑠𝑐𝑜𝑟𝑒 𝑜𝑓 100 𝑐𝑎𝑛𝑑𝑖𝑑𝑎𝑡𝑒𝑠
- 17. 𝒑𝒈 𝟏𝟖𝟎
- 18. 𝒑𝒈 𝟏𝟖𝟎
- 19. 𝒑𝒈 𝟏𝟖𝟏 30
- 20. 𝒑𝒈 𝟏𝟖𝟏 ℎ𝑒𝑖𝑔ℎ𝑡 𝑜𝑓 100 𝑐ℎ𝑖𝑙𝑑
- 22. 𝒑𝒈 𝟏𝟖𝟐 60.7
- 24. 𝒑𝒈 𝟏𝟖𝟐 = 74.67 = 75.03 𝑤𝑒𝑖𝑔ℎ𝑡 (𝑎) 𝑎𝑟𝑖𝑚𝑒𝑡𝑟𝑖𝑐 𝑚𝑒𝑎𝑛 = 𝛴 𝑚𝑎𝑟𝑘𝑠 𝛴 𝑠𝑢𝑏𝑗𝑒𝑐𝑡𝑠 = 75 + 65 + 82 + 66 + 73 + 87 6 (𝑏) 𝑤𝑒𝑖𝑔ℎ𝑡𝑒𝑑 𝑚𝑒𝑎𝑛 = 𝛴 (𝑚𝑎𝑟𝑘𝑠 × 𝑤𝑒𝑖𝑔ℎ𝑡) 𝛴 𝑤𝑒𝑖𝑔ℎ𝑡 = 75(6) + 65(6) + 82(8) + 66(5) + 73(5) + 87(5) 6 + 6 + 8 + 5 + 5 + 5
- 25. 15
- 27. 𝒑𝒈 𝟏𝟖𝟒 − 𝟏𝟖𝟓 m = median L = Lower boundary of median class N = Number of data F = Σ𝑓 before median class 𝑓 𝑚 = 𝑓 in median class c = Class size = (Upper boundary – lower boundary)
- 28. 𝒑𝒈 𝟏𝟖𝟓 m = median L = Lower boundary of median class N = Number of data F = Σ𝑓 before median class 𝑓 𝑚 = 𝑓 in median class c = Class size = (Upper boundary – lower boundary)
- 29. 𝒑𝒈 𝟏𝟖𝟓 m = median L = Lower boundary of median class N = Number of data F = Σ𝑓 before median class 𝑓 𝑚 = 𝑓 in median class c = Class size = (Upper boundary – lower boundary) 9.45 38 38
- 30. 𝒑𝒈 𝟏𝟖𝟓 m = median L = Lower boundary of median class N = Number of data F = Σ𝑓 before median class 𝑓 𝑚 = 𝑓 in median class c = Class size = (Upper boundary – lower boundary) = 38 (𝑎) 33, 35, 35, 36, 36, 37, 37, 38, 38, 38, 38, 39, 40, 40, 41 𝑚𝑒𝑑𝑖𝑎𝑛 = 38 Class Interval f ∑f 33 - 35 1 1 35 - 37 4 5 37 - 39 6 11 39 - 41 3 14 41 - 43 1 15 15 (𝑏) 15 2 = 7.5 𝑚 = 37.5 + 7.5 − 6 11 3 = 37.9
- 31. 𝒑𝒈 𝟏𝟖𝟓 m = median L = Lower boundary of median class N = Number of data F = Σ𝑓 before median class 𝑓 𝑚 = 𝑓 in median class c = Class size = (Upper boundary – lower boundary) 3 100 Upper Boundary ∑f 1000.5 0 2000.5 11 3000.5 28 4000.5 48 5000.5 58 6000.5 60 100 %
- 33. 𝒑𝒈 𝟏𝟖𝟔
- 34. 𝒑𝒈 𝟏𝟖𝟕 4 6, 8 1.0 1.69 1.70 1.75
- 35. 𝒑𝒈 𝟏𝟖𝟕
- 36. 𝒑𝒈 𝟏𝟖𝟖 33
- 38. 𝒑𝒈 𝟏𝟖𝟗
- 39. 𝒑𝒈 𝟏𝟗𝟎 𝑄3 − 𝑄1 2
- 40. 𝒑𝒈 𝟏𝟗𝟎 − 𝟏𝟗𝟏 𝑄3 − 𝑄1 2 25 % 75 % 50 %
- 41. 𝒑𝒈 𝟏𝟗𝟏 𝑄3 − 𝑄1 2 9 𝑄1 = 2 , 𝑄2 = 3 , 𝑄3 = 5 𝑄3 − 𝑄1 2 = 1.5 0.7 𝑄1 = 1.05 , 𝑄2 = 1.2 , 𝑄3 = 1.4 𝑄3 − 𝑄1 2 = 0.175
- 42. 𝒑𝒈 𝟏𝟗𝟏 𝑄3 − 𝑄1 2 70 9.5 Upper Boundary ∑f 30.5 0 40.5 3 50.5 7 60.5 20 70.5 42 80.5 72 90.5 95 100.5 100
- 43. 𝒑𝒈 𝟏𝟗𝟐
- 44. 𝒑𝒈 𝟏𝟗𝟑
- 46. 𝒑𝒈 𝟏𝟗𝟒 57 7.44
- 47. 𝒑𝒈 𝟏𝟗𝟓
- 48. 𝒑𝒈 𝟏𝟗𝟓 𝑤ℎ𝑖𝑐ℎ 𝑚𝑎𝑐ℎ𝑖𝑛𝑒 𝑖𝑠 𝑏𝑒𝑡𝑡𝑒𝑟?
- 49. 𝒑𝒈 𝟏𝟗𝟔 − 𝟏𝟗𝟕 2 0.055 0.105 𝐵 3.63 5.13 𝐴
- 55. 𝒑𝒈 𝟏𝟗𝟔 275
- 56. 𝒑𝒈 𝟏𝟗𝟕 160 10 𝑆 = 4.243 𝑆2 = 18.0036
Editor's Notes
- http://teorimath.blogspot.com/2012/11/17-statistik-statistics-i-ii-iii.html
- http://teorimath.blogspot.com/2012/11/17-statistik-statistics-i-ii-iii.html
- http://teorimath.blogspot.com/2012/11/17-statistik-statistics-i-ii-iii.html
- http://teorimath.blogspot.com/2012/11/17-statistik-statistics-i-ii-iii.html
- http://teorimath.blogspot.com/2012/11/17-statistik-statistics-i-ii-iii.html
- http://teorimath.blogspot.com/2012/11/17-statistik-statistics-i-ii-iii.html
- http://teorimath.blogspot.com/2012/11/17-statistik-statistics-i-ii-iii.html
- https://www.onlinemathlearning.com/mode.html
- The test score of a class of 36 students are as follows. (a) Group by 4 distances (b) average from the frequency distribution table (c) average different from the frequency distribution table
- https://www.open.edu/openlearn/science-maths-technology/mathematics-statistics/using-numbers-and-handling-data/content-section-3.8.1