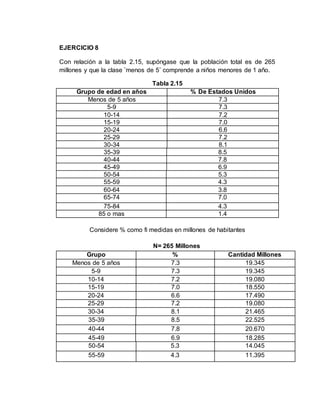
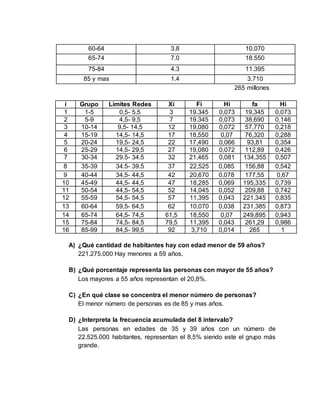
- The document presents data on the population distribution in the United States by age group, with the total population being 265 million people. It includes the percentage and number of people in each age group.
- Some key figures extracted from the data include that people under 59 years old account for 221.275 million people, and those over 55 years make up 20.8% of the population. The smallest age group is 85 years and older, with 3.71 million people.
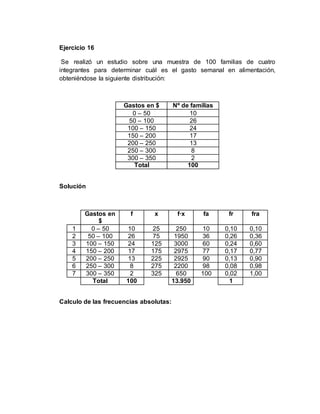
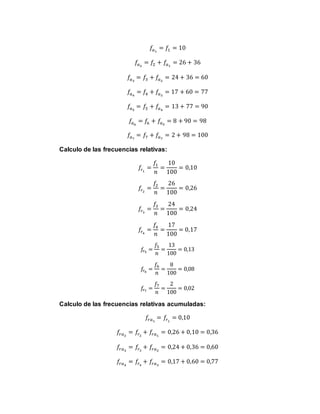
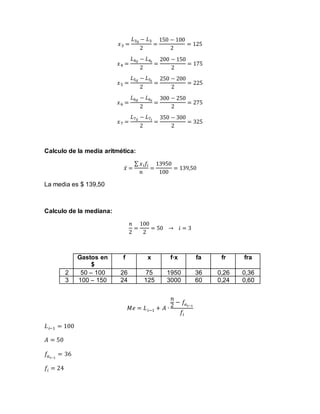
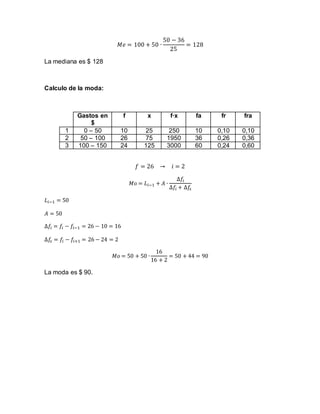
- The second part of the document examines survey data from 100 families on their weekly food spending, categorizing the results into spending ranges and calculating statistics like the mean, median and mode.
Planteamiento de un problema de programación lineal “Granja Guerrero”lobi7o
En la Granja “GUERRERO” se crían cerdos para venta, el propietario desea saber cuánto va a comprar de alimento balanceado para cada cerdo los alimentos contienen tres nutrientes: carbohidratos, proteínas y vitaminas. Los mínimos necesarios son 160 unidades de carbohidratos, 200 unidades de proteínas y 80 unidades de vitaminas. En el mercado existen dos clases de alimento necesarios para la crianza de los cerdos; el maíz cuesta $8 por bolsa, contiene 3 unidades de carbohidratos 5 unidades de proteínas y 1 unidad de vitaminas. El engorde cuesta $6 por bolsa, que contiene 2 unidades de cada nutriente. ¿Cuántas bolsas de cada alimento debe comprar para que el costo sea mínimo?
La resolución de problemas lineales con sólo dos o tres variables de decisión se puede ilustrar gráficamente, mostrándose como una ayuda visual para comprender muchos de los conceptos y términos que se utilizan y formalizan con métodos de solución más sofisticados, como por ejemplo el Método Simplex, necesarios para la resolución de problemas con varias variables. Para ello se puede usar el método Gráfico.
Aunque en la realidad rara vez surgen problemas con sólo dos o tres variables de decisión, es sin embargo muy útil esta metodología de solución e interpretación, en la que se verán las situaciones típicas que se pueden dar, como son la existencia de una solución óptima única, de soluciones óptimas alternativas, la no existencia de solución y la no acotación.
Esta guía presenta unos conceptos básicos sobre recirculación, purga, conversión por paso y conversión global, desarrollados de una manera clara y concisa. Trae dos ejemplos del tema de conversión, adaptados del libro: "Principios elementales de los procesos químicos, R. Felder."
Hay otro ejemplo, en el que se emplea purga para reducir el contenido de impurezas a la entrada del reactor. Y, finalmente, trae unos ejercicios propuestos, para que el estudiante practique estos temas.
What is range and how to calculate it, quartile deviation,co-efficient of quartile deviation, arithmetic mean,mean deviation, variances and standard deviation.
Solution manual for essentials of business analytics 1st editorvados ji
Full download link :
https://getbooksolutions.com/download/solution-manual-for-essentials-of-business-analytics-1st-edition/
Detail about Essentials of Business : (Click link bellow to view example )
https://getbooksolutions.com/wp-content/uploads/2016/11/Solution-Manual-for-Essentials-of-Business-Analytics-1st-editor.pdf
Table of Contents
Chapter 1. What Is Business Analytics?
Chapter 2. Descriptive Statistics.
Chapter 3. Data Visualization.
4. Linear Regression.
5. Time Series Analysis and Forecasting.
6. Data Mining.
7. Spreadsheet Models.
8. Linear Optimization Models.
9. Integer Linear Optimization.
10. Nonlinear Optimization Models.
11. Monte Carlo Simulation.
12. Decision Analysis.
1.HISTOGRAM & FREQUENCY CURVE
2.HISTOGRAM & FREQUENCY POLYGON
3.ARITHMETIC MEAN
4.GEOMETRIC MEAN
5.HARMONIC MEAN
6.MEDIAN
7.MODE
8.QAURTILE
9.DECILE
10.PERCENTILE
11.OGIVE : LESS THAN
12.OGIVE : MORE THAN
13.QUARTILE DEVIATION
14.MEAN DEVIATION
15.MEDIAN DEVIATION
A review of the growth of the Israel Genealogy Research Association Database Collection for the last 12 months. Our collection is now passed the 3 million mark and still growing. See which archives have contributed the most. See the different types of records we have, and which years have had records added. You can also see what we have for the future.
The simplified electron and muon model, Oscillating Spacetime: The Foundation...RitikBhardwaj56
Discover the Simplified Electron and Muon Model: A New Wave-Based Approach to Understanding Particles delves into a groundbreaking theory that presents electrons and muons as rotating soliton waves within oscillating spacetime. Geared towards students, researchers, and science buffs, this book breaks down complex ideas into simple explanations. It covers topics such as electron waves, temporal dynamics, and the implications of this model on particle physics. With clear illustrations and easy-to-follow explanations, readers will gain a new outlook on the universe's fundamental nature.
A Strategic Approach: GenAI in EducationPeter Windle
Artificial Intelligence (AI) technologies such as Generative AI, Image Generators and Large Language Models have had a dramatic impact on teaching, learning and assessment over the past 18 months. The most immediate threat AI posed was to Academic Integrity with Higher Education Institutes (HEIs) focusing their efforts on combating the use of GenAI in assessment. Guidelines were developed for staff and students, policies put in place too. Innovative educators have forged paths in the use of Generative AI for teaching, learning and assessments leading to pockets of transformation springing up across HEIs, often with little or no top-down guidance, support or direction.
This Gasta posits a strategic approach to integrating AI into HEIs to prepare staff, students and the curriculum for an evolving world and workplace. We will highlight the advantages of working with these technologies beyond the realm of teaching, learning and assessment by considering prompt engineering skills, industry impact, curriculum changes, and the need for staff upskilling. In contrast, not engaging strategically with Generative AI poses risks, including falling behind peers, missed opportunities and failing to ensure our graduates remain employable. The rapid evolution of AI technologies necessitates a proactive and strategic approach if we are to remain relevant.
How to Build a Module in Odoo 17 Using the Scaffold MethodCeline George
Odoo provides an option for creating a module by using a single line command. By using this command the user can make a whole structure of a module. It is very easy for a beginner to make a module. There is no need to make each file manually. This slide will show how to create a module using the scaffold method.
Safalta Digital marketing institute in Noida, provide complete applications that encompass a huge range of virtual advertising and marketing additives, which includes search engine optimization, virtual communication advertising, pay-per-click on marketing, content material advertising, internet analytics, and greater. These university courses are designed for students who possess a comprehensive understanding of virtual marketing strategies and attributes.Safalta Digital Marketing Institute in Noida is a first choice for young individuals or students who are looking to start their careers in the field of digital advertising. The institute gives specialized courses designed and certification.
for beginners, providing thorough training in areas such as SEO, digital communication marketing, and PPC training in Noida. After finishing the program, students receive the certifications recognised by top different universitie, setting a strong foundation for a successful career in digital marketing.
Executive Directors Chat Leveraging AI for Diversity, Equity, and InclusionTechSoup
Let’s explore the intersection of technology and equity in the final session of our DEI series. Discover how AI tools, like ChatGPT, can be used to support and enhance your nonprofit's DEI initiatives. Participants will gain insights into practical AI applications and get tips for leveraging technology to advance their DEI goals.
Strategies for Effective Upskilling is a presentation by Chinwendu Peace in a Your Skill Boost Masterclass organisation by the Excellence Foundation for South Sudan on 08th and 09th June 2024 from 1 PM to 3 PM on each day.
This presentation includes basic of PCOS their pathology and treatment and also Ayurveda correlation of PCOS and Ayurvedic line of treatment mentioned in classics.
MATATAG CURRICULUM: ASSESSING THE READINESS OF ELEM. PUBLIC SCHOOL TEACHERS I...NelTorrente
In this research, it concludes that while the readiness of teachers in Caloocan City to implement the MATATAG Curriculum is generally positive, targeted efforts in professional development, resource distribution, support networks, and comprehensive preparation can address the existing gaps and ensure successful curriculum implementation.
Exploiting Artificial Intelligence for Empowering Researchers and Faculty, In...Dr. Vinod Kumar Kanvaria
Exploiting Artificial Intelligence for Empowering Researchers and Faculty,
International FDP on Fundamentals of Research in Social Sciences
at Integral University, Lucknow, 06.06.2024
By Dr. Vinod Kumar Kanvaria
Exploiting Artificial Intelligence for Empowering Researchers and Faculty, In...
Unidad 2
1. Programa Nacional De Formación En distribución Y Logística
Tablas de frecuencias
UNIDAD 2
Alumna:
Francelismar Valles
Cedula: 29.654.897
Docente:
Efren Escalona
U.C: Estadística
Sección: 2300
Barquisimeto, Agosto 2021
2. EJERCICIO 8
Con relación a la tabla 2.15, supóngase que la población total es de 265
millones y que la clase ¨menos de 5¨ comprende a niños menores de 1 año.
Tabla 2.15
Grupo de edad en años % De Estados Unidos
Menos de 5 años 7.3
5-9 7.3
10-14 7.2
15-19 7.0
20-24 6.6
25-29 7.2
30-34 8.1
35-39 8.5
40-44 7.8
45-49 6.9
50-54 5.3
55-59 4.3
60-64 3.8
65-74 7.0
75-84 4.3
85 o mas 1.4
Considere % como fi medidas en millones de habitantes
N= 265 Millones
Grupo % Cantidad Millones
Menos de 5 años 7.3 19.345
5-9 7.3 19.345
10-14 7.2 19.080
15-19 7.0 18.550
20-24 6.6 17.490
25-29 7.2 19.080
30-34 8.1 21.465
35-39 8.5 22.525
40-44 7.8 20.670
45-49 6.9 18.285
50-54 5.3 14.045
55-59 4.3 11.395
3. 60-64 3.8 10.070
65-74 7.0 18.550
75-84 4.3 11.395
85 y mas 1.4 3.710
265 millones
i Grupo Limites Redes Xi Fi Hi fa Hi
1 1-5 0,5- 5,5 3 19.345 0,073 19,345 0,073
2 5-9 4,5- 9,5 7 19.345 0,073 38,690 0,146
3 10-14 9,5- 14,5 12 19,080 0,072 57,770 0,218
4 15-19 14,5- 14,5 17 18,550 0,07 76,320 0,288
5 20-24 19,5- 24,5 22 17,490 0,066 93,81 0,354
6 25-29 14,5- 29,5 27 19,080 0,072 112,89 0,426
7 30-34 29.5- 34.5 32 21,465 0,081 134,355 0,507
8 35-39 34.5- 39.5 37 22,525 0,085 156,88 0,542
9 40-44 34,5- 44,5 42 20,670 0,078 177,55 0,67
10 45-49 44,5- 44,5 47 18,285 0,069 195,335 0,739
11 50-54 44,5- 54,5 52 14,045 0,052 209,88 0,742
12 55-59 54,5- 54,5 57 11,395 0,043 221,345 0,835
13 60-64 59,5- 64,5 62 10,070 0,038 231,385 0,873
14 65-74 64,5- 74,5 61,5 18,550 0,07 249,895 0,943
15 75-84 74,5- 84,5 79,5 11,395 0,043 261,29 0,986
16 85-99 84,5- 99,5 92 3,710 0,014 265 1
A) ¿Qué cantidad de habitantes hay con edad menor de 59 años?
221.275.000 Hay menores a 59 años.
B) ¿Qué porcentaje representa las personas con mayor de 55 años?
Los mayores a 55 años representan el 20,8%.
C) ¿En qué clase se concentra el menor número de personas?
El menor número de personas es de 85 y mas años.
D) ¿Interpreta la frecuencia acumulada del 8 intervalo?
Las personas en edades de 35 y 39 años con un número de
22.525.000 habitantes, representan el 8,5% siendo este el grupo más
grande.
4. Ejercicio 16
Se realizó un estudio sobre una muestra de 100 familias de cuatro
integrantes para determinar cuál es el gasto semanal en alimentación,
obteniéndose la siguiente distribución:
Gastos en $ Nº de familias
0 – 50 10
50 – 100 26
100 – 150 24
150 – 200 17
200 – 250 13
250 – 300 8
300 – 350 2
Total 100
Solución
Gastos en
$
f x f·x fa fr fra
1 0 – 50 10 25 250 10 0,10 0,10
2 50 – 100 26 75 1950 36 0,26 0,36
3 100 – 150 24 125 3000 60 0,24 0,60
4 150 – 200 17 175 2975 77 0,17 0,77
5 200 – 250 13 225 2925 90 0,13 0,90
6 250 – 300 8 275 2200 98 0,08 0,98
7 300 – 350 2 325 650 100 0,02 1,00
Total 100 13.950 1
Calculo de las frecuencias absolutas: