This document summarizes an experiment to study the emission spectroscopy of low pressure hydrogen gas. The experiment uses a diffraction grating to separate the light from a hydrogen gas lamp into distinct color lines corresponding to the Balmer series. Measurements of the positions of the red, blue-green, and violet lines are used to calculate the wavelengths and energies of the photons emitted in the spectral lines. The results confirm that the hydrogen spectrum is an atomic line spectrum as predicted by Bohr's quantum model of the hydrogen atom.
It give detail information on the measurement of the intensity of scattered light at right angles to the direction of the incident light as a function of the concentration of the dispersed phase
The branch of science which considers the dual behavior of matter is called quantum mechanics. The quantum mechanics model of atom ia based on quantum mechanics.
This paper shows my findings for determining the grating constant of a diffraction grating, the wavelengths of each line of the spectrum of hydrogen, and experimentally calculating the Rydberg constant.
Advance electronics, semiconductor devices handwritten notes in pdf form
if anybody needs the soft of this book cand contact to me I have also a solution of this book in pdf form my contact no
03201611448
METHOD OF HARDNESS MEASUREMENT:
There are two types of measurement of hardness of a compounds:
• Static indentation
• Rebound testing
STATIC INDENTATION:
• Static indentation involves pressing a ball diamond or other types of indenter under a specified constant load into surface of material and measuring the length width or depth of the indentation.
• The measured indentation size is then converted to a hardness number specified to the scale adopted.
• In general the harder the material the better the resistance and thus the smaller the indentation.
REBOUND TESTING:
• Rebound testing involves dropping an indenter o to the surface of specimen and measuring rebound height of the indenter.
• The potential energy at the initial height is converted to kinetic energy when the indenter is released.
• A fraction of the kinetic energy is consume for plastic deformation on impact living some kinetic energy after impact to convert back to potential energy and achieve a certain rebound height of the indenter.
• The rebound height the measure by the instrument is then converted to a hardness number.
Hard materials are difficult to cut and shape then softer ones. They are also usually more brittle which means that do not bend much but can shatter. Hard material are used in cutting tool machines and other industrial goods. Hardness test are important in material science. The MOHS scale of mineral hardness test the hardness of minerals. The Brinell scale and various compression tests and rebound test are more used for metals and artificial materials
Theoretically investigate the nature of direct band gap of novel materialsUCP
DIRECT BAND GAP:
In the direct band gap band to band recombination and generation occur.
Band to band recombination:
In band-to-band recombination electron from conduction band directly come back to valance band (in valance band holes are present which are the deficiency of electrons which are form when electrons leave valance band and go to conduction band) The electrons and holes annihilate each other the excess energy release during this process in the form of light called photon or in the form of thermal energy.
Band to band recombination is called direct band recombination.
Band to band generation:
In band-to-band generation electron is excited directly from valance band in to the conduction band after absorbing the thermal energy or photon(light) as shown in fig. given bellow.
If the thermal energy is absorbed this process is called thermal generation
If the light is absorbed this process is called photo generation
Momentum consideration in direct band:
In the EK plot K is the parameter proportional to momentum of electron.
GaAs is a notable member of direct band semiconductor
Photons, being massless entities carry the little momentum.
In direct band-band recombination K-value of electron’s and holes are all bounced k=o.as shown in figure given bellow, the little change in momentum is required for the recombination process to proceed.
For conservation of energy and momentum simply the photon is emitted
Energy and momentum have parabolic shape
Acetabularia Information For Class 9 .docxvaibhavrinwa19
Acetabularia acetabulum is a single-celled green alga that in its vegetative state is morphologically differentiated into a basal rhizoid and an axially elongated stalk, which bears whorls of branching hairs. The single diploid nucleus resides in the rhizoid.
Francesca Gottschalk - How can education support child empowerment.pptxEduSkills OECD
Francesca Gottschalk from the OECD’s Centre for Educational Research and Innovation presents at the Ask an Expert Webinar: How can education support child empowerment?
Welcome to TechSoup New Member Orientation and Q&A (May 2024).pdfTechSoup
In this webinar you will learn how your organization can access TechSoup's wide variety of product discount and donation programs. From hardware to software, we'll give you a tour of the tools available to help your nonprofit with productivity, collaboration, financial management, donor tracking, security, and more.
Embracing GenAI - A Strategic ImperativePeter Windle
Artificial Intelligence (AI) technologies such as Generative AI, Image Generators and Large Language Models have had a dramatic impact on teaching, learning and assessment over the past 18 months. The most immediate threat AI posed was to Academic Integrity with Higher Education Institutes (HEIs) focusing their efforts on combating the use of GenAI in assessment. Guidelines were developed for staff and students, policies put in place too. Innovative educators have forged paths in the use of Generative AI for teaching, learning and assessments leading to pockets of transformation springing up across HEIs, often with little or no top-down guidance, support or direction.
This Gasta posits a strategic approach to integrating AI into HEIs to prepare staff, students and the curriculum for an evolving world and workplace. We will highlight the advantages of working with these technologies beyond the realm of teaching, learning and assessment by considering prompt engineering skills, industry impact, curriculum changes, and the need for staff upskilling. In contrast, not engaging strategically with Generative AI poses risks, including falling behind peers, missed opportunities and failing to ensure our graduates remain employable. The rapid evolution of AI technologies necessitates a proactive and strategic approach if we are to remain relevant.
The French Revolution, which began in 1789, was a period of radical social and political upheaval in France. It marked the decline of absolute monarchies, the rise of secular and democratic republics, and the eventual rise of Napoleon Bonaparte. This revolutionary period is crucial in understanding the transition from feudalism to modernity in Europe.
For more information, visit-www.vavaclasses.com
Model Attribute Check Company Auto PropertyCeline George
In Odoo, the multi-company feature allows you to manage multiple companies within a single Odoo database instance. Each company can have its own configurations while still sharing common resources such as products, customers, and suppliers.
2024.06.01 Introducing a competency framework for languag learning materials ...Sandy Millin
http://sandymillin.wordpress.com/iateflwebinar2024
Published classroom materials form the basis of syllabuses, drive teacher professional development, and have a potentially huge influence on learners, teachers and education systems. All teachers also create their own materials, whether a few sentences on a blackboard, a highly-structured fully-realised online course, or anything in between. Despite this, the knowledge and skills needed to create effective language learning materials are rarely part of teacher training, and are mostly learnt by trial and error.
Knowledge and skills frameworks, generally called competency frameworks, for ELT teachers, trainers and managers have existed for a few years now. However, until I created one for my MA dissertation, there wasn’t one drawing together what we need to know and do to be able to effectively produce language learning materials.
This webinar will introduce you to my framework, highlighting the key competencies I identified from my research. It will also show how anybody involved in language teaching (any language, not just English!), teacher training, managing schools or developing language learning materials can benefit from using the framework.
Biological screening of herbal drugs: Introduction and Need for
Phyto-Pharmacological Screening, New Strategies for evaluating
Natural Products, In vitro evaluation techniques for Antioxidants, Antimicrobial and Anticancer drugs. In vivo evaluation techniques
for Anti-inflammatory, Antiulcer, Anticancer, Wound healing, Antidiabetic, Hepatoprotective, Cardio protective, Diuretics and
Antifertility, Toxicity studies as per OECD guidelines
Palestine last event orientationfvgnh .pptxRaedMohamed3
An EFL lesson about the current events in Palestine. It is intended to be for intermediate students who wish to increase their listening skills through a short lesson in power point.
Study the emission of spectroscopy of low pressure gas( hydrogen ).
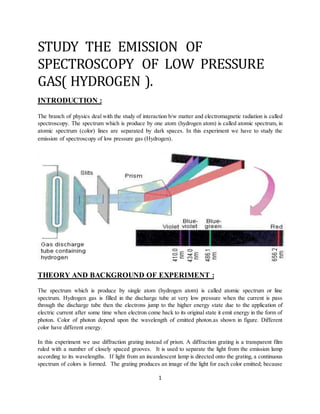
1. 1
STUDY THE EMISSION OF
SPECTROSCOPY OF LOW PRESSURE
GAS( HYDROGEN ).
INTRODUCTION :
The branch of physics deal with the study of interaction b/w matter and electromagnetic radiation is called
spectroscopy. The spectrum which is produce by one atom (hydrogen atom) is called atomic spectrum, in
atomic spectrum (color) lines are separated by dark spaces. In this experiment we have to study the
emission of spectroscopy of low pressure gas (Hydrogen).
THEORY AND BACKGROUND OF EXPERIMENT :
The spectrum which is produce by single atom (hydrogen atom) is called atomic spectrum or line
spectrum. Hydrogen gas is filled in the discharge tube at very low pressure when the current is pass
through the discharge tube then the electrons jump to the higher energy state due to the application of
electric current after some time when electron come back to its original state it emit energy in the form of
photon. Color of photon depend upon the wavelength of emitted photon.as shown in figure. Different
color have different energy.
In this experiment we use diffraction grating instead of prism. A diffraction grating is a transparent film
ruled with a number of closely spaced grooves. It is used to separate the light from the emission lamp
according to its wavelengths. If light from an incandescent lamp is directed onto the grating, a continuous
spectrum of colors is formed. The grating produces an image of the light for each color emitted; because
2. 2
all colors are emitted, these images blur together and appear as a continuous band (like a rainbow). When
a hydrogen lamp is viewed through the grating, only three images of the light will appear, each in a
different color. These correspond to the individual emission lines of the Balmer series, each with a
different wavelength. Because they are separated in space, the images appear distinct. The wavelengths
of these emission lines are determined by the diffraction equation.
Where d is the separation between the grooves on the grating, and the angle θ is determined by the
geometry of the schematic as shown above. Measurements of the distances shown will provide the angle
θ, because tan θ = b/a.
As indicated above, the emission spectra of hydrogen atoms and “hydrogen-like” (one electron) ions
consist of a set of individual “lines” of specific wavelengths. The numerical values of the wavelengths of
these lines fit a particular mathematical pattern called a series. Rydberg determined that the equation
Could reproduce the pattern observed by Balmer for hydrogen. RH is the Rydberg constant, RH =
1.09737 x 10⁷ m-1, and m and n are positive integers. In the Balmer series, m = 2 and n > m.
In 1905, Albert Einstein proposed that light was composed of bundles of energy called photons. Each
photon of light contains an energy, Ephoton, given by the relationship:
3. 3
Where ν is the frequency in s-1 and λ is the wavelength in meters. The constants are Planck’s constant, h
= 6.6261 x 10ˉ34 J·s, and the speed of light, c = 2.9979 x 10⁸ m/s. So, once you have determined the
wavelengths of your emission lines, you can calculate the energies, Ephoton,of the photons that are emitted.
But Einstein’s picture of the nature of light occurring in photons did not answer the question as to how the
photons of light were produced. In 1913, the Danish physicist, Niels Bohr, proposed the quantum model
for the hydrogen atom. In Bohr’s model, the electron can only exist in certain energy levels given by the
equation:
Where n is an integer known as the quantum number for that particular energy level and 2.17 x 10⁻¹⁸ J is
the Bohr Model unit of energy.
DISCUSSION OF APPARATUS :
Diffraction grating
o It consist of number of slits align with the same distance. As we know when light passes
through the slit it diffract the same phenomena occur hare. When light from hydrogen
lamp pass through the diffraction grating it (split) diffract in to three different color lines,
due to having different frequency and wavelength.
Hydrogen gas lamp
o Is use to produce the light when current pass through it.
Spectrometer
o It consist of colorimeter, telescope, and circular scale. Is is use to determine the distance,
angle and wavelength of diffracted light.
PROCEDURE :
o Record all readings, to the proper number of significant figures and with appropriate units, in the
Data Section.
o Make sure that the lamp is centered at 100 cm on the front rail track. Check that the diffraction
grating is centered at 100 cm on the back rail track. Check that the two rail tracks are 50 cm apart
at both ends.
o Turn off the overhead room lights; light from adjacent rooms should be sufficient. Look at the
images on the diffraction grating. Three visible lines should be present. Using your line of sight,
align the red line emission with the marker on the center of the diffraction grating. Move the
needle indicator on the front rail track to be in line with the emission line. Measure the distance of
the needle indicator from the lamp.
o Repeat for the Blue-Green and Violet lines.
4. 4
CALCULATION :
o Diffraction Grating Ruling ____600_____ lines / mm
o Number of separations/mm in diffraction grating ____________
o Calculate width of one separation, d, in nm ____________
o Lamp position along front rail track ____100.0 cm__
o Positions of images along front rail track red ____________
o blue-green ____________
o violet ____________
o Distance from front rail track to grating, a ____50.0 cm__
These all calculation is done by using formulas that are given bellow :
o Use to determine the distance d.
o Use to determine the wave length of spectrum color.
o This is use to determine the energy of different colors.
o Furthermore if we want to determine the frequency of different color we use this formula
RESULT ANALYS :
When we start our experiment we say that atomic spectrum is a line spectrum and is form by using single
atom when we conduct the experiment we observed that yes the spectrum that we get from the hydrogen
gas is the (line spectrum) atomic spectrum. We clearly observed that color lines are separated by dark
space. And the further by using apparatus we determent the wavelength and energy of different color, and
we also observed from this experiment different color have different wavelength and energy. Which is our
aim of experiment.