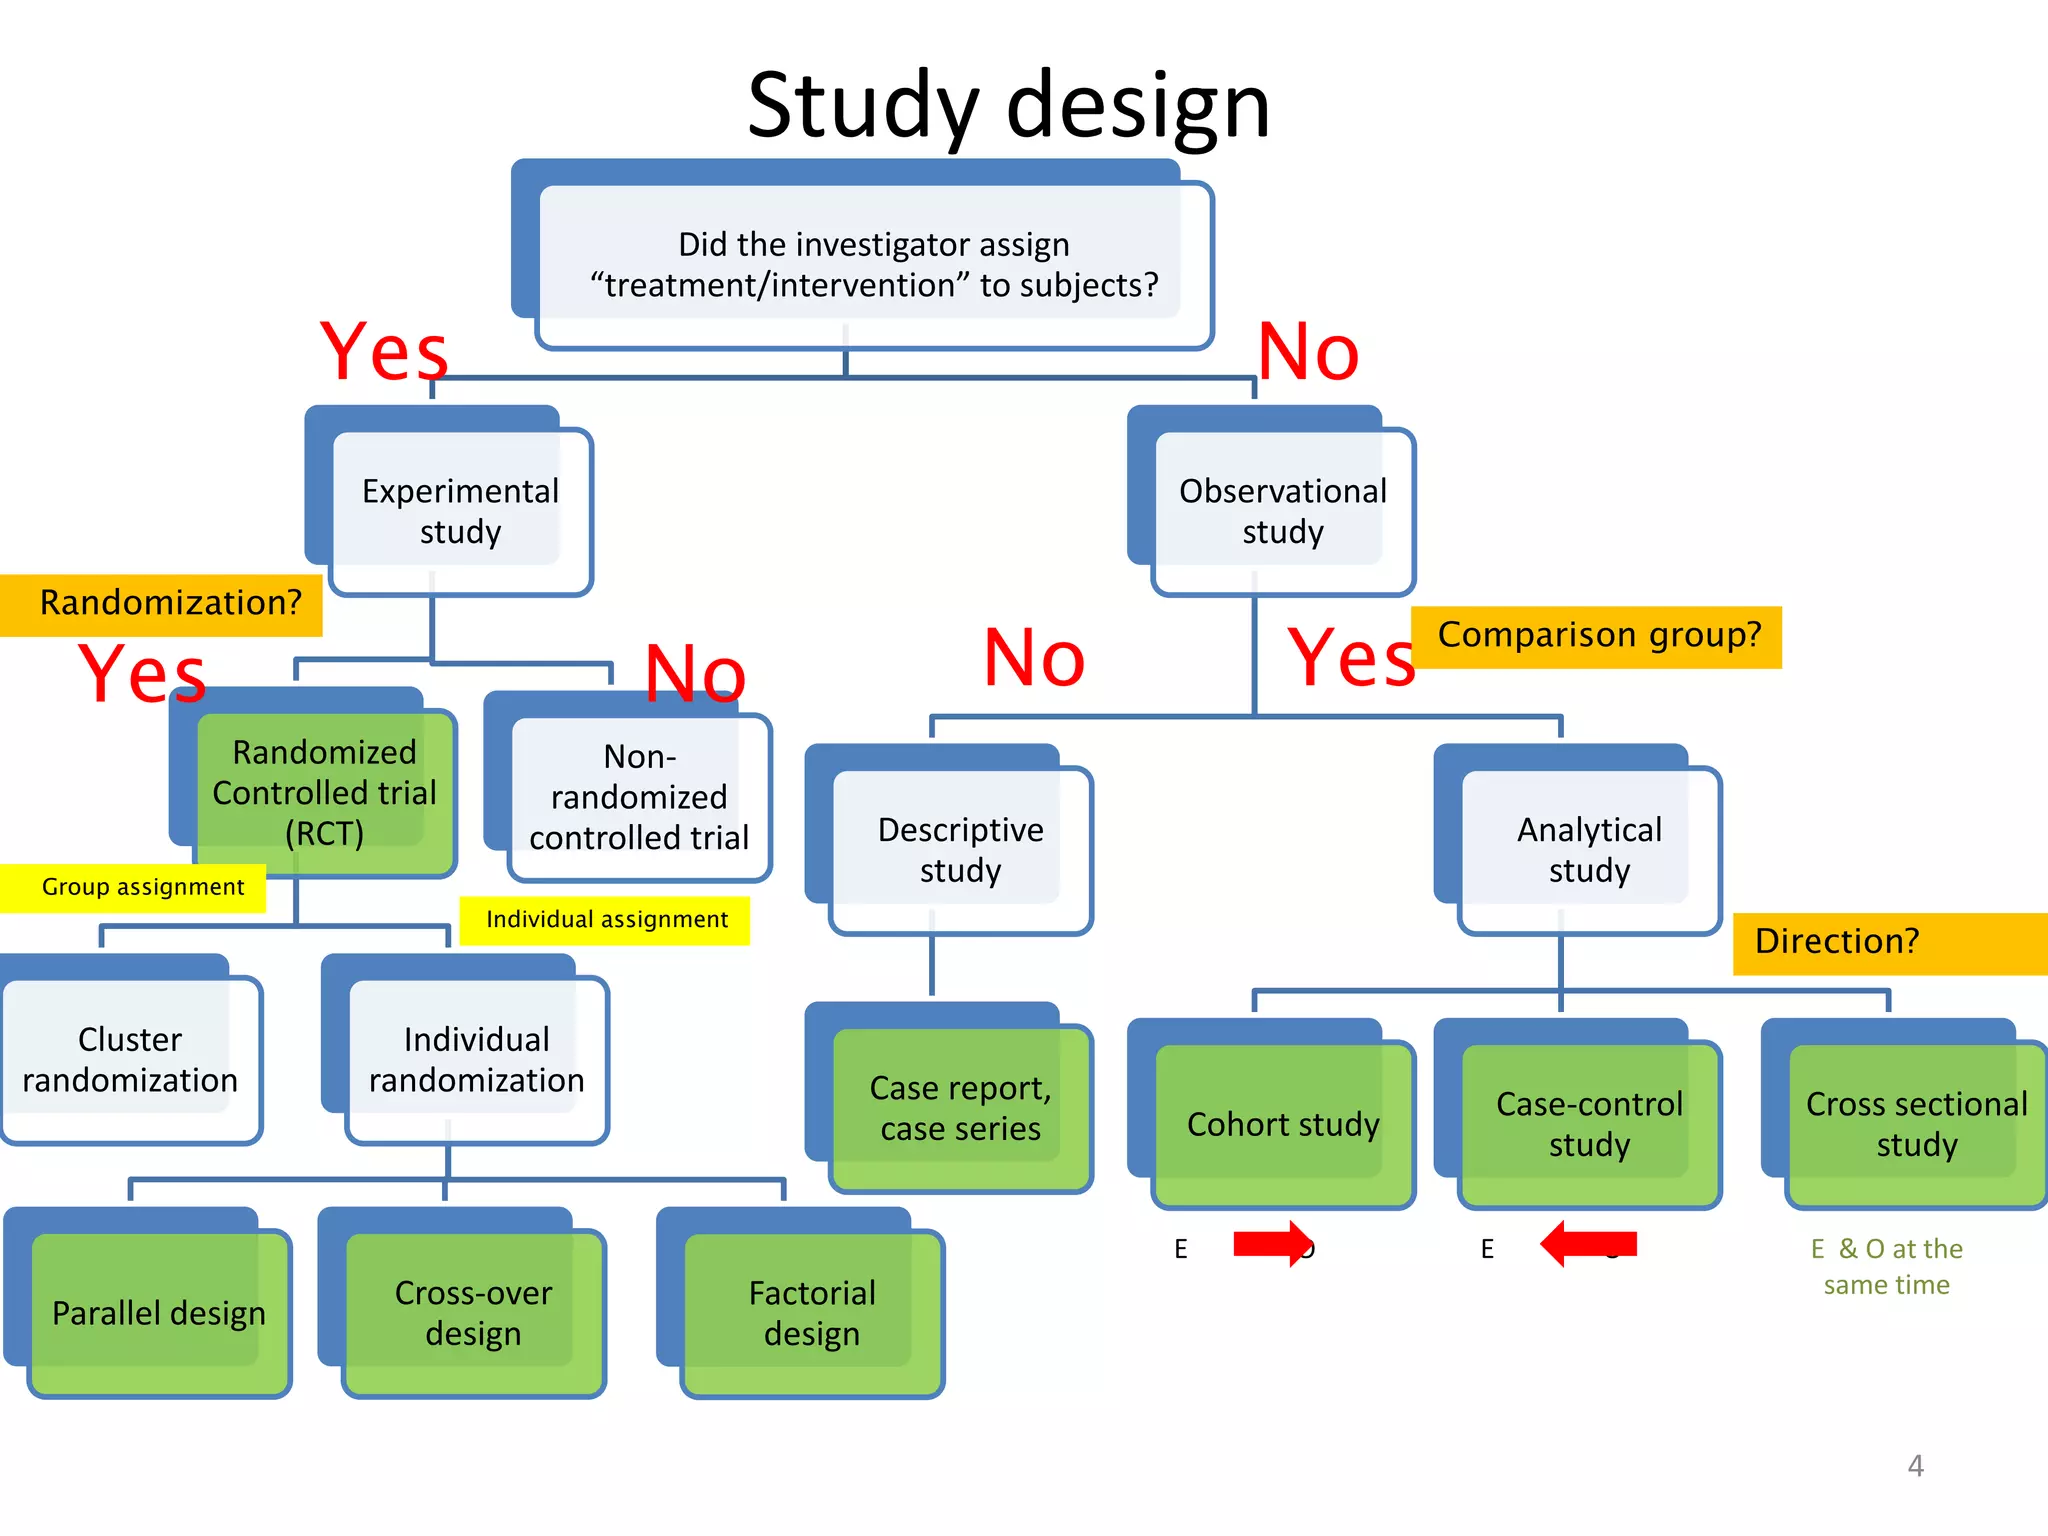
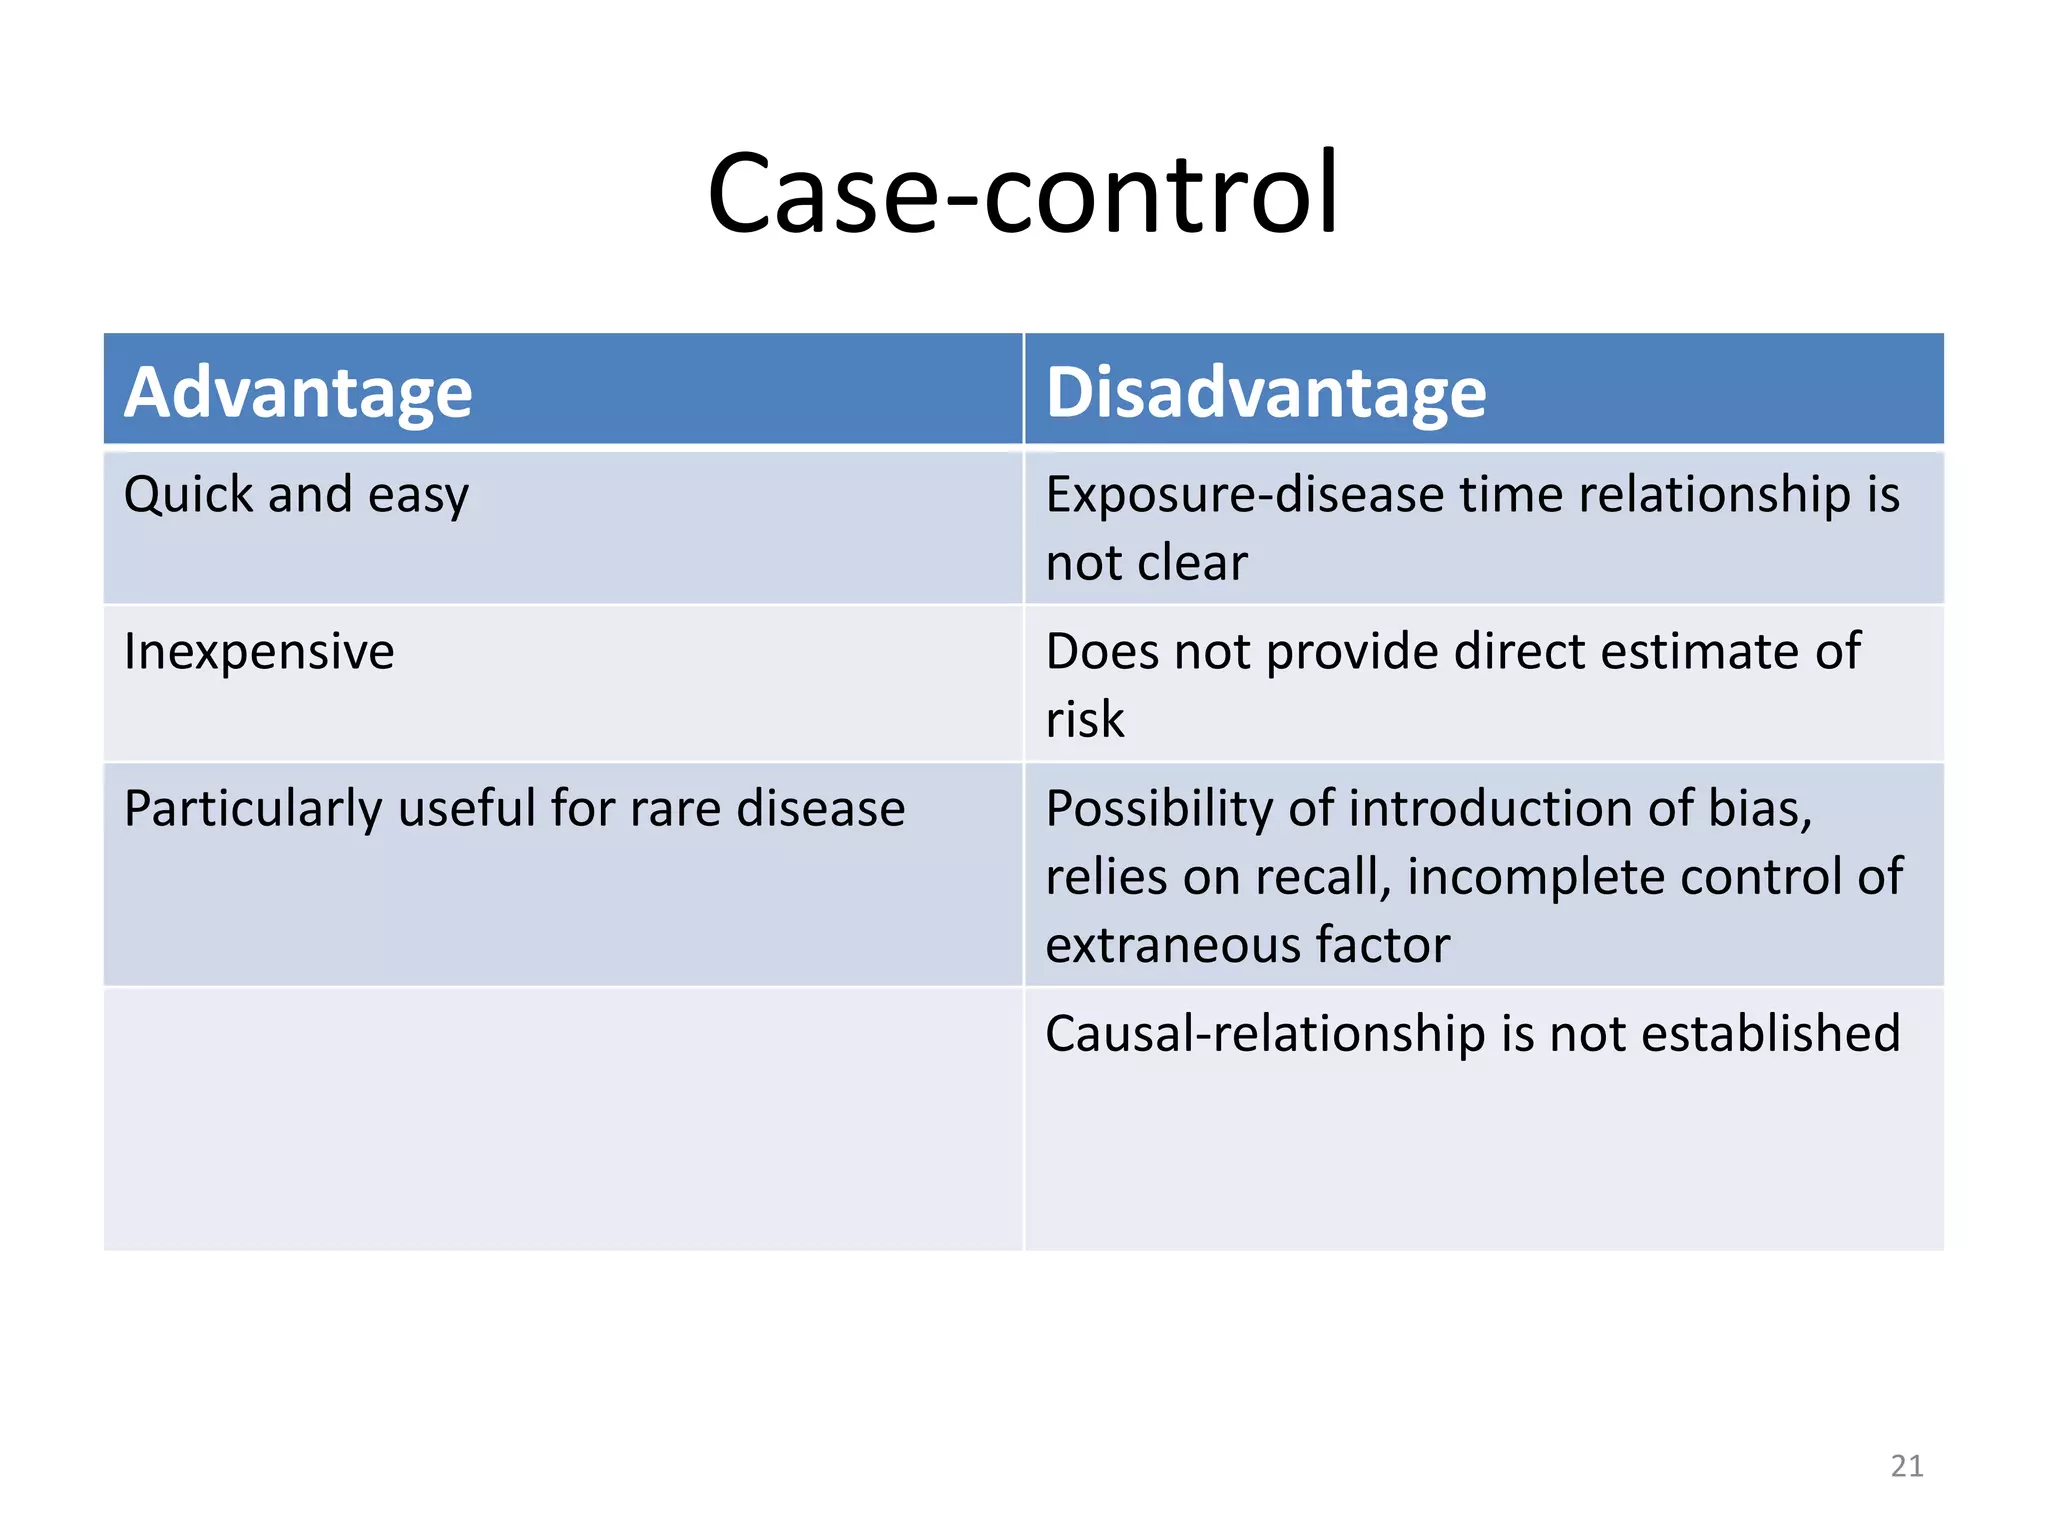
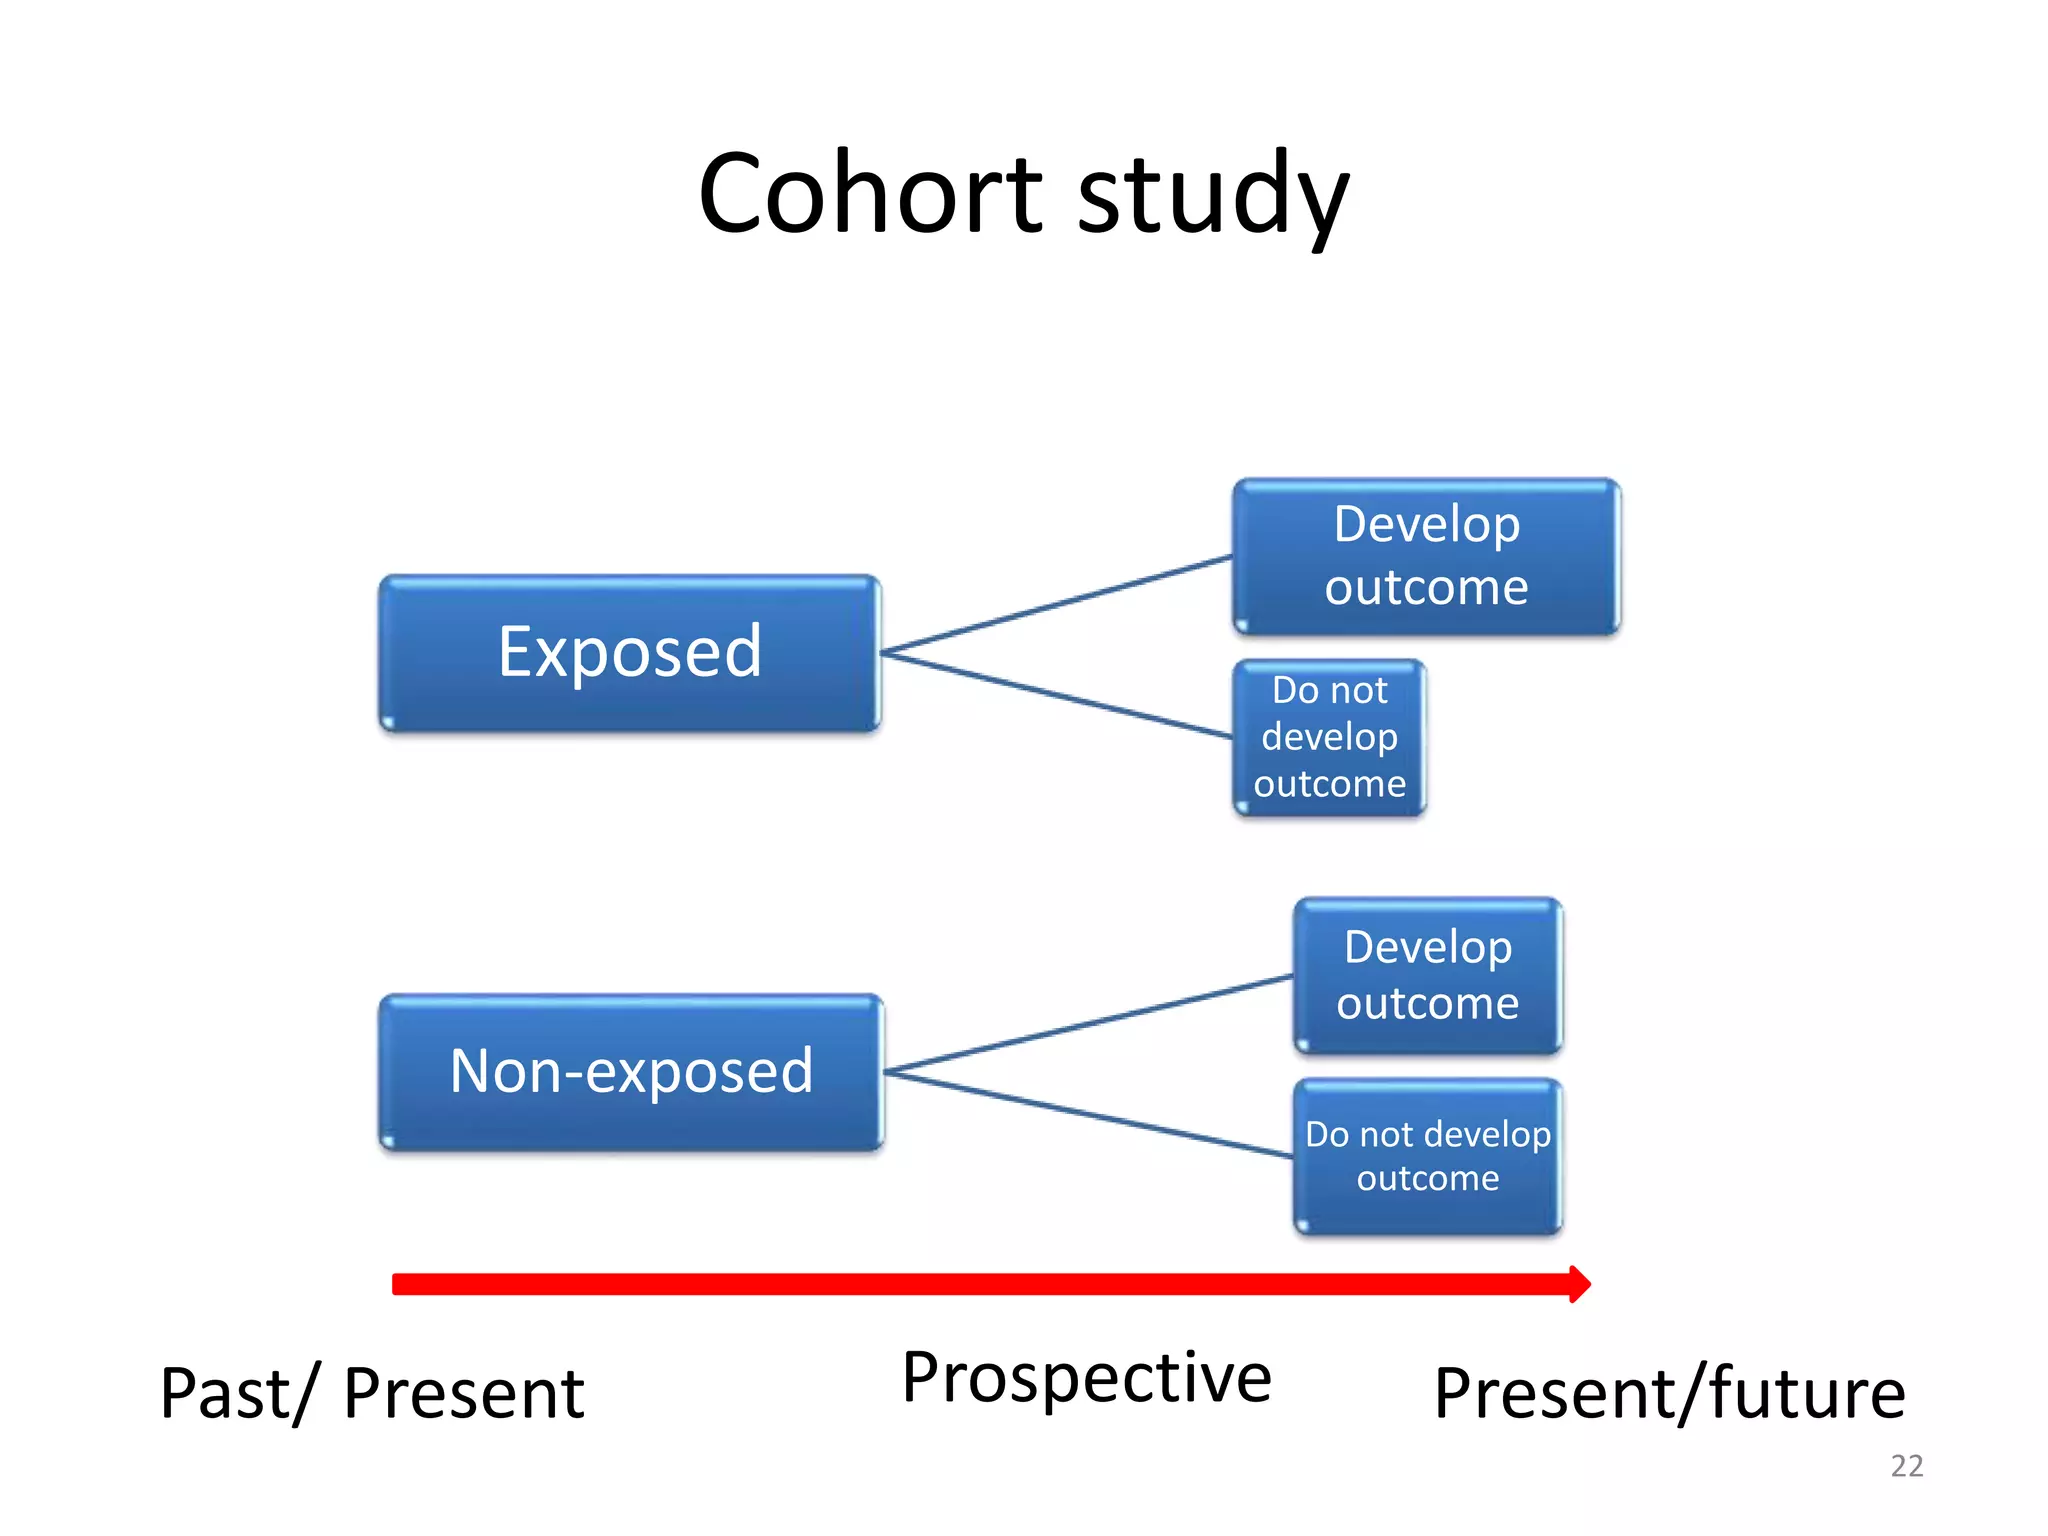
Study design used in
Pharmacoepidemiology
สอนโดย อ.กมลวรรณ ตันติพิวัฒนสกุล
ได้รับการสนับสนุนจาก อ.มนทรัตม์ ถาวรเจริญทรัพย์ 1
1. Study design used in Pharmacoepidemiology
Example: Vitamin C and Common cold
1. Observational study
1. Case report/ case series
2. Ecological study
3. Cross-sectional study
4. Case control study
5. Cohort study
2. Experimental study
1. Randomized clinical trial (RCT)
1. Parallel design
2. Cross-over design
3. Factorial design
2. Cluster randomized trial
Outline
2
Pharmaco Epidemiology
Pharmaco-
epidemiology
What is “Pharmacoepidemiology”?
Pharmacoepidemiology:
• The application of epidemiological principles and
methods to the study of drug effects in human population.
• The study of the use of and the effects of drugs in large
number of people.
• A new science that uses principles of epidemiology in
quantifying adverse drug events, pattern of drug use, and
drug efficacy in a large population.
Pharm World Sci, 1995; 17(3);61-65.
Strom BL, Pharmacoepidemiolgy 3rd Edition, 2001
J clin pharmacol 2006; 46; 6-9
Did the investigator assign
“treatment/intervention” to subjects?
Experimental
study
Randomized
Controlled trial
(RCT)
Cluster
randomization
Individual
randomization
Parallel design
Cross-over
design
Factorial
design
Non-
randomized
controlled trial
Observational
study
Descriptive
study
Case report,
case series
Analytical
study
Cohort study
Case-control
study
Cross sectional
study
Study design
Yes No
Randomization?
Yes No
Comparison group?
YesNo
Direction?
E O E O E & O at the
same time
Individual assignment
Group assignment
4
•Systematic review / Meta analysis of RCT studies
RCT
study
Cohort study
Case control study
Cross-sectional study
Case report,
Case series
Expert opinion
Level of evidenceHig
h
Low
5
Non-experimental study Experimental study
Few ethical constraint Ethical constraint
Easier to recruit and enroll
subjects
Harder to recruit, enroll
and follow subjects
Can be relatively quick May take long time
Less expensive Expensive
Lack of control of
confounding / Prone to
bias
Clearer interpretation of
causal relationship
Comparing Non-experimental VS
Experimental design
6
 Case report:
◦ Case report is simply report of single patient.
◦ A case report describes a single patients who was
exposed to a drug and experiences a particular,
usually adverse outcome.
 Case series:
◦ Case series are collections of patients, all of whom have a
single exposure, whose clinical outcome are then evaluated
and described.
◦ Alternatively, case series can be collections of patients with
a single outcome, looking at their antecedent exposures.
 Observe 100 women aged less than 50 years old, who
suffer from a pulmonary embolism, and note that 30 of
them had been taking oral contraceptive
Case report/ case series
7
Advantage Disadvantage
Cheap and easy method
for generating hypothesis
No control group
No control over
confounding
Cannot be used for
proven-causal-effect
relationship
Case report/ case series
8
Ecological study
Ecological study (Analyses of secular trends)
• examine trends in an exposure that is a presumed
cause and trends in a disease that is presumed
effect and test whether the trends coincide.
• This trends can be examined over time or across
geographic boundaries .
– analyze data from a single region and examine
how it changes over time,
– analyze data from a single time period and
compare how the data differ from region to
region.
Ecological study
Situation: The unit of analysis is a
group, the number of exposed persons
and the number of cases is known for
each group, but the number of exposed
cases is not known.
Warning! The ecologic fallacy. Results
from making a causal inference about
an individual phenomenon or process of
the observation of groups.
Defined population
Exposed; have
disease
(outcome)
Exposed; do not
have disease
(outcome)
Not Exposed;
have disease
(outcome)
Not Exposed; Do
not have disease
(outcome)
Cross-sectional study
11
Gather data on Exposure and Disease
Cross-sectional study examines the relationship between
disease/outcome and other variables of interest as their
exists in a defined population at 1 particular time.
In Cross-sectional study, study population are commonly
selected without
regard to exposure or disease status
Outcome status
Yes No
Exposure
status
Exposed A B A+B
Non-
exposed
C D C+D
A+C B+D A+B+C+D = N
2 X 2 Table:
12
Case-control study
c
o
h
o
r
t
s
t
u
d
y
Cross-sectional
study
Outcome status
Yes No
Exposure
status
Exposed A B A+B
Non-
exposed
C D C+D
A+C B+D A+B+C+D = N
2 X 2 Table: Cross sectional study
13
Cross-sectional
study
Calculation:
Prevalence of outcome in person with
exposure: A/(A+B)
Prevalence of outcome in person without
exposure: C/(C+D)
Muscular complaint
Yes No
Exposure
status
Lipid-
lowering
Drug
(LLD)
106 133 239
No lipid-
lowering
Drug
305 487 792
411 1031
2 X 2 Table: Cross sectional study
14
Cross-sectional
study
Calculation:
Prevalence of muscular complaint in person using
LLD: 106/239
Prevalence of muscular complaint in person not using
LLD: 305/792
Advantage Disadvantage
Permit determination of various
characteristic of a population
Not useful for rare disease or disease
with short duration
Generate hypothesis for exposure-
disease relationship
Not infer temporal sequence
between exposure and disease
Example:
Cigarette and infertility
Diazepam and stress
Cheap and easy to conduct Cause-effect relationship is tenuous
Cross-sectional study
15
Case
Exposed
Non -
exposed
Case control study
16
Control
Exposed
Non-
exposed
PresentPast Retrospective
 Study that compare cases with the disease to control without the
disease, looking for differences in antecedent exposure. (Retrospective)
 Sources of cases: Ideally- all incident cases in a defined
population in a specified time period.
 Source of case identified: National health survey, specific
reporting systems (cancer registry, birth defect registry)
 Specific criteria based on a combination of sign and symptoms
◦ MI: Criteria A = Chest pain
 “Silent heart attack” was excluded
 People with other condition that produce chest pain was
mistakenly included.
 Prevalent VS incident case: study cause of disease one prefer
incident case because they usually interested in factors that
lead to developing of disease rather than factors that affecting
the duration of disease.
Selection of case
Source of controls: Ideally- should have the
same characteristics as the cases except for
the exposure of interest.
Source of controls: Population control,
hospital control, friends, family, spouse. Etc.
Selection of control
• Source of exposure: Interview, self-administered
questionnaire, pharmacy data, etc.
– Information about exposure must be accurate
– Information on dose and duration is important!
– The definition of exposure must be appropriate for causal
inference
• “Ever used” as exposed might not be accurate
Exposure identification
19
Outcome status
Yes No
Exposure
status
Exposed A B A+B
Non-
exposed
C D C+D
A+C B+D A+B+C+D
Example: 2 X 2 Table (case-control)
20
Case-control study
Measure of association
Odd ratio (OR) = AD/BC
Advantage Disadvantage
Quick and easy Exposure-disease time relationship is
not clear
Inexpensive Does not provide direct estimate of
risk
Particularly useful for rare disease Possibility of introduction of bias,
relies on recall, incomplete control of
extraneous factor
Causal-relationship is not established
Case-control
21
Exposed
Develop
outcome
Do not
develop
outcome
Cohort study
22
Non-exposed
Develop
outcome
Do not develop
outcome
Present/futurePast/ Present Prospective
Past Present Future
Prospective
Cohort
Retrospective
Cohort
Cohort: Direction and timing
23
Study
begins
Study
begins
Both prospective cohort and retrospective
cohort is prospective study!
Outcome status
Yes No
Exposure
status
Exposed A B A+B
Non-
exposed
C D C+D
A+C B+D A+B+C+D
2 X 2 Table: Cohort study
24
c
o
h
o
r
t
s
t
u
d
y
Relative Risk (RR) = A/ (A+B)
C/(C+D)
Risk difference (RD) = A/(A+B) – C/(C+D)
NNT = 1/RD
Measure of association
Advantage Disadvantage
Direct determination of risk Take long time
Strong evidence of exposure-
disease association
Difficult to implement and carry out
Can study rare exposure Expensive
Chance of loss to follow-up
Change in exposure status may occur
Need large sample to study rare disease
High chance of confounding especially
confounding by indication
Cohort study
25
Experimental group
Develop
outcome
No
outcome
RCT study
26
Control group
Develop
outcome
No
outcome
futurePresent Prospective
R*
* Randomization
Population
Exposed Unexposed
Cohort VS RCT
27
Population
Exposed Unexposed
Not randomly allocated
(e.g. self selected)
Randomly allocated/
Randomization
Type Characteristic
Parallel VS
Crossover
Parallel: Each group receive one
treatment. Treatments are administered
concurrently
Crossover: Each group receive all
treatment one after another. Treatments
order differs for each group. Washout
period may intervene between
treatment.
Simple VS
factorial
Simple: Each group gets one treatment
Factorial: Each group gets two or more
treatments
Parallel VS Crossover VS Factorial
28
Randomization
Experimental
Outcome
No outcome
Control
Outcome
No outcome
Parallel VS crossover design
29
Randomization
Experimental Control
Outcome
No outcome
Control Experimental
Outcome
No outcome
Washout
Washout
Phase I Phase II
Parallel design
Crossover design
HIV-Infected
Yes No
Exposure
status
Zidovudine 9 141 150
Placebo 31 118 149
Example:2 X 2 Table (RCT)
30
R
C
T
s
t
u
d
y
RR Zidovudine VS Placebo = (9/150) / (31/149)
Adapted from N Eng J Med 1994:331:1173-1180
Example: crossover design
31
Randomization
(N = 16)
Fish oil
(N =8)
Placebo
Outcome
No outcome
Placebo
(N =8)
Fish oil
Outcome
No outcome
Washout
(2 weeks)
Washout
Phase I (3 weeks) Phase II( 3 weeks)
Parallel Crossover
Each group receive only
one treatment.
(Randomization of
treatment group)
Each group receive both
treatment but in different
order (Randomization of
sequence)
Many situations can only
be studied in parallel such
as fatal outcome
Cannot studied some
outcomes such as fatal
outcome
Typically need large N Can have fewer subjects
and be convincing
Dropout reduce power but Dropout reduces power
Parallel VS Crossover
32
Factorial design: Example
33
Male , smoker, aged 50-69
years
- Tocopheral 50
mg
-carotene 20 mg
- Tocopheral 50 mg +
-carotene 20 mg
Placebo
Objective: to analyse effect -Tocopheral and
-carotene of and on incidence of cancer and
mortality
R
GR
1
GR
2
GR
3
GR
4
Outcome status
Yes No
Exposure
status
Exposed A B A+B
Non-
exposed
C D C+D
A+C B+D A+B+C+D
2 X 2 Table: RCT
34
R
C
T
s
t
u
d
y
Measure of association
Relative Risk (RR) = A/ (A+B)
C/(C+D)
Risk difference (RD) = A/(A+B) – C/(C+D)
NNT = 1/RD
• Cluster randomized trials are experiments in
which social units or clusters rather than
individuals are randomly allocated to
intervention groups
35
Cluster randomization study
Example: Cluster randomization study
Ethics in experimental study
• Uncertainty in experimental study
– Can’t give a harmful therapy to treatment group.
– There should be a reasonable chance that the
benefits outweigh potential risks.
– Can’t withhold a beneficial treatment from control
group. (Use a “standard care” control group as an
alternative)
• Informed consent
• Monitoring boards
Informed consent
• Participants should understand:
– Type of study
– What is requested?
– Risks and benefits
– The concept of randomization and blinding
– The right to withdraw
– The right to be informed of relevant findings
Randomization
Concept: All individual have same and independent
chance of being allocated to any of the treatment
groups; produces comparable groups. However,
allocation ratios may vary (1:1, 1:2, 1:3).
Goal:
• To prevent bias related to selection.
• Balances treatment group on known and unknown
characteristics (minimized confounding)
Randomization
Desirable properties of randomization method
• Ease of implementation
• Small imbalance in sample size
Difficult to guess next assignment
The following is not examples of randomization:
• Assigning every other patient to treatment A and others to B.
• Assigning equal numbers to treatments A and B based on
what is best for patient.
• Assigning A to patients recruited from one source and B to
patients from another source.
• Basic concept: Coin tossing
(e.g. Head = A, Tail = B) but clumsy and
time consuming!
• Using table of random digit (0-9). Each
digit occurs on average the same number
of times, there is no discernible pattern of
digit values and the table present digits in
pairs merely to help the user in scanning
across the page.
Simple randomization
 For 2 treatments (1:1) assign A for digits 0-4
B for digits 5-9
Hence the numbers in the top row of table
0 5 2 7 8 4 3 7 4 1 6 8 3 8 5 1 5 6 9 6
produce a list:
A B A B B A A B A A B B A B B A B B B B
 For 3 treatments (1:1:1) assign A for digits 1-3
B for digits 4-6
C for digits 7-9
and ignore 0
produce a list:
 For 2 treatments (2:1) : How?
Simple randomization
The advantage: Simple, each treatment
assignment is completely unpredictable, the
probability theory guarantees that in the long
run the numbers of patients on each
treatment will not be radically different.
The disadvantage: High chance of imbalance
in small trial.
Simple randomization
Random Permuted Blocks
• Suppose we have T treatments, then for each block of
kT patients we produce a different random ordering of k
assignments to each treatment.
– For 2 treatments, blocks of 2 patients assign
AB for digits 0-4
BA for digit 5-9
Then, the numbers 0 5 2 7 8
AB BA AB BA BA
Block randomization
 For 3 treatments, blocks of three patients
 ABC for Digit 1
 ACB for Digit 2
 BAC for Digit 3
 BCA for Digit 4
 CAB for Digit 5
 CBA for Digit 6
 Ignore 0 and 7-9
◦ So, the number 0 5 2 7 8 4
Produce list - CAB ACB - - BCA
Block randomization
 Disadvantage: At the end of each block, a clinician who
keeps track of previous assignments could predict what
the next treatment would be. If the block size is large ,
the serious mid-block inequality might occur.
◦ Example: Block size of 4 if the first three patient
received A, B, and B then the 4th patient will receive A.
Block randomization
 Unblinded = Open trial
 Blinding: the treatment assignment is not known to
certain persons.
◦ Single-blinded study, the treatment assignment is
unknown to the patients
◦ Double-blinded study, the treatment assignment is
unknown either to the patients or to their physicians
◦ Triple-blinded study, the treatment assignment is
unknown to the patient, the physician, and the
committee monitoring response
Blinding
Goal: Prevention of bias (often in outcome assessment)
Issues:
 Ethics, breaking the blind
 Difficulty blinding some treatment
◦ Drug with side effects: estrogen and bleeding
◦ Lifestyle changes, surgery procedure
◦ Assess the blinding whether the blinding still
remains.
Blinding
• Matched placebo: identical in all respects to the active oral
drug except that the active ingredients is absent.
Particular features requiring matching are the colour,
taste, texture, shape, size.
• Double dummy: When 2 or more active drugs are being
compared.Double dummy may be the option: Each active
ingredient has a placebo identical to it. Each patient would
take one active and one placebo pills. (Not reasonable
when several active drugs are being compared.)
Blinding
 Drug A (b.i.d.) vs Placebo: How?
 Different dose schedule: How?
A = new drug (sustained release) 100 mg o.d, B =
conventional drug 100 mg t.i.d.
Put in identical capsule: new drug, conventional, and placebo: then take
tid in both group. Or using double dummy;
Breakfast Lunch Evening
 Gr A Real A
B dummy B dummy B dummy
 Gr B A dummy
Real B Real B Real B
Blinding
Systematic review
• Systematic review: is a summary of the medical
literature that
– Use explicit methods
– Is based on a through literature search
– Performs a critical appraisal of individual studies
– Synthesize the world literature on a specific issue
– Use statistical techniques to combine data from valid
studies (meta-analyses)
• Systematic review may or may not include
meta-analysis
• Sackett DL, Strauss, S.E., Richardson, W. et.al. Evidence based medicine: How to
practice and teach evidence based medicine” London” Churchill-Livingstone.2002.
Why systematic review?
• Expanding volume of published literature
• Different or controversial results from
studies of the same topic
Systematic review VS Narrative
review
Narrative Systematic
Informal and subjective methods to
collect and interpret studies
Formal and objective method to collect
and synthesis the result from studies
Not always conduct in extensive
search
Extensive search
Rarely explicit about how they select
the study. Tend to be selective in
citing reports that reinforce their
preconceived ideas
Using explicit method with clear and
reproducible eligibility criteria to select
the study for review
Less rigorous critical appraisal Rigorous critical appraisal
High risk of bias Minimal bias
Meta-analysis
• Meta-analysis: “.. A quantitative
approach for systematically combining
the results of previous research in order
to arrive at conclusion about the body of
research.
• Petitti D.B., Meta analysis, decision analysis, and cost-effectiveness analysis. New York: Oxford
University Press, 1994.
Thank you for your attention
55

Study design used in pharmacoepidemiology

  • 1.
    Study design usedin Pharmacoepidemiology สอนโดย อ.กมลวรรณ ตันติพิวัฒนสกุล ได้รับการสนับสนุนจาก อ.มนทรัตม์ ถาวรเจริญทรัพย์ 1
  • 2.
    1. Study designused in Pharmacoepidemiology Example: Vitamin C and Common cold 1. Observational study 1. Case report/ case series 2. Ecological study 3. Cross-sectional study 4. Case control study 5. Cohort study 2. Experimental study 1. Randomized clinical trial (RCT) 1. Parallel design 2. Cross-over design 3. Factorial design 2. Cluster randomized trial Outline 2
  • 3.
    Pharmaco Epidemiology Pharmaco- epidemiology What is“Pharmacoepidemiology”? Pharmacoepidemiology: • The application of epidemiological principles and methods to the study of drug effects in human population. • The study of the use of and the effects of drugs in large number of people. • A new science that uses principles of epidemiology in quantifying adverse drug events, pattern of drug use, and drug efficacy in a large population. Pharm World Sci, 1995; 17(3);61-65. Strom BL, Pharmacoepidemiolgy 3rd Edition, 2001 J clin pharmacol 2006; 46; 6-9
  • 4.
    Did the investigatorassign “treatment/intervention” to subjects? Experimental study Randomized Controlled trial (RCT) Cluster randomization Individual randomization Parallel design Cross-over design Factorial design Non- randomized controlled trial Observational study Descriptive study Case report, case series Analytical study Cohort study Case-control study Cross sectional study Study design Yes No Randomization? Yes No Comparison group? YesNo Direction? E O E O E & O at the same time Individual assignment Group assignment 4
  • 5.
    •Systematic review /Meta analysis of RCT studies RCT study Cohort study Case control study Cross-sectional study Case report, Case series Expert opinion Level of evidenceHig h Low 5
  • 6.
    Non-experimental study Experimentalstudy Few ethical constraint Ethical constraint Easier to recruit and enroll subjects Harder to recruit, enroll and follow subjects Can be relatively quick May take long time Less expensive Expensive Lack of control of confounding / Prone to bias Clearer interpretation of causal relationship Comparing Non-experimental VS Experimental design 6
  • 7.
     Case report: ◦Case report is simply report of single patient. ◦ A case report describes a single patients who was exposed to a drug and experiences a particular, usually adverse outcome.  Case series: ◦ Case series are collections of patients, all of whom have a single exposure, whose clinical outcome are then evaluated and described. ◦ Alternatively, case series can be collections of patients with a single outcome, looking at their antecedent exposures.  Observe 100 women aged less than 50 years old, who suffer from a pulmonary embolism, and note that 30 of them had been taking oral contraceptive Case report/ case series 7
  • 8.
    Advantage Disadvantage Cheap andeasy method for generating hypothesis No control group No control over confounding Cannot be used for proven-causal-effect relationship Case report/ case series 8
  • 9.
    Ecological study Ecological study(Analyses of secular trends) • examine trends in an exposure that is a presumed cause and trends in a disease that is presumed effect and test whether the trends coincide. • This trends can be examined over time or across geographic boundaries . – analyze data from a single region and examine how it changes over time, – analyze data from a single time period and compare how the data differ from region to region.
  • 10.
    Ecological study Situation: Theunit of analysis is a group, the number of exposed persons and the number of cases is known for each group, but the number of exposed cases is not known. Warning! The ecologic fallacy. Results from making a causal inference about an individual phenomenon or process of the observation of groups.
  • 11.
    Defined population Exposed; have disease (outcome) Exposed;do not have disease (outcome) Not Exposed; have disease (outcome) Not Exposed; Do not have disease (outcome) Cross-sectional study 11 Gather data on Exposure and Disease Cross-sectional study examines the relationship between disease/outcome and other variables of interest as their exists in a defined population at 1 particular time. In Cross-sectional study, study population are commonly selected without regard to exposure or disease status
  • 12.
    Outcome status Yes No Exposure status ExposedA B A+B Non- exposed C D C+D A+C B+D A+B+C+D = N 2 X 2 Table: 12 Case-control study c o h o r t s t u d y Cross-sectional study
  • 13.
    Outcome status Yes No Exposure status ExposedA B A+B Non- exposed C D C+D A+C B+D A+B+C+D = N 2 X 2 Table: Cross sectional study 13 Cross-sectional study Calculation: Prevalence of outcome in person with exposure: A/(A+B) Prevalence of outcome in person without exposure: C/(C+D)
  • 14.
    Muscular complaint Yes No Exposure status Lipid- lowering Drug (LLD) 106133 239 No lipid- lowering Drug 305 487 792 411 1031 2 X 2 Table: Cross sectional study 14 Cross-sectional study Calculation: Prevalence of muscular complaint in person using LLD: 106/239 Prevalence of muscular complaint in person not using LLD: 305/792
  • 15.
    Advantage Disadvantage Permit determinationof various characteristic of a population Not useful for rare disease or disease with short duration Generate hypothesis for exposure- disease relationship Not infer temporal sequence between exposure and disease Example: Cigarette and infertility Diazepam and stress Cheap and easy to conduct Cause-effect relationship is tenuous Cross-sectional study 15
  • 16.
    Case Exposed Non - exposed Case controlstudy 16 Control Exposed Non- exposed PresentPast Retrospective  Study that compare cases with the disease to control without the disease, looking for differences in antecedent exposure. (Retrospective)
  • 17.
     Sources ofcases: Ideally- all incident cases in a defined population in a specified time period.  Source of case identified: National health survey, specific reporting systems (cancer registry, birth defect registry)  Specific criteria based on a combination of sign and symptoms ◦ MI: Criteria A = Chest pain  “Silent heart attack” was excluded  People with other condition that produce chest pain was mistakenly included.  Prevalent VS incident case: study cause of disease one prefer incident case because they usually interested in factors that lead to developing of disease rather than factors that affecting the duration of disease. Selection of case
  • 18.
    Source of controls:Ideally- should have the same characteristics as the cases except for the exposure of interest. Source of controls: Population control, hospital control, friends, family, spouse. Etc. Selection of control
  • 19.
    • Source ofexposure: Interview, self-administered questionnaire, pharmacy data, etc. – Information about exposure must be accurate – Information on dose and duration is important! – The definition of exposure must be appropriate for causal inference • “Ever used” as exposed might not be accurate Exposure identification 19
  • 20.
    Outcome status Yes No Exposure status ExposedA B A+B Non- exposed C D C+D A+C B+D A+B+C+D Example: 2 X 2 Table (case-control) 20 Case-control study Measure of association Odd ratio (OR) = AD/BC
  • 21.
    Advantage Disadvantage Quick andeasy Exposure-disease time relationship is not clear Inexpensive Does not provide direct estimate of risk Particularly useful for rare disease Possibility of introduction of bias, relies on recall, incomplete control of extraneous factor Causal-relationship is not established Case-control 21
  • 22.
  • 23.
    Past Present Future Prospective Cohort Retrospective Cohort Cohort:Direction and timing 23 Study begins Study begins Both prospective cohort and retrospective cohort is prospective study!
  • 24.
    Outcome status Yes No Exposure status ExposedA B A+B Non- exposed C D C+D A+C B+D A+B+C+D 2 X 2 Table: Cohort study 24 c o h o r t s t u d y Relative Risk (RR) = A/ (A+B) C/(C+D) Risk difference (RD) = A/(A+B) – C/(C+D) NNT = 1/RD Measure of association
  • 25.
    Advantage Disadvantage Direct determinationof risk Take long time Strong evidence of exposure- disease association Difficult to implement and carry out Can study rare exposure Expensive Chance of loss to follow-up Change in exposure status may occur Need large sample to study rare disease High chance of confounding especially confounding by indication Cohort study 25
  • 26.
    Experimental group Develop outcome No outcome RCT study 26 Controlgroup Develop outcome No outcome futurePresent Prospective R* * Randomization
  • 27.
    Population Exposed Unexposed Cohort VSRCT 27 Population Exposed Unexposed Not randomly allocated (e.g. self selected) Randomly allocated/ Randomization
  • 28.
    Type Characteristic Parallel VS Crossover Parallel:Each group receive one treatment. Treatments are administered concurrently Crossover: Each group receive all treatment one after another. Treatments order differs for each group. Washout period may intervene between treatment. Simple VS factorial Simple: Each group gets one treatment Factorial: Each group gets two or more treatments Parallel VS Crossover VS Factorial 28
  • 29.
    Randomization Experimental Outcome No outcome Control Outcome No outcome ParallelVS crossover design 29 Randomization Experimental Control Outcome No outcome Control Experimental Outcome No outcome Washout Washout Phase I Phase II Parallel design Crossover design
  • 30.
    HIV-Infected Yes No Exposure status Zidovudine 9141 150 Placebo 31 118 149 Example:2 X 2 Table (RCT) 30 R C T s t u d y RR Zidovudine VS Placebo = (9/150) / (31/149) Adapted from N Eng J Med 1994:331:1173-1180
  • 31.
    Example: crossover design 31 Randomization (N= 16) Fish oil (N =8) Placebo Outcome No outcome Placebo (N =8) Fish oil Outcome No outcome Washout (2 weeks) Washout Phase I (3 weeks) Phase II( 3 weeks)
  • 32.
    Parallel Crossover Each groupreceive only one treatment. (Randomization of treatment group) Each group receive both treatment but in different order (Randomization of sequence) Many situations can only be studied in parallel such as fatal outcome Cannot studied some outcomes such as fatal outcome Typically need large N Can have fewer subjects and be convincing Dropout reduce power but Dropout reduces power Parallel VS Crossover 32
  • 33.
    Factorial design: Example 33 Male, smoker, aged 50-69 years - Tocopheral 50 mg -carotene 20 mg - Tocopheral 50 mg + -carotene 20 mg Placebo Objective: to analyse effect -Tocopheral and -carotene of and on incidence of cancer and mortality R GR 1 GR 2 GR 3 GR 4
  • 34.
    Outcome status Yes No Exposure status ExposedA B A+B Non- exposed C D C+D A+C B+D A+B+C+D 2 X 2 Table: RCT 34 R C T s t u d y Measure of association Relative Risk (RR) = A/ (A+B) C/(C+D) Risk difference (RD) = A/(A+B) – C/(C+D) NNT = 1/RD
  • 35.
    • Cluster randomizedtrials are experiments in which social units or clusters rather than individuals are randomly allocated to intervention groups 35 Cluster randomization study
  • 36.
  • 37.
    Ethics in experimentalstudy • Uncertainty in experimental study – Can’t give a harmful therapy to treatment group. – There should be a reasonable chance that the benefits outweigh potential risks. – Can’t withhold a beneficial treatment from control group. (Use a “standard care” control group as an alternative) • Informed consent • Monitoring boards
  • 38.
    Informed consent • Participantsshould understand: – Type of study – What is requested? – Risks and benefits – The concept of randomization and blinding – The right to withdraw – The right to be informed of relevant findings
  • 39.
    Randomization Concept: All individualhave same and independent chance of being allocated to any of the treatment groups; produces comparable groups. However, allocation ratios may vary (1:1, 1:2, 1:3). Goal: • To prevent bias related to selection. • Balances treatment group on known and unknown characteristics (minimized confounding)
  • 40.
    Randomization Desirable properties ofrandomization method • Ease of implementation • Small imbalance in sample size Difficult to guess next assignment The following is not examples of randomization: • Assigning every other patient to treatment A and others to B. • Assigning equal numbers to treatments A and B based on what is best for patient. • Assigning A to patients recruited from one source and B to patients from another source.
  • 41.
    • Basic concept:Coin tossing (e.g. Head = A, Tail = B) but clumsy and time consuming! • Using table of random digit (0-9). Each digit occurs on average the same number of times, there is no discernible pattern of digit values and the table present digits in pairs merely to help the user in scanning across the page. Simple randomization
  • 42.
     For 2treatments (1:1) assign A for digits 0-4 B for digits 5-9 Hence the numbers in the top row of table 0 5 2 7 8 4 3 7 4 1 6 8 3 8 5 1 5 6 9 6 produce a list: A B A B B A A B A A B B A B B A B B B B  For 3 treatments (1:1:1) assign A for digits 1-3 B for digits 4-6 C for digits 7-9 and ignore 0 produce a list:  For 2 treatments (2:1) : How? Simple randomization
  • 43.
    The advantage: Simple,each treatment assignment is completely unpredictable, the probability theory guarantees that in the long run the numbers of patients on each treatment will not be radically different. The disadvantage: High chance of imbalance in small trial. Simple randomization
  • 44.
    Random Permuted Blocks •Suppose we have T treatments, then for each block of kT patients we produce a different random ordering of k assignments to each treatment. – For 2 treatments, blocks of 2 patients assign AB for digits 0-4 BA for digit 5-9 Then, the numbers 0 5 2 7 8 AB BA AB BA BA Block randomization
  • 45.
     For 3treatments, blocks of three patients  ABC for Digit 1  ACB for Digit 2  BAC for Digit 3  BCA for Digit 4  CAB for Digit 5  CBA for Digit 6  Ignore 0 and 7-9 ◦ So, the number 0 5 2 7 8 4 Produce list - CAB ACB - - BCA Block randomization
  • 46.
     Disadvantage: Atthe end of each block, a clinician who keeps track of previous assignments could predict what the next treatment would be. If the block size is large , the serious mid-block inequality might occur. ◦ Example: Block size of 4 if the first three patient received A, B, and B then the 4th patient will receive A. Block randomization
  • 47.
     Unblinded =Open trial  Blinding: the treatment assignment is not known to certain persons. ◦ Single-blinded study, the treatment assignment is unknown to the patients ◦ Double-blinded study, the treatment assignment is unknown either to the patients or to their physicians ◦ Triple-blinded study, the treatment assignment is unknown to the patient, the physician, and the committee monitoring response Blinding
  • 48.
    Goal: Prevention ofbias (often in outcome assessment) Issues:  Ethics, breaking the blind  Difficulty blinding some treatment ◦ Drug with side effects: estrogen and bleeding ◦ Lifestyle changes, surgery procedure ◦ Assess the blinding whether the blinding still remains. Blinding
  • 49.
    • Matched placebo:identical in all respects to the active oral drug except that the active ingredients is absent. Particular features requiring matching are the colour, taste, texture, shape, size. • Double dummy: When 2 or more active drugs are being compared.Double dummy may be the option: Each active ingredient has a placebo identical to it. Each patient would take one active and one placebo pills. (Not reasonable when several active drugs are being compared.) Blinding
  • 50.
     Drug A(b.i.d.) vs Placebo: How?  Different dose schedule: How? A = new drug (sustained release) 100 mg o.d, B = conventional drug 100 mg t.i.d. Put in identical capsule: new drug, conventional, and placebo: then take tid in both group. Or using double dummy; Breakfast Lunch Evening  Gr A Real A B dummy B dummy B dummy  Gr B A dummy Real B Real B Real B Blinding
  • 51.
    Systematic review • Systematicreview: is a summary of the medical literature that – Use explicit methods – Is based on a through literature search – Performs a critical appraisal of individual studies – Synthesize the world literature on a specific issue – Use statistical techniques to combine data from valid studies (meta-analyses) • Systematic review may or may not include meta-analysis • Sackett DL, Strauss, S.E., Richardson, W. et.al. Evidence based medicine: How to practice and teach evidence based medicine” London” Churchill-Livingstone.2002.
  • 52.
    Why systematic review? •Expanding volume of published literature • Different or controversial results from studies of the same topic
  • 53.
    Systematic review VSNarrative review Narrative Systematic Informal and subjective methods to collect and interpret studies Formal and objective method to collect and synthesis the result from studies Not always conduct in extensive search Extensive search Rarely explicit about how they select the study. Tend to be selective in citing reports that reinforce their preconceived ideas Using explicit method with clear and reproducible eligibility criteria to select the study for review Less rigorous critical appraisal Rigorous critical appraisal High risk of bias Minimal bias
  • 54.
    Meta-analysis • Meta-analysis: “..A quantitative approach for systematically combining the results of previous research in order to arrive at conclusion about the body of research. • Petitti D.B., Meta analysis, decision analysis, and cost-effectiveness analysis. New York: Oxford University Press, 1994.
  • 55.
    Thank you foryour attention 55