Downloaded 306 times


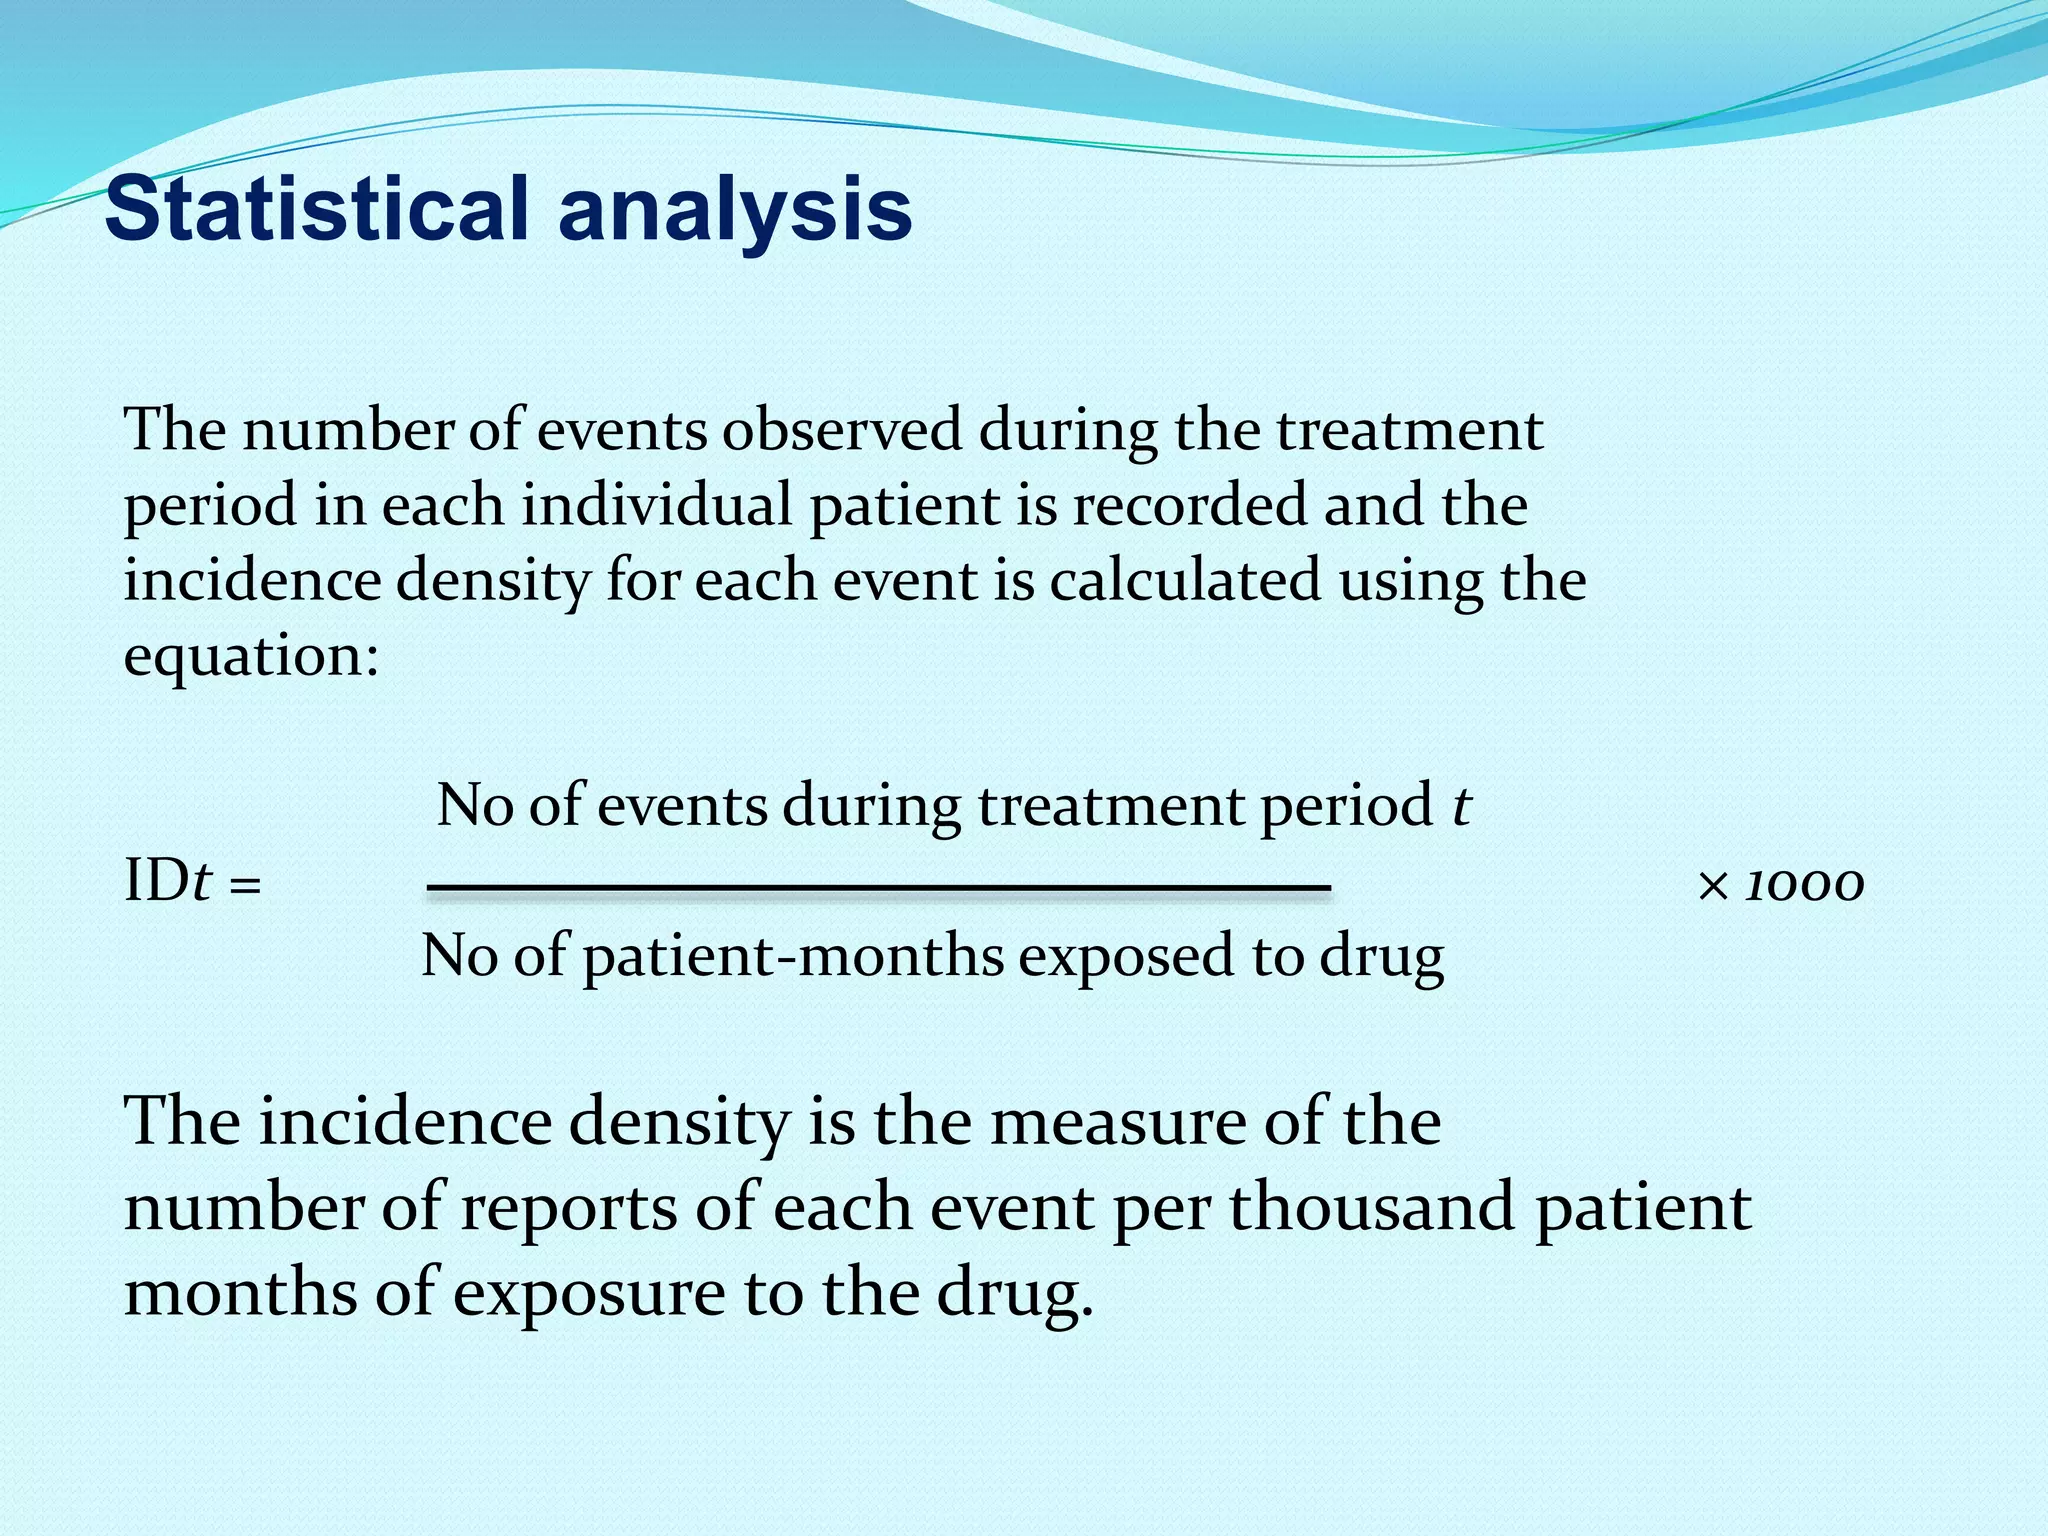


The document describes Prescription Event Monitoring (PEM), a method of pharmacovigilance that involves collecting information on patient outcomes after being prescribed new medications. PEM was developed in the 1980s in the UK to address limitations of spontaneous adverse event reporting. It involves sending questionnaires to prescribers to obtain follow-up data on patients. Analysis of the data provides incidence rates of adverse events and allows detection of potential safety issues with new drugs. Modified PEM (M-PEM) expands the method to collect additional targeted safety information.


