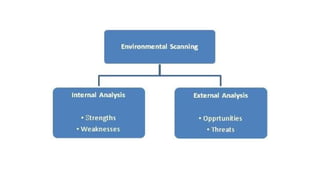
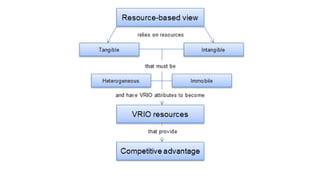
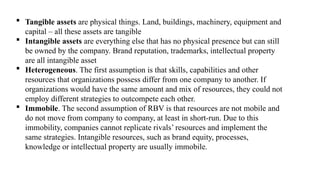
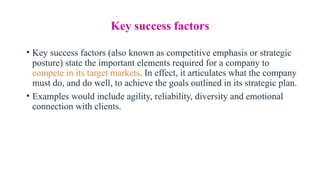
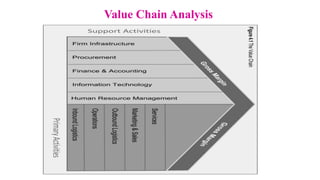
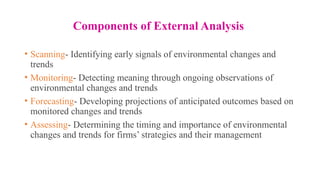
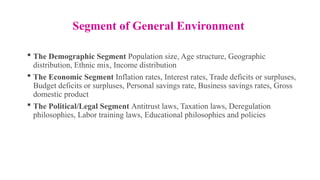
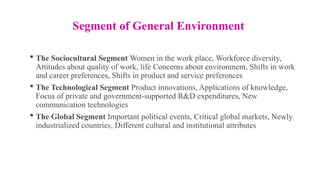
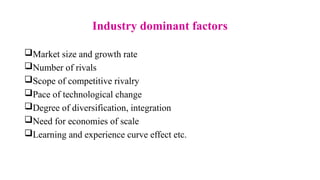
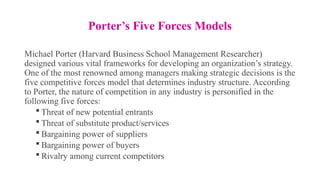
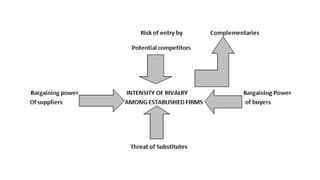
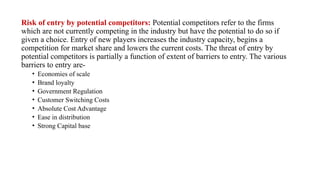
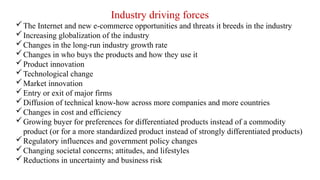
Unit 2
Environmental Analysis
Megharaja E N
Internal Analysis
• Internal environment analysis or internal analysis is the process of
assessing of internal resources and capabilities of an organization to
know its strengths and weaknesses.
• The organizational internal factors such as goals, policies, resources,
structure, culture, etc. are the source of strengths and weaknesses that
resides in different functional units such as HR, marketing, finance,
production, accounting, and R&D.
1. How well the current strategy is working?
2. What is our current situation?
3. What are our strengths and weaknesses?
4. How many resources are available?
Why we analysis Internal environment?
Competitive Advantage
• Competitive advantage is what makes an entity's products or services
more desirable to customers than that of any other rival.
• Competitive advantages can be broken down into comparative
advantages and differential advantages.
• Comparative advantage is a company's ability to produce something
more efficiently than a rival, which leads to greater profit margins.
• A differential advantage is when a company's products are seen as
both unique and of higher quality, relative to those of a competitor.
Competencies
• A strategic management competency is the competency of a business
organization to achieve and sustain a competitive advantage
• A ‘competency' is made up of a discipline and a methodology to instill
that discipline in an organization.
• Strategic management discipline
• Strategic management body of knowledge
• Strategic management framework
• Strategic management methodology
• Business organization design
• Strategic management process
• Organization member capabilities-innovation, leadership and
management, Business design
SWOT Analysis
• SWOT is an acronym for Strengths, Weaknesses, Opportunities
and Threats. By definition, Strengths (S) and Weaknesses (W) are
considered to be internal factors over which you have some measure
of control. Also, by definition, Opportunities (O) and Threats (T) are
considered to be external factors over which you have essentially no
control.
• SWOT Analysis is the most renowned tool
for audit and analysis of the overall strategic
position of the business and its environment.
Its key purpose is to identify the strategies
that will create a firm specific business
model that will best align an organization’s
resources and capabilities to the
requirements of the environment in which
the firm operates.
SWOT Analysis of Google
Strengths
• Market Leader in Search Engines
• Ability to Generate User Traffic
• Revenue from Advertising and Display
• Introduction of Android and Mobile Technologies
Weakness
• Excessive Reliance on Secrecy
• Falling Ad Rates
• Overdependence on Advertising
• Lack of Compatibility with next generation devices
SWOT Analysis of Google
Opportunities
• Android Operating System
• Diversification into non-Ad Business Models
• Google Glasses and Google Play
• Cloud Computing
Threats
• Competition from Facebook
• Mobile computing
SWOT Analysis helps in strategic planning in
following manner-
• It is a source of information for strategic planning.
• Builds organization’s strengths.
• Reverse its weaknesses.
• Maximize its response to opportunities.
• Overcome organization’s threats.
• It helps in identifying core competencies of the firm.
• It helps in setting of objectives for strategic planning.
• It helps in knowing past, present and future so that by using past and
current data, future plans can be chalked out.
There are certain limitations of SWOT Analysis which are not in control of
management. These include-
• Price increase;
• Inputs/raw materials;
• Government legislation;
• Economic environment;
• Searching a new market for the product which is not having overseas market due to
import restrictions; etc.
Internal limitations may include-Insufficient research and development facilities;
• Faulty products due to poor quality control;
• Poor industrial relations;
• Lack of skilled and efficient labour; etc
Resource
• Broad in scope, the term resources covers a spectrum of individual,
social, and organizational phenomena. Typically, resources alone do
not yield a competitive advantage. In fact, the core competencies that
yield a competitive advantage are created through the unique
bundling of several resources.
Resource
• Some of a firm’s resources are tangible while others are intangible.
• Tangible resources are assets that can be seen and quantified. Production equipment,
manufacturing plants, and formal reporting structures are examples of tangible resources.
• Intangible resources typically include assets that are rooted deeply in the firm’s history and
have accumulated over time. Because they are embedded in unique patterns of routines,
intangible resources are relatively difficult for competitors to analyze and imitate.
Knowledge, trust between managers and employees, ideas, the capacity for innovation,
managerial capabilities, organizational routines (the unique ways people work together),
scientific capabilities, and the firm’s reputation for its goods or services and how it
interacts with people (such as employees, customers, and suppliers) are all examples of
intangible resources.
• The four types of tangible resources are financial, organizational, physical, and
technological. The three types of intangible resources are human, innovation, and
reputational.
Capabilities
• Capabilities are the firm’s capacity to deploy resources that have been
purposely integrated to achieve a desired end state.
• capabilities emerge over time through complex interactions among
tangible and intangible resources. They can be tangible, like a
business process that is automated, but most of them tend to be tacit
and intangible. Critical to forming competitive advantages, capabilities
are often based on developing, carrying, and exchanging
information and knowledge through the firm’s human capital
Core competencies
 A core competencies is a concept in management theory and can
be defined as a harmonized combination of multiple resource and
skills that distinguish a firm in the marketplace
 Core competencies fulfil three criteria like:
 Provide potential access to a wide variety of market
 Should make a significant contribution to the perceived
customer benefits of the end product
 Difficult to imitate by competitors
Need for Core competencies
 Facilitate strategy development
 Long term competitive advantages
 Outsourcing non-core activities
 Encourages innovation
 An attribute valued by market
Characteristics Core competencies
Resource Base View of firm
• The resource-based view (RBV) is a model that sees resources as key to
superior firm performance. If a resource exhibits VRIO attributes, the
resource enables the firm to gain and sustain competitive advantage.
 Tangible assets are physical things. Land, buildings, machinery, equipment and
capital – all these assets are tangible
 Intangible assets are everything else that has no physical presence but can still
be owned by the company. Brand reputation, trademarks, intellectual property
are all intangible asset
 Heterogeneous. The first assumption is that skills, capabilities and other
resources that organizations possess differ from one company to another. If
organizations would have the same amount and mix of resources, they could not
employ different strategies to outcompete each other.
 Immobile. The second assumption of RBV is that resources are not mobile and
do not move from company to company, at least in short-run. Due to this
immobility, companies cannot replicate rivals’ resources and implement the
same strategies. Intangible resources, such as brand equity, processes,
knowledge or intellectual property are usually immobile.
Key success factors
• Key success factors (also known as competitive emphasis or strategic
posture) state the important elements required for a company to
compete in its target markets. In effect, it articulates what the company
must do, and do well, to achieve the goals outlined in its strategic plan.
• Examples would include agility, reliability, diversity and emotional
connection with clients.
Key success factors
• Planning
• Communication
• Skills
• Team work
• Management
• Process
• Tools and techniques
• Program governance
• Acceptance for change
• Customer focused
• Stakeholder management etc.
Value Chain Analysis
Primary activities
The first are primary activities which include the five main activities.
All five activities are directly involved in the production and selling of
the actual product. They cover the physical creation of the product, its
sales, transfer to the buyer as well as after sale assistance.
The five primary activities are inbound logistics, operations, outbound
logistics, marketing & sales and service.
Inbound Logistics
• Inbound logistics is where purchased inputs such as raw materials are
often taken care of. Because of this function, it is also in contact with
external companies such as suppliers. The activities associated with
inbound logistics are receiving, storing and disseminating inputs to the
product.
• Examples: material handling, warehousing, inventory control, vehicle
scheduling and returns to suppliers.
Operations
• Once the required materials have been collected internally, operations can
convert the inputs in the desired product. This phase is typically where
the factory conveyor belts are being used. The activities associated with
operations are therefore transforming inputs into the final product form.
• Examples: machining, packaging, assembly, equipment maintenance,
testing, printing and facility operations.
Outbound Logistics
• After the final product is finished it still needs to find its way to the
customer. Depending on how lean the company is, the product can be
shipped right away or has to be stored for a while. The activities
associated with outbound logistics are collecting, storing and physically
distributing the product to buyers.
• Examples: finished goods warehousing, material handling, delivery
vehicle operations, order processing and scheduling.
Marketing & Sales
• The fact that products are produced doesn’t automatically mean that there are people
willing to purchase them. This is where marketing and sales come into place. It is the
job of marketeers and sales agents to make sure that potential customers are aware of
the product and are seriously considering purchasing them. Activities associated with
marketing and sales are therefore to provide a means by which buyers can purchase
the product and induce them to do so.
• Examples: advertising, promotion, sales force, quoting, channel selection, channel
relations and pricing
Service
 In today’s economy, after-sales service is just as important as promotional
activities. Complaints from unsatisfied customers are easily spread and
shared due to the internet and the consequences on your company’s
reputation might be vast. It is therefore important to have the right
customer service practices in place. The activities associated with this
part of the value chain are providing service to enhance or maintain the
value of the product after it has been sold and delivered.
 Examples: installation, repair, training, parts supply and product
adjustment.
Support Activities
• The second category is support activities. They go across the primary
activities and aim to coordinate and support their functions as best as
possible with each other by providing purchased inputs, technology,
human resources and various firm wide managing functions.
• The support activities can therefore be divided into
procurement, technology development (R&D), human resource
management and firm infrastructure. The dotted lines reflect the fact that
procurement, technology development and human resource management
can be associated with specific primary activities as well as support the
entire value chain.
Procurement
• Procurement refers to the function of purchasing inputs used in the firm’s value chain,
not the purchased inputs themselves. Purchased inputs are needed for every value
activity, including support activities. Purchased inputs include raw materials, supplies
and other consumable items as well as assets such as machinery, laboratory
equipment, office equipment and buildings. Procurement is therefore needed to assist
multiple value chain activities, not just inbound logistics.
Technology Development (R&D)
• Every value activity embodies technology, be it know how, procedures or technology
embodied in process equipment. The array of technology used in most companies is
very broad. Technology development activities can be grouped into efforts to improve
the product and the process. Examples are telecommunication technology, accounting
automation software, product design research and customer servicing procedures.
Typically, Research & Development departments can also be classified here.
Human Resource Management
• HRM consists of activities involved in the recruiting, hiring (and firing), training,
development and compensation of all types of personnel. HRM affects the competitive
advantage in any firm through its role in determining the skills and motivation of
employees and the cost of hiring and training them.
Firm Infrastructure
• Firm infrastructure consists of a number of activities including general (strategic)
management, planning, finance, accounting, legal, government affairs and quality
management. Infrastructure usually supports the entire value chain, and not individual
activities. In accounting, many firm infrastructure activities are often collectively
indicated as ‘overhead’ costs.
Bench Marking
• Benchmarking, is a tool of strategic management, that allows the
organization to set goals and measure productivity, on the basis of the
best industry practices. It is a practice in which quality level is used as a
point of reference to evaluate things by making a comparison.
• The process helps in comparing and gauging the processes, programs,
strategies and performance metrics with the standard measurements or to
other similar companies. It is concerned with the analysis of major
dimensions:
• Quality
• Time
• Cost
Types of Bench Marking
• Internal Benchmarking: When measurement and
comparison of key operations between teams,
groups and individuals are made within the
organization, the benchmarking is said to be
internal.
• External Benchmarking: When measurement and
comparison of key operations are made with the
competitors, then, it is called as external
benchmarking.
Process of Bench Marking
 Identifying the need for Benchmarking
 Understanding the existing process and practices
 Obtaining support and approval from the top management.
 Identifying best practices.
 Making a comparison between the firm’s processes and performance with
those of rivals.
 Preparation of report, regarding the differences in standard and actual
results.
 Implementing steps necessary for filling gaps in performance.
 Evaluation and review
External Analysis
• External analysis means examining the industry environment of a
company, including factors such as competitive structure, competitive
position, dynamics, and history. On a macro scale, external analysis
includes macroeconomic, global, political, social, demographic, and
technological analysis.
Components of External Analysis
• Scanning- Identifying early signals of environmental changes and
trends
• Monitoring- Detecting meaning through ongoing observations of
environmental changes and trends
• Forecasting- Developing projections of anticipated outcomes based on
monitored changes and trends
• Assessing- Determining the timing and importance of environmental
changes and trends for firms’ strategies and their management
Segment of General Environment
• Dimensions in the broader society that influence an industry and the
firms within it:
Demographic
Economic
Political/legal
Sociocultural
Technological
Global
Segment of General Environment
 The Demographic Segment Population size, Age structure, Geographic
distribution, Ethnic mix, Income distribution
 The Economic Segment Inflation rates, Interest rates, Trade deficits or surpluses,
Budget deficits or surpluses, Personal savings rate, Business savings rates, Gross
domestic product
 The Political/Legal Segment Antitrust laws, Taxation laws, Deregulation
philosophies, Labor training laws, Educational philosophies and policies
Segment of General Environment
 The Sociocultural Segment Women in the work place, Workforce diversity,
Attitudes about quality of work, life Concerns about environment, Shifts in work
and career preferences, Shifts in product and service preferences
 The Technological Segment Product innovations, Applications of knowledge,
Focus of private and government-supported R&D expenditures, New
communication technologies
 The Global Segment Important political events, Critical global markets, Newly
industrialized countries, Different cultural and institutional attributes
Industry dominant factors
Market size and growth rate
Number of rivals
Scope of competitive rivalry
Pace of technological change
Degree of diversification, integration
Need for economies of scale
Learning and experience curve effect etc.
Porter’s Five Forces Models
Michael Porter (Harvard Business School Management Researcher)
designed various vital frameworks for developing an organization’s strategy.
One of the most renowned among managers making strategic decisions is the
five competitive forces model that determines industry structure. According
to Porter, the nature of competition in any industry is personified in the
following five forces:
 Threat of new potential entrants
 Threat of substitute product/services
 Bargaining power of suppliers
 Bargaining power of buyers
 Rivalry among current competitors
Risk of entry by potential competitors: Potential competitors refer to the firms
which are not currently competing in the industry but have the potential to do so if
given a choice. Entry of new players increases the industry capacity, begins a
competition for market share and lowers the current costs. The threat of entry by
potential competitors is partially a function of extent of barriers to entry. The various
barriers to entry are-
• Economies of scale
• Brand loyalty
• Government Regulation
• Customer Switching Costs
• Absolute Cost Advantage
• Ease in distribution
• Strong Capital base
• Rivalry among current competitors: Rivalry refers to the competitive
struggle for market share between firms in an industry. Extreme rivalry
among established firms poses a strong threat to profitability. The strength of
rivalry among established firms within an industry is a function of following
factors:
• Extent of exit barriers
• Amount of fixed cost
• Competitive structure of industry
• Presence of global customers
• Absence of switching costs
• Growth Rate of industry
• Demand conditions
• Bargaining Power of Buyers: Buyers refer to the customers who finally
consume the product or the firms who distribute the industry’s product to
the final consumers.
• Bargaining power of buyers refer to the potential of buyers to bargain down
the prices charged by the firms in the industry or to increase the firms cost
in the industry by demanding better quality and service of product.
• Strong buyers can extract profits out of an industry by lowering the prices
and increasing the costs. They purchase in large quantities. They have full
information about the product and the market. They emphasize upon quality
products. They pose credible threat of backward integration. In this way,
they are regarded as a threat.
• Bargaining Power of Suppliers: Suppliers refer to the firms that provide
inputs to the industry.
• Bargaining power of the suppliers refer to the potential of the suppliers to
increase the prices of inputs( labour, raw materials, services, etc) or the
costs of industry in other ways.
• Strong suppliers can extract profits out of an industry by increasing costs
of firms in the industry. Suppliers products have a few substitutes. Strong
suppliers’ products are unique. They have high switching cost. Their
product is an important input to buyer’s product. They pose credible threat
of forward integration. Buyers are not significant to strong suppliers. In
this way, they are regarded as a threat.
• Threat of Substitute products: Substitute products refer to the
products having ability of satisfying customers needs effectively.
Substitutes pose a ceiling (upper limit) on the potential returns of an
industry by putting a setting a limit on the price that firms can charge
for their product in an industry.
• Lesser the number of close substitutes a product has, greater is the
opportunity for the firms in industry to raise their product prices and
earn greater profits (other things being equal).
Porter’s Five Forces Analysis of Samsung
• Industry Rivalry- LG, Nokia, and Motorola
• Barriers to Entry and Exit
• Power of Buyers
The power of buyers for white goods makers like Samsung is somewhat of a
mixed bag where though the buyers have a multitude of options to choose from
and at the same time have to stick with the product since they cannot just dump
the product, as it is a high value item.
• Power of Suppliers
In many markets in which Samsung operates, there are many suppliers who are
willing to offer their services at a discount since the ancillary sectors are very
deep. However, this does not mean that the companies can exert undue force
over the suppliers as once the supply chain is established; it takes a lot to undo it
and build a new supply chain afresh. This is the reason why white goods makers
like Samsung invariably study the markets before setting up shop and also take
the help of consultancies in arriving at their decision.
• Threat of Substitutes
 This element is indeed high as the markets for white goods are flooded with
many substitutes and given the fact that consumer durables are often longer
term purchases, companies like Samsung have to be careful in deciding on the
appropriate marketing strategy. This is also the reason why many multinationals
like Samsung often adopt differential pricing so as to attract consumers from
across the income pyramid to wean them away from cheaper substitutes.
 Further, this element also means that many emerging market consumers are yet
to deepen their dependence on white goods and instead, prefer to the traditional
forms of housework wherein they rely less on gadgets and appliances. However,
this is rapidly changing as more women enter the workforce in these markets
making it necessary for them to use gadgets and appliances.
PEST Analysis
• A PESTEL analysis or PESTLE analysis (formerly
known as PEST analysis) is a framework or tool
used to analyze and monitor the macro-
environmental factors that may have a profound
impact on an organization's performance
Political factors
 Government stability/instability
 Corruption level
 Tax policies
 Freedom of press
 Government regulation and deregulation
 Special tariffs
 Political action committees
 Government involvement in trade unions and agreements
 Competition regulation
 Voter participation rates
 Amount of government protests
 Defense expenditures
 Level of government subsidies
 Bilateral relationships
 Import-export regulation/resctrictions
 Trade control
 Lobbying activities
 Size of government budgets
Economic factors
 Growth rate
 Interest rate
 Inflation rate
 Exchange rate
 Availability of credit
 Level of income
 Propensity of people to spend
 Federal government budget deficits
 Gross domestic product trend
 Unemployment trend
 Stock market trends
 Price fluctuations
Social factors
 Population size and
growth rate
 Birth rates
 Death rates
 Number of marriages
 Number of divorces
 Immigration and
emigration rates
 Life expectancy rates
 Age distribution
 Wealth distribution
 Social classes
 Per capita income
 Family size and structure
 Lifestyles
 Health consciousness
 Average disposable income
 Attitude towards government
 Attitude towards work
 Buying habits
 Ethical concerns
 Cultural norms and values
 Religion and beliefs
 Racial equality
 Use of birth control
 Education level
Technological factors
 Technology incentives
 Automation
 R&D activity
 Technological change
 Access to new technology
 Level of innovation
 Technological awareness
 Internet infrastructure
 Communication infrastructure
 Life cycle of technology
Environmental factors
 Weather
 Climate
 Environmental policies
 Climate change
 Pressures from NGO’s
 Natural disasters
 Air and water pollution
 Recycling standards
 Attitudes towards green products
 Support for renewable energy
Legal factors
 Discrimination laws
 Antitrust laws
 Employment laws
 Consumer protection laws
 Copyright and patent laws
 Health and safety laws
 Education laws
 Consumer protection laws
 Data protection laws
 Key internal forces (such as knowledge and competence of management
and workforce) and external forces (such as the economy, competitors,
technology) that trigger the change of strategy in an organization.
 Driving forces in an industry are the major underlying causes of changing
industry and competitive conditions.
 The internal and external factors that persuade the decisions and policies
an organization makes to keep on competitive.
 Internal forces include core capabilities, employee turnover, product, and
technological innovation
 External forces include economic conditions, competition, demographic
changes, technological evolution, social trends, local and national politics,
and environmental issues.
Industry Driving Forces
Industry driving forces
The Internet and new e-commerce opportunities and threats it breeds in the industry
Increasing globalization of the industry
Changes in the long-run industry growth rate
Changes in who buys the products and how they use it
Product innovation
Technological change
Market innovation
Entry or exit of major firms
Diffusion of technical know-how across more companies and more countries
Changes in cost and efficiency
Growing buyer for preferences for differentiated products instead of a commodity
product (or for a more standardized product instead of strongly differentiated products)
Regulatory influences and government policy changes
Changing societal concerns; attitudes, and lifestyles
Reductions in uncertainty and business risk
Strategic group mapping
• Strategic group mapping is a method to display the position that rival
organizations hold in a competitive industry.
• In a strategic group mapping example, variables such as price,
product-line breadth or area of operations are represented
• Strategic group maps are visual representations of the
industry that aid in decision making. It’s constructed in the
form of a graph, by assigning variables to each
axis. Strategic group map analysis reveals the competitive
nature of the strategic groups in the industry.
Purpose Of Strategy Group Mapping
They Can Better Identify Barriers To Entry And Exit
It Can Help Decide Which Strategic Group An Organization Should Consider Entering
It Helps Identify Strategic Areas That Can Help Gain Benefits
It Shows The Organization’s Position In The Industry Compared To Its Competitors
It Identifies The Best Organizations In The Industry
It Pinpoints Industry Rivals
There are four steps to construct a strategic group map:
Identify the competitive variables that distinguish companies
Plot firms on a two-variable map with pairs of characteristics
Assign companies to the strategic groups
Draw circles around each strategic group.
strategic management, Environmental analysis, Internal environment, External environment.pptx

strategic management, Environmental analysis, Internal environment, External environment.pptx

  • 1.
  • 2.
    Internal Analysis • Internalenvironment analysis or internal analysis is the process of assessing of internal resources and capabilities of an organization to know its strengths and weaknesses. • The organizational internal factors such as goals, policies, resources, structure, culture, etc. are the source of strengths and weaknesses that resides in different functional units such as HR, marketing, finance, production, accounting, and R&D.
  • 3.
    1. How wellthe current strategy is working? 2. What is our current situation? 3. What are our strengths and weaknesses? 4. How many resources are available? Why we analysis Internal environment?
  • 4.
    Competitive Advantage • Competitiveadvantage is what makes an entity's products or services more desirable to customers than that of any other rival. • Competitive advantages can be broken down into comparative advantages and differential advantages. • Comparative advantage is a company's ability to produce something more efficiently than a rival, which leads to greater profit margins. • A differential advantage is when a company's products are seen as both unique and of higher quality, relative to those of a competitor.
  • 5.
    Competencies • A strategicmanagement competency is the competency of a business organization to achieve and sustain a competitive advantage • A ‘competency' is made up of a discipline and a methodology to instill that discipline in an organization.
  • 6.
    • Strategic managementdiscipline • Strategic management body of knowledge • Strategic management framework • Strategic management methodology • Business organization design • Strategic management process • Organization member capabilities-innovation, leadership and management, Business design
  • 7.
    SWOT Analysis • SWOTis an acronym for Strengths, Weaknesses, Opportunities and Threats. By definition, Strengths (S) and Weaknesses (W) are considered to be internal factors over which you have some measure of control. Also, by definition, Opportunities (O) and Threats (T) are considered to be external factors over which you have essentially no control.
  • 8.
    • SWOT Analysisis the most renowned tool for audit and analysis of the overall strategic position of the business and its environment. Its key purpose is to identify the strategies that will create a firm specific business model that will best align an organization’s resources and capabilities to the requirements of the environment in which the firm operates.
  • 9.
    SWOT Analysis ofGoogle Strengths • Market Leader in Search Engines • Ability to Generate User Traffic • Revenue from Advertising and Display • Introduction of Android and Mobile Technologies Weakness • Excessive Reliance on Secrecy • Falling Ad Rates • Overdependence on Advertising • Lack of Compatibility with next generation devices
  • 10.
    SWOT Analysis ofGoogle Opportunities • Android Operating System • Diversification into non-Ad Business Models • Google Glasses and Google Play • Cloud Computing Threats • Competition from Facebook • Mobile computing
  • 12.
    SWOT Analysis helpsin strategic planning in following manner- • It is a source of information for strategic planning. • Builds organization’s strengths. • Reverse its weaknesses. • Maximize its response to opportunities. • Overcome organization’s threats. • It helps in identifying core competencies of the firm. • It helps in setting of objectives for strategic planning. • It helps in knowing past, present and future so that by using past and current data, future plans can be chalked out.
  • 13.
    There are certainlimitations of SWOT Analysis which are not in control of management. These include- • Price increase; • Inputs/raw materials; • Government legislation; • Economic environment; • Searching a new market for the product which is not having overseas market due to import restrictions; etc. Internal limitations may include-Insufficient research and development facilities; • Faulty products due to poor quality control; • Poor industrial relations; • Lack of skilled and efficient labour; etc
  • 14.
    Resource • Broad inscope, the term resources covers a spectrum of individual, social, and organizational phenomena. Typically, resources alone do not yield a competitive advantage. In fact, the core competencies that yield a competitive advantage are created through the unique bundling of several resources.
  • 15.
    Resource • Some ofa firm’s resources are tangible while others are intangible. • Tangible resources are assets that can be seen and quantified. Production equipment, manufacturing plants, and formal reporting structures are examples of tangible resources. • Intangible resources typically include assets that are rooted deeply in the firm’s history and have accumulated over time. Because they are embedded in unique patterns of routines, intangible resources are relatively difficult for competitors to analyze and imitate. Knowledge, trust between managers and employees, ideas, the capacity for innovation, managerial capabilities, organizational routines (the unique ways people work together), scientific capabilities, and the firm’s reputation for its goods or services and how it interacts with people (such as employees, customers, and suppliers) are all examples of intangible resources. • The four types of tangible resources are financial, organizational, physical, and technological. The three types of intangible resources are human, innovation, and reputational.
  • 16.
    Capabilities • Capabilities arethe firm’s capacity to deploy resources that have been purposely integrated to achieve a desired end state. • capabilities emerge over time through complex interactions among tangible and intangible resources. They can be tangible, like a business process that is automated, but most of them tend to be tacit and intangible. Critical to forming competitive advantages, capabilities are often based on developing, carrying, and exchanging information and knowledge through the firm’s human capital
  • 18.
    Core competencies  Acore competencies is a concept in management theory and can be defined as a harmonized combination of multiple resource and skills that distinguish a firm in the marketplace  Core competencies fulfil three criteria like:  Provide potential access to a wide variety of market  Should make a significant contribution to the perceived customer benefits of the end product  Difficult to imitate by competitors
  • 19.
    Need for Corecompetencies  Facilitate strategy development  Long term competitive advantages  Outsourcing non-core activities  Encourages innovation  An attribute valued by market
  • 20.
  • 21.
    Resource Base Viewof firm • The resource-based view (RBV) is a model that sees resources as key to superior firm performance. If a resource exhibits VRIO attributes, the resource enables the firm to gain and sustain competitive advantage.
  • 23.
     Tangible assetsare physical things. Land, buildings, machinery, equipment and capital – all these assets are tangible  Intangible assets are everything else that has no physical presence but can still be owned by the company. Brand reputation, trademarks, intellectual property are all intangible asset  Heterogeneous. The first assumption is that skills, capabilities and other resources that organizations possess differ from one company to another. If organizations would have the same amount and mix of resources, they could not employ different strategies to outcompete each other.  Immobile. The second assumption of RBV is that resources are not mobile and do not move from company to company, at least in short-run. Due to this immobility, companies cannot replicate rivals’ resources and implement the same strategies. Intangible resources, such as brand equity, processes, knowledge or intellectual property are usually immobile.
  • 24.
    Key success factors •Key success factors (also known as competitive emphasis or strategic posture) state the important elements required for a company to compete in its target markets. In effect, it articulates what the company must do, and do well, to achieve the goals outlined in its strategic plan. • Examples would include agility, reliability, diversity and emotional connection with clients.
  • 25.
    Key success factors •Planning • Communication • Skills • Team work • Management • Process • Tools and techniques • Program governance • Acceptance for change • Customer focused • Stakeholder management etc.
  • 26.
  • 27.
    Primary activities The firstare primary activities which include the five main activities. All five activities are directly involved in the production and selling of the actual product. They cover the physical creation of the product, its sales, transfer to the buyer as well as after sale assistance. The five primary activities are inbound logistics, operations, outbound logistics, marketing & sales and service.
  • 28.
    Inbound Logistics • Inboundlogistics is where purchased inputs such as raw materials are often taken care of. Because of this function, it is also in contact with external companies such as suppliers. The activities associated with inbound logistics are receiving, storing and disseminating inputs to the product. • Examples: material handling, warehousing, inventory control, vehicle scheduling and returns to suppliers.
  • 29.
    Operations • Once therequired materials have been collected internally, operations can convert the inputs in the desired product. This phase is typically where the factory conveyor belts are being used. The activities associated with operations are therefore transforming inputs into the final product form. • Examples: machining, packaging, assembly, equipment maintenance, testing, printing and facility operations.
  • 30.
    Outbound Logistics • Afterthe final product is finished it still needs to find its way to the customer. Depending on how lean the company is, the product can be shipped right away or has to be stored for a while. The activities associated with outbound logistics are collecting, storing and physically distributing the product to buyers. • Examples: finished goods warehousing, material handling, delivery vehicle operations, order processing and scheduling.
  • 31.
    Marketing & Sales •The fact that products are produced doesn’t automatically mean that there are people willing to purchase them. This is where marketing and sales come into place. It is the job of marketeers and sales agents to make sure that potential customers are aware of the product and are seriously considering purchasing them. Activities associated with marketing and sales are therefore to provide a means by which buyers can purchase the product and induce them to do so. • Examples: advertising, promotion, sales force, quoting, channel selection, channel relations and pricing
  • 32.
    Service  In today’seconomy, after-sales service is just as important as promotional activities. Complaints from unsatisfied customers are easily spread and shared due to the internet and the consequences on your company’s reputation might be vast. It is therefore important to have the right customer service practices in place. The activities associated with this part of the value chain are providing service to enhance or maintain the value of the product after it has been sold and delivered.  Examples: installation, repair, training, parts supply and product adjustment.
  • 33.
    Support Activities • Thesecond category is support activities. They go across the primary activities and aim to coordinate and support their functions as best as possible with each other by providing purchased inputs, technology, human resources and various firm wide managing functions. • The support activities can therefore be divided into procurement, technology development (R&D), human resource management and firm infrastructure. The dotted lines reflect the fact that procurement, technology development and human resource management can be associated with specific primary activities as well as support the entire value chain.
  • 34.
    Procurement • Procurement refersto the function of purchasing inputs used in the firm’s value chain, not the purchased inputs themselves. Purchased inputs are needed for every value activity, including support activities. Purchased inputs include raw materials, supplies and other consumable items as well as assets such as machinery, laboratory equipment, office equipment and buildings. Procurement is therefore needed to assist multiple value chain activities, not just inbound logistics. Technology Development (R&D) • Every value activity embodies technology, be it know how, procedures or technology embodied in process equipment. The array of technology used in most companies is very broad. Technology development activities can be grouped into efforts to improve the product and the process. Examples are telecommunication technology, accounting automation software, product design research and customer servicing procedures. Typically, Research & Development departments can also be classified here.
  • 35.
    Human Resource Management •HRM consists of activities involved in the recruiting, hiring (and firing), training, development and compensation of all types of personnel. HRM affects the competitive advantage in any firm through its role in determining the skills and motivation of employees and the cost of hiring and training them. Firm Infrastructure • Firm infrastructure consists of a number of activities including general (strategic) management, planning, finance, accounting, legal, government affairs and quality management. Infrastructure usually supports the entire value chain, and not individual activities. In accounting, many firm infrastructure activities are often collectively indicated as ‘overhead’ costs.
  • 36.
    Bench Marking • Benchmarking,is a tool of strategic management, that allows the organization to set goals and measure productivity, on the basis of the best industry practices. It is a practice in which quality level is used as a point of reference to evaluate things by making a comparison. • The process helps in comparing and gauging the processes, programs, strategies and performance metrics with the standard measurements or to other similar companies. It is concerned with the analysis of major dimensions: • Quality • Time • Cost
  • 37.
    Types of BenchMarking • Internal Benchmarking: When measurement and comparison of key operations between teams, groups and individuals are made within the organization, the benchmarking is said to be internal. • External Benchmarking: When measurement and comparison of key operations are made with the competitors, then, it is called as external benchmarking.
  • 38.
    Process of BenchMarking  Identifying the need for Benchmarking  Understanding the existing process and practices  Obtaining support and approval from the top management.  Identifying best practices.  Making a comparison between the firm’s processes and performance with those of rivals.  Preparation of report, regarding the differences in standard and actual results.  Implementing steps necessary for filling gaps in performance.  Evaluation and review
  • 39.
    External Analysis • Externalanalysis means examining the industry environment of a company, including factors such as competitive structure, competitive position, dynamics, and history. On a macro scale, external analysis includes macroeconomic, global, political, social, demographic, and technological analysis.
  • 40.
    Components of ExternalAnalysis • Scanning- Identifying early signals of environmental changes and trends • Monitoring- Detecting meaning through ongoing observations of environmental changes and trends • Forecasting- Developing projections of anticipated outcomes based on monitored changes and trends • Assessing- Determining the timing and importance of environmental changes and trends for firms’ strategies and their management
  • 41.
    Segment of GeneralEnvironment • Dimensions in the broader society that influence an industry and the firms within it: Demographic Economic Political/legal Sociocultural Technological Global
  • 42.
    Segment of GeneralEnvironment  The Demographic Segment Population size, Age structure, Geographic distribution, Ethnic mix, Income distribution  The Economic Segment Inflation rates, Interest rates, Trade deficits or surpluses, Budget deficits or surpluses, Personal savings rate, Business savings rates, Gross domestic product  The Political/Legal Segment Antitrust laws, Taxation laws, Deregulation philosophies, Labor training laws, Educational philosophies and policies
  • 43.
    Segment of GeneralEnvironment  The Sociocultural Segment Women in the work place, Workforce diversity, Attitudes about quality of work, life Concerns about environment, Shifts in work and career preferences, Shifts in product and service preferences  The Technological Segment Product innovations, Applications of knowledge, Focus of private and government-supported R&D expenditures, New communication technologies  The Global Segment Important political events, Critical global markets, Newly industrialized countries, Different cultural and institutional attributes
  • 44.
    Industry dominant factors Marketsize and growth rate Number of rivals Scope of competitive rivalry Pace of technological change Degree of diversification, integration Need for economies of scale Learning and experience curve effect etc.
  • 45.
    Porter’s Five ForcesModels Michael Porter (Harvard Business School Management Researcher) designed various vital frameworks for developing an organization’s strategy. One of the most renowned among managers making strategic decisions is the five competitive forces model that determines industry structure. According to Porter, the nature of competition in any industry is personified in the following five forces:  Threat of new potential entrants  Threat of substitute product/services  Bargaining power of suppliers  Bargaining power of buyers  Rivalry among current competitors
  • 47.
    Risk of entryby potential competitors: Potential competitors refer to the firms which are not currently competing in the industry but have the potential to do so if given a choice. Entry of new players increases the industry capacity, begins a competition for market share and lowers the current costs. The threat of entry by potential competitors is partially a function of extent of barriers to entry. The various barriers to entry are- • Economies of scale • Brand loyalty • Government Regulation • Customer Switching Costs • Absolute Cost Advantage • Ease in distribution • Strong Capital base
  • 48.
    • Rivalry amongcurrent competitors: Rivalry refers to the competitive struggle for market share between firms in an industry. Extreme rivalry among established firms poses a strong threat to profitability. The strength of rivalry among established firms within an industry is a function of following factors: • Extent of exit barriers • Amount of fixed cost • Competitive structure of industry • Presence of global customers • Absence of switching costs • Growth Rate of industry • Demand conditions
  • 49.
    • Bargaining Powerof Buyers: Buyers refer to the customers who finally consume the product or the firms who distribute the industry’s product to the final consumers. • Bargaining power of buyers refer to the potential of buyers to bargain down the prices charged by the firms in the industry or to increase the firms cost in the industry by demanding better quality and service of product. • Strong buyers can extract profits out of an industry by lowering the prices and increasing the costs. They purchase in large quantities. They have full information about the product and the market. They emphasize upon quality products. They pose credible threat of backward integration. In this way, they are regarded as a threat.
  • 50.
    • Bargaining Powerof Suppliers: Suppliers refer to the firms that provide inputs to the industry. • Bargaining power of the suppliers refer to the potential of the suppliers to increase the prices of inputs( labour, raw materials, services, etc) or the costs of industry in other ways. • Strong suppliers can extract profits out of an industry by increasing costs of firms in the industry. Suppliers products have a few substitutes. Strong suppliers’ products are unique. They have high switching cost. Their product is an important input to buyer’s product. They pose credible threat of forward integration. Buyers are not significant to strong suppliers. In this way, they are regarded as a threat.
  • 51.
    • Threat ofSubstitute products: Substitute products refer to the products having ability of satisfying customers needs effectively. Substitutes pose a ceiling (upper limit) on the potential returns of an industry by putting a setting a limit on the price that firms can charge for their product in an industry. • Lesser the number of close substitutes a product has, greater is the opportunity for the firms in industry to raise their product prices and earn greater profits (other things being equal).
  • 52.
    Porter’s Five ForcesAnalysis of Samsung • Industry Rivalry- LG, Nokia, and Motorola • Barriers to Entry and Exit • Power of Buyers The power of buyers for white goods makers like Samsung is somewhat of a mixed bag where though the buyers have a multitude of options to choose from and at the same time have to stick with the product since they cannot just dump the product, as it is a high value item.
  • 53.
    • Power ofSuppliers In many markets in which Samsung operates, there are many suppliers who are willing to offer their services at a discount since the ancillary sectors are very deep. However, this does not mean that the companies can exert undue force over the suppliers as once the supply chain is established; it takes a lot to undo it and build a new supply chain afresh. This is the reason why white goods makers like Samsung invariably study the markets before setting up shop and also take the help of consultancies in arriving at their decision.
  • 54.
    • Threat ofSubstitutes  This element is indeed high as the markets for white goods are flooded with many substitutes and given the fact that consumer durables are often longer term purchases, companies like Samsung have to be careful in deciding on the appropriate marketing strategy. This is also the reason why many multinationals like Samsung often adopt differential pricing so as to attract consumers from across the income pyramid to wean them away from cheaper substitutes.  Further, this element also means that many emerging market consumers are yet to deepen their dependence on white goods and instead, prefer to the traditional forms of housework wherein they rely less on gadgets and appliances. However, this is rapidly changing as more women enter the workforce in these markets making it necessary for them to use gadgets and appliances.
  • 55.
    PEST Analysis • APESTEL analysis or PESTLE analysis (formerly known as PEST analysis) is a framework or tool used to analyze and monitor the macro- environmental factors that may have a profound impact on an organization's performance
  • 56.
    Political factors  Governmentstability/instability  Corruption level  Tax policies  Freedom of press  Government regulation and deregulation  Special tariffs  Political action committees  Government involvement in trade unions and agreements  Competition regulation  Voter participation rates  Amount of government protests  Defense expenditures  Level of government subsidies  Bilateral relationships  Import-export regulation/resctrictions  Trade control  Lobbying activities  Size of government budgets
  • 57.
    Economic factors  Growthrate  Interest rate  Inflation rate  Exchange rate  Availability of credit  Level of income  Propensity of people to spend  Federal government budget deficits  Gross domestic product trend  Unemployment trend  Stock market trends  Price fluctuations
  • 58.
    Social factors  Populationsize and growth rate  Birth rates  Death rates  Number of marriages  Number of divorces  Immigration and emigration rates  Life expectancy rates  Age distribution  Wealth distribution  Social classes  Per capita income  Family size and structure  Lifestyles  Health consciousness  Average disposable income  Attitude towards government  Attitude towards work  Buying habits  Ethical concerns  Cultural norms and values  Religion and beliefs  Racial equality  Use of birth control  Education level
  • 59.
    Technological factors  Technologyincentives  Automation  R&D activity  Technological change  Access to new technology  Level of innovation  Technological awareness  Internet infrastructure  Communication infrastructure  Life cycle of technology
  • 60.
    Environmental factors  Weather Climate  Environmental policies  Climate change  Pressures from NGO’s  Natural disasters  Air and water pollution  Recycling standards  Attitudes towards green products  Support for renewable energy
  • 61.
    Legal factors  Discriminationlaws  Antitrust laws  Employment laws  Consumer protection laws  Copyright and patent laws  Health and safety laws  Education laws  Consumer protection laws  Data protection laws
  • 62.
     Key internalforces (such as knowledge and competence of management and workforce) and external forces (such as the economy, competitors, technology) that trigger the change of strategy in an organization.  Driving forces in an industry are the major underlying causes of changing industry and competitive conditions.  The internal and external factors that persuade the decisions and policies an organization makes to keep on competitive.  Internal forces include core capabilities, employee turnover, product, and technological innovation  External forces include economic conditions, competition, demographic changes, technological evolution, social trends, local and national politics, and environmental issues. Industry Driving Forces
  • 63.
    Industry driving forces TheInternet and new e-commerce opportunities and threats it breeds in the industry Increasing globalization of the industry Changes in the long-run industry growth rate Changes in who buys the products and how they use it Product innovation Technological change Market innovation Entry or exit of major firms Diffusion of technical know-how across more companies and more countries Changes in cost and efficiency Growing buyer for preferences for differentiated products instead of a commodity product (or for a more standardized product instead of strongly differentiated products) Regulatory influences and government policy changes Changing societal concerns; attitudes, and lifestyles Reductions in uncertainty and business risk
  • 66.
    Strategic group mapping •Strategic group mapping is a method to display the position that rival organizations hold in a competitive industry. • In a strategic group mapping example, variables such as price, product-line breadth or area of operations are represented • Strategic group maps are visual representations of the industry that aid in decision making. It’s constructed in the form of a graph, by assigning variables to each axis. Strategic group map analysis reveals the competitive nature of the strategic groups in the industry.
  • 67.
    Purpose Of StrategyGroup Mapping They Can Better Identify Barriers To Entry And Exit It Can Help Decide Which Strategic Group An Organization Should Consider Entering It Helps Identify Strategic Areas That Can Help Gain Benefits It Shows The Organization’s Position In The Industry Compared To Its Competitors It Identifies The Best Organizations In The Industry It Pinpoints Industry Rivals
  • 68.
    There are foursteps to construct a strategic group map: Identify the competitive variables that distinguish companies Plot firms on a two-variable map with pairs of characteristics Assign companies to the strategic groups Draw circles around each strategic group.