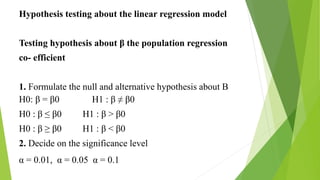
1) The document discusses hypothesis testing about linear regression models. It defines linear regression and describes testing hypotheses about the population regression coefficient β.
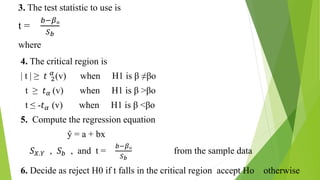
2) It provides the steps to test hypotheses about β, which include formulating the null and alternative hypotheses, choosing a significance level, determining the test statistic and critical region, computing the regression equation from sample data, and deciding whether to reject or accept the null hypothesis.
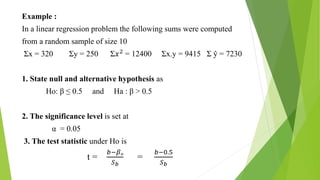
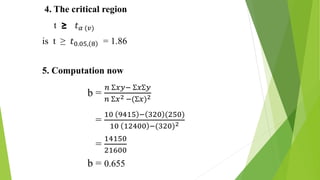
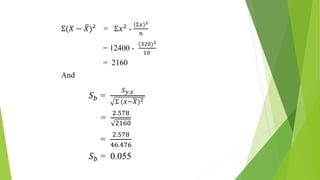
3) An example is shown testing the hypothesis H0: β ≤ 0.5 vs Ha: β > 0.5 using sample data, computing the test statistic t and concluding the null hypothesis is rejected since t falls in the critical region.