Download to read offline
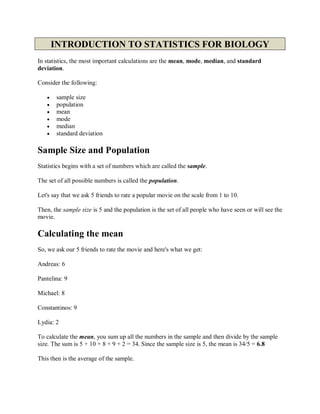


This document provides an introduction to key statistical concepts for biology, including mean, mode, median, and standard deviation. It defines sample size and population, and gives examples of calculating each statistical measure using a sample of movie ratings from 5 friends. The mean is the average, the mode is the most frequent value, the median is the middle value when numbers are ordered, and the standard deviation measures how spread out values are from the mean.