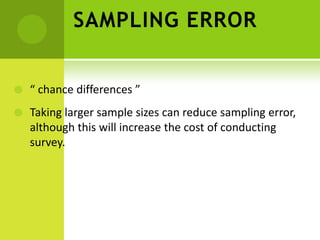
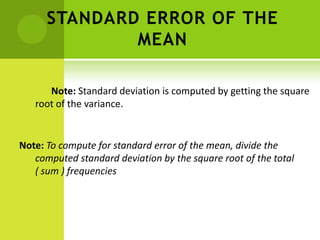
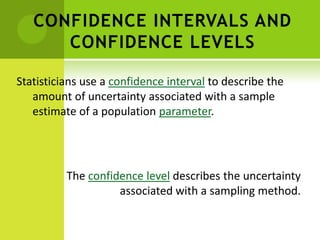
Prepared by:
Walter Phillip SP. Palad, R.N.
STATISTICS
SAMPLING METHODS
 Sample
 Population
 Target population
4 BASIC REASONS FOR THE
USE OF SAMPLES
greater speed.
reduce cost.
greater accuracy.
greater scope.
TYPES OF SAMPLING
METHODS:
PROBABILITY SAMPLING
 use some form of random selection
 equal probabilities of being selected
 there is an “OBJECTIVE” way of assessing reliability of result.
NON PROBABILITY SAMPLING
 the sample is not a proportion of the population and there is
no system in selecting sample.
 the selection depends on the situation
PROBABILITY
SAMPLING
 Pure/ Simple Random Sampling
( Lottery sampling or Fishbowl
Method )
 equal chance of being selected.
 Systematic Sampling ( Restricted
Random Sampling )
 alphabetical arrangement,
residential or house arrays,
geographical placement, etc.
 e.g. 20% of sample size. If 100%
is divided by 20%, then the result
is 5, so every 5th name will be
taken from the population.
 Stratified Random Sampling
 grouped in to a more or less homogenous classes
 CLASSIFICATION: Horizontal and Vertical
 Horizontal: BSED, BSN, BSHRM at same year
 Vertical: 1st year, 2nd year, 3rd year and 4th year or Age 10,
11, 12, etc.
 Cluster Sampling ( Area Sampling )
 heterogonous individual
 used when population is very large and wide (community)
NON PROBABILITY SAMPLING
 the sample is not a proportion of the
population and there is no system in
selecting sample.
 the selection depends on the situation
 Purposive Sampling
 Convenience Sampling
 Quota Sampling
 Accidental Sampling
SAMPLING ERROR
 “ chance differences ”
 Taking larger sample sizes can reduce sampling error,
although this will increase the cost of conducting
survey.
STANDARD ERROR OF THE
MEAN
Note: Standard deviation is computed by getting the square
root of the variance.
Note: To compute for standard error of the mean, divide the
computed standard deviation by the square root of the total
( sum ) frequencies
CONFIDENCE INTERVALS AND
CONFIDENCE LEVELS
Statisticians use a confidence interval to describe the
amount of uncertainty associated with a sample
estimate of a population parameter.
The confidence level describes the uncertainty
associated with a sampling method.
EXAMPLE
1. A sample of 16 students is taken. The
average age in the sample was 22 years with
a standard deviation of 6 years. Construct a
95 % confidence interval for the average age
of the population.
2. A sample of 100 bean cans showed an
average weight of 13 ounces with a standard
deviation of 0.8 ounces. Construct a 90%
confidence interval for the mean of the
population.
PRACTICE SET:
1. Construct a 90% confidence for the population
mean, m. Assume the population has a normal
distribution. In a recent study of 22 eighth graders,
the mean number of hours per week that they
watched television was 19.6 with a standard
deviation of 5.8 hours.
2. A random sample of 40 students has a
mean annual earnings of $3120 and a
standard deviation of $677. Construct the
90% confidence interval for the population.

Statistics

  • 1.
    Prepared by: Walter PhillipSP. Palad, R.N. STATISTICS
  • 2.
    SAMPLING METHODS  Sample Population  Target population
  • 3.
    4 BASIC REASONSFOR THE USE OF SAMPLES greater speed. reduce cost. greater accuracy. greater scope.
  • 4.
    TYPES OF SAMPLING METHODS: PROBABILITYSAMPLING  use some form of random selection  equal probabilities of being selected  there is an “OBJECTIVE” way of assessing reliability of result. NON PROBABILITY SAMPLING  the sample is not a proportion of the population and there is no system in selecting sample.  the selection depends on the situation
  • 5.
    PROBABILITY SAMPLING  Pure/ SimpleRandom Sampling ( Lottery sampling or Fishbowl Method )  equal chance of being selected.  Systematic Sampling ( Restricted Random Sampling )  alphabetical arrangement, residential or house arrays, geographical placement, etc.  e.g. 20% of sample size. If 100% is divided by 20%, then the result is 5, so every 5th name will be taken from the population.
  • 6.
     Stratified RandomSampling  grouped in to a more or less homogenous classes  CLASSIFICATION: Horizontal and Vertical  Horizontal: BSED, BSN, BSHRM at same year  Vertical: 1st year, 2nd year, 3rd year and 4th year or Age 10, 11, 12, etc.  Cluster Sampling ( Area Sampling )  heterogonous individual  used when population is very large and wide (community)
  • 7.
    NON PROBABILITY SAMPLING the sample is not a proportion of the population and there is no system in selecting sample.  the selection depends on the situation
  • 8.
     Purposive Sampling Convenience Sampling  Quota Sampling  Accidental Sampling
  • 9.
    SAMPLING ERROR  “chance differences ”  Taking larger sample sizes can reduce sampling error, although this will increase the cost of conducting survey.
  • 10.
    STANDARD ERROR OFTHE MEAN Note: Standard deviation is computed by getting the square root of the variance. Note: To compute for standard error of the mean, divide the computed standard deviation by the square root of the total ( sum ) frequencies
  • 11.
    CONFIDENCE INTERVALS AND CONFIDENCELEVELS Statisticians use a confidence interval to describe the amount of uncertainty associated with a sample estimate of a population parameter. The confidence level describes the uncertainty associated with a sampling method.
  • 12.
    EXAMPLE 1. A sampleof 16 students is taken. The average age in the sample was 22 years with a standard deviation of 6 years. Construct a 95 % confidence interval for the average age of the population.
  • 13.
    2. A sampleof 100 bean cans showed an average weight of 13 ounces with a standard deviation of 0.8 ounces. Construct a 90% confidence interval for the mean of the population.
  • 14.
    PRACTICE SET: 1. Constructa 90% confidence for the population mean, m. Assume the population has a normal distribution. In a recent study of 22 eighth graders, the mean number of hours per week that they watched television was 19.6 with a standard deviation of 5.8 hours.
  • 15.
    2. A randomsample of 40 students has a mean annual earnings of $3120 and a standard deviation of $677. Construct the 90% confidence interval for the population.