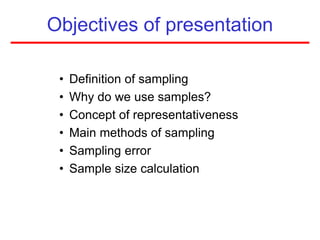
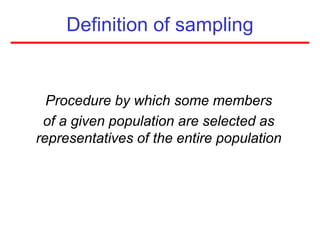
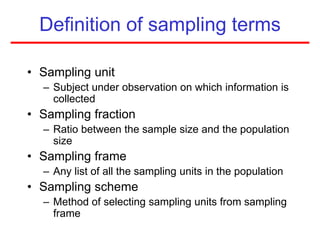
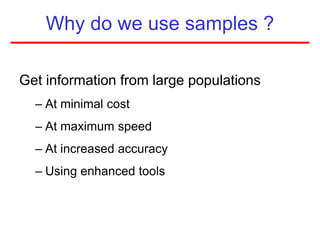
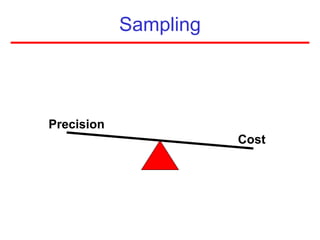
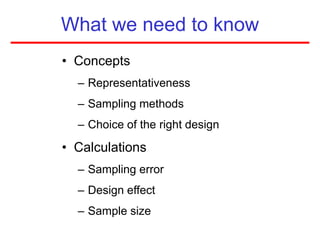
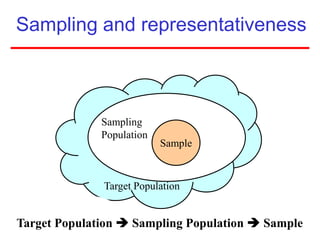
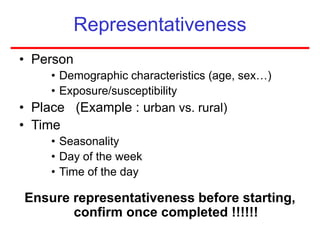
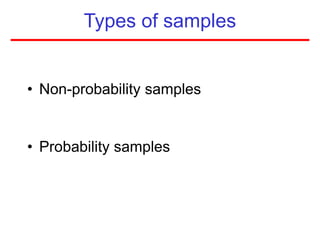
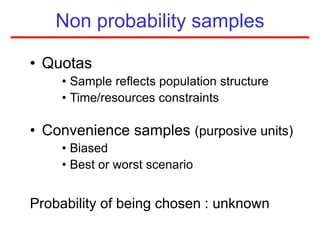
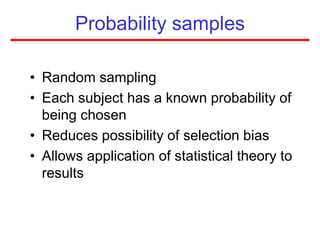
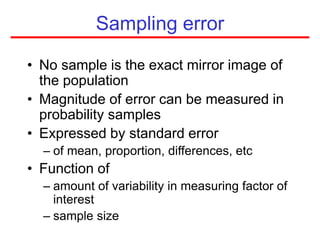
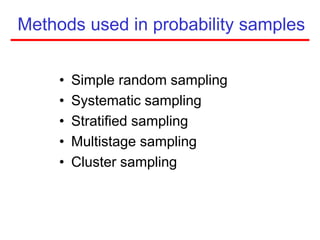
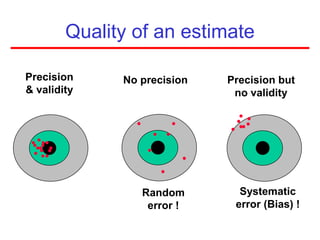
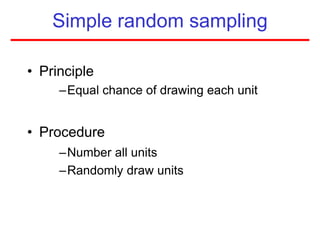
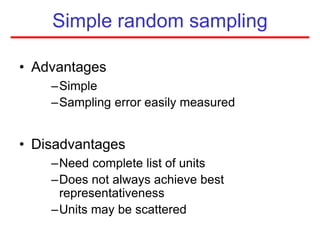
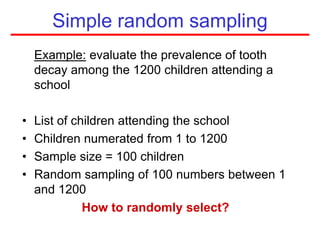
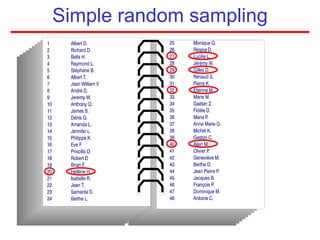
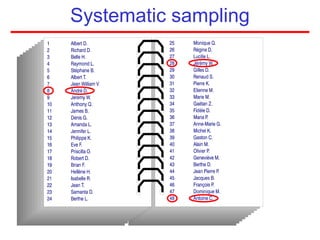
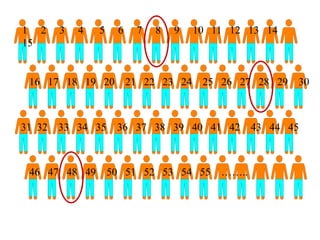
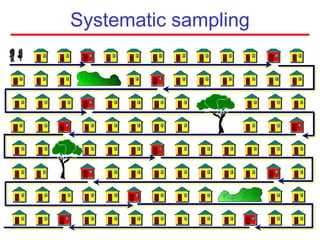
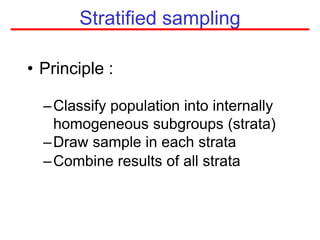
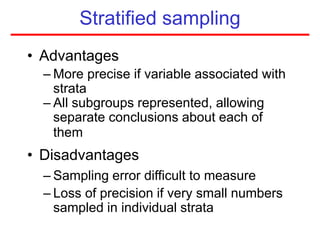
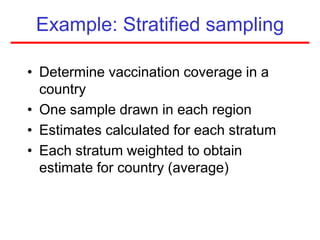
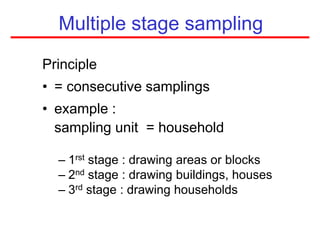
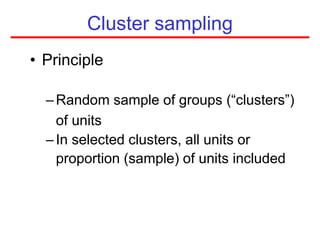
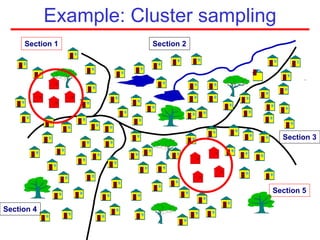
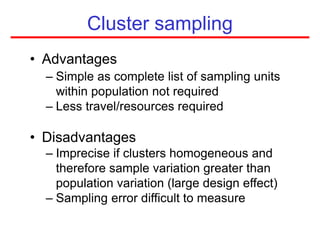
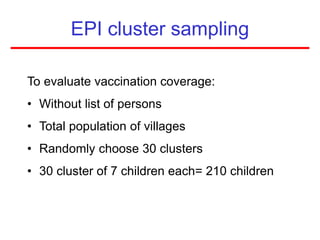
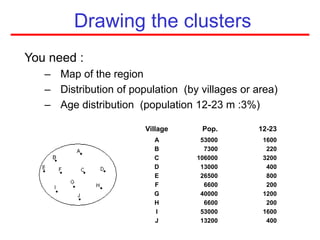
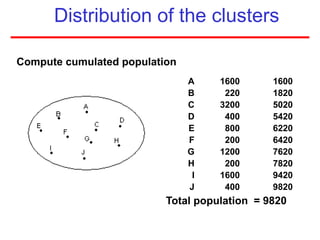
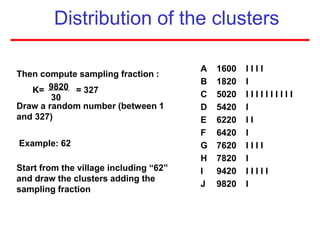
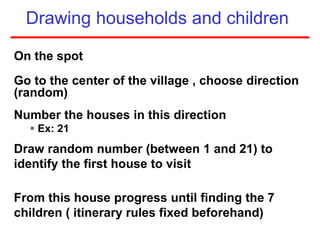
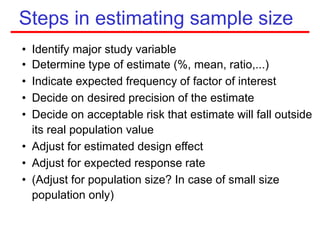
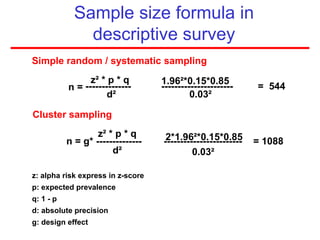
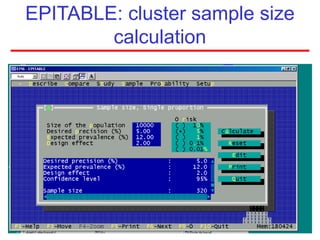
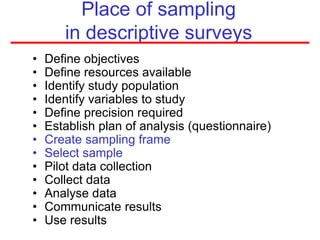
Design For Accessibility: Getting it right from the start
Â
12- Sampling.ppt
1. Sampling
Sources:
-EPIET Introductory course,
Thomas Grein, Denis Coulombier, Philippe Sudre, Mike Catchpole
-IDEA
Brigitte Helynck, Philippe Malfait, Institut de veille sanitaire
Modified: Denise Antona, EPIET 2003
2. Objectives of presentation
⢠Definition of sampling
⢠Why do we use samples?
⢠Concept of representativeness
⢠Main methods of sampling
⢠Sampling error
⢠Sample size calculation
3. Definition of sampling
Procedure by which some members
of a given population are selected as
representatives of the entire population
4. Definition of sampling terms
⢠Sampling unit
â Subject under observation on which information is
collected
⢠Sampling fraction
â Ratio between the sample size and the population
size
⢠Sampling frame
â Any list of all the sampling units in the population
⢠Sampling scheme
â Method of selecting sampling units from sampling
frame
5. Why do we use samples ?
Get information from large populations
â At minimal cost
â At maximum speed
â At increased accuracy
â Using enhanced tools
7. What we need to know
⢠Concepts
â Representativeness
â Sampling methods
â Choice of the right design
⢠Calculations
â Sampling error
â Design effect
â Sample size
9. Representativeness
⢠Person
⢠Demographic characteristics (age, sexâŚ)
⢠Exposure/susceptibility
⢠Place (Example : urban vs. rural)
⢠Time
⢠Seasonality
⢠Day of the week
⢠Time of the day
Ensure representativeness before starting,
confirm once completed !!!!!!
11. Non probability samples
⢠Quotas
⢠Sample reflects population structure
⢠Time/resources constraints
⢠Convenience samples (purposive units)
⢠Biased
⢠Best or worst scenario
Probability of being chosen : unknown
12. Probability samples
⢠Random sampling
⢠Each subject has a known probability of
being chosen
⢠Reduces possibility of selection bias
⢠Allows application of statistical theory to
results
13. Sampling error
⢠No sample is the exact mirror image of
the population
⢠Magnitude of error can be measured in
probability samples
⢠Expressed by standard error
â of mean, proportion, differences, etc
⢠Function of
â amount of variability in measuring factor of
interest
â sample size
14. Methods used in probability samples
⢠Simple random sampling
⢠Systematic sampling
⢠Stratified sampling
⢠Multistage sampling
⢠Cluster sampling
15. Quality of an estimate
Precision
& validity
No precision
Random
error !
Precision but
no validity
Systematic
error (Bias) !
16. Simple random sampling
⢠Principle
âEqual chance of drawing each unit
⢠Procedure
âNumber all units
âRandomly draw units
17. Simple random sampling
⢠Advantages
âSimple
âSampling error easily measured
⢠Disadvantages
âNeed complete list of units
âDoes not always achieve best
representativeness
âUnits may be scattered
18. Example: evaluate the prevalence of tooth
decay among the 1200 children attending a
school
⢠List of children attending the school
⢠Children numerated from 1 to 1200
⢠Sample size = 100 children
⢠Random sampling of 100 numbers between 1
and 1200
How to randomly select?
Simple random sampling
23. Systematic sampling
⢠N = 1200, and n = 60
ď sampling fraction = 1200/60 = 20
⢠List persons from 1 to 1200
⢠Randomly select a number between 1 and
20 (ex : 8)
ď 1st person selected = the 8th on the
list
ď 2nd person = 8 + 20 = the 28th
etc .....
27. Stratified sampling
⢠Principle :
âClassify population into internally
homogeneous subgroups (strata)
âDraw sample in each strata
âCombine results of all strata
28. Stratified sampling
⢠Advantages
â More precise if variable associated with
strata
â All subgroups represented, allowing
separate conclusions about each of
them
⢠Disadvantages
â Sampling error difficult to measure
â Loss of precision if very small numbers
sampled in individual strata
29. Example: Stratified sampling
⢠Determine vaccination coverage in a
country
⢠One sample drawn in each region
⢠Estimates calculated for each stratum
⢠Each stratum weighted to obtain
estimate for country (average)
30. Multiple stage sampling
Principle
⢠= consecutive samplings
⢠example :
sampling unit = household
â 1rst stage : drawing areas or blocks
â 2nd stage : drawing buildings, houses
â 3rd stage : drawing households
33. Cluster sampling
⢠Advantages
â Simple as complete list of sampling units
within population not required
â Less travel/resources required
⢠Disadvantages
â Imprecise if clusters homogeneous and
therefore sample variation greater than
population variation (large design effect)
â Sampling error difficult to measure
34. EPI cluster sampling
To evaluate vaccination coverage:
⢠Without list of persons
⢠Total population of villages
⢠Randomly choose 30 clusters
⢠30 cluster of 7 children each= 210 children
35. Drawing the clusters
You need :
â Map of the region
â Distribution of population (by villages or area)
â Age distribution (population 12-23 m :3%)
1600
220
3200
400
800
200
1200
200
1600
400
53000
7300
106000
13000
26500
6600
40000
6600
53000
13200
A
B
C
D
E
F
G
H
I
J
12-23
Pop.
Village
36. Distribution of the clusters
A
B
C
D
E
F
G
H
I
J
1600
220
3200
400
800
200
1200
200
1600
400
1600
1820
5020
5420
6220
6420
7620
7820
9420
9820
Total population = 9820
Compute cumulated population
37. Distribution of the clusters
Then compute sampling fraction :
K= = 327
Draw a random number (between 1
and 327)
Example: 62
Start from the village including â62â
and draw the clusters adding the
sampling fraction
9820
30
A
B
C
D
E
F
G
H
I
J
1600
1820
5020
5420
6220
6420
7620
7820
9420
9820
I I I I
I
I I I I I I I I I I
I
I I
I
I I I I
I
I I I I I
I
38. Drawing households and children
On the spot
Go to the center of the village , choose direction
(random)
Number the houses in this direction
ď§ Ex: 21
Draw random number (between 1 and 21) to
identify the first house to visit
From this house progress until finding the 7
children ( itinerary rules fixed beforehand)
40. Selecting a sampling method
⢠Population to be studied
â Size/geographical distribution
â Heterogeneity with respect to variable
⢠Level of precision required
⢠Resources available
⢠Importance of having a precise estimate
of the sampling error
41. Steps in estimating sample size
⢠Identify major study variable
⢠Determine type of estimate (%, mean, ratio,...)
⢠Indicate expected frequency of factor of interest
⢠Decide on desired precision of the estimate
⢠Decide on acceptable risk that estimate will fall outside
its real population value
⢠Adjust for estimated design effect
⢠Adjust for expected response rate
⢠(Adjust for population size? In case of small size
population only)
42. Sample size formula in
descriptive survey
z: alpha risk express in z-score
p: expected prevalence
q: 1 - p
d: absolute precision
g: design effect
z² * p * q 1.96²*0.15*0.85
n = -------------- ---------------------- = 544
d² 0.03²
Cluster sampling
z² * p * q 2*1.96²*0.15*0.85
n = g* -------------- ------------------------ = 1088
d² 0.03²
Simple random / systematic sampling
44. Place of sampling
in descriptive surveys
⢠Define objectives
⢠Define resources available
⢠Identify study population
⢠Identify variables to study
⢠Define precision required
⢠Establish plan of analysis (questionnaire)
⢠Create sampling frame
⢠Select sample
⢠Pilot data collection
⢠Collect data
⢠Analyse data
⢠Communicate results
⢠Use results