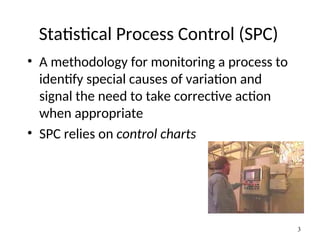
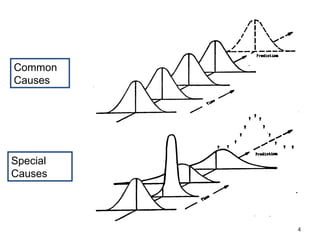
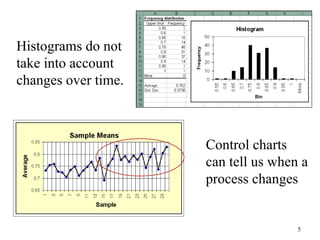
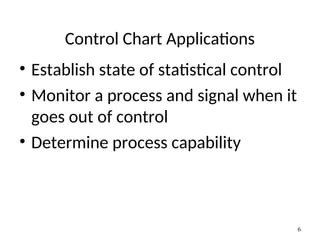
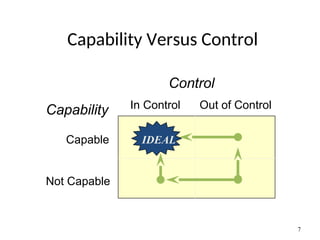
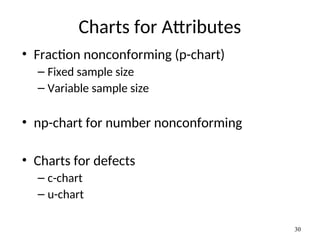
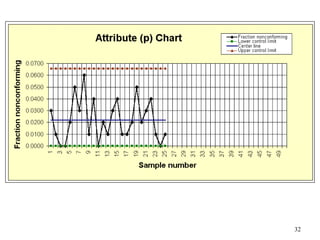
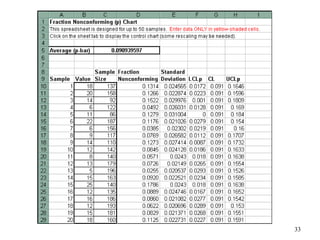
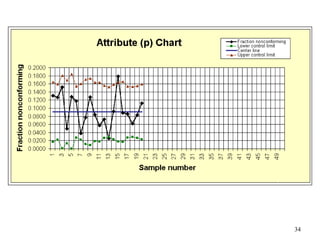
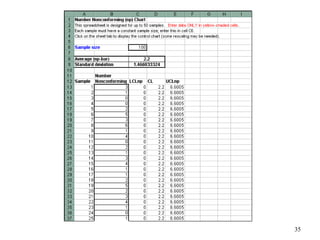
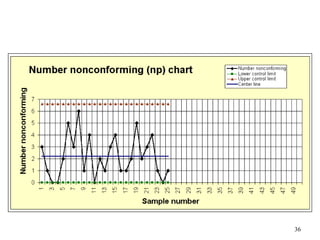
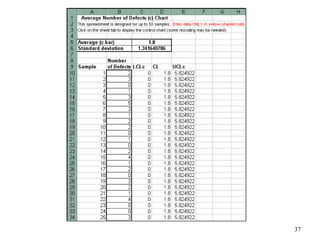
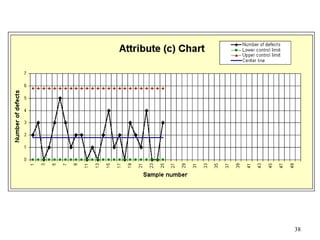
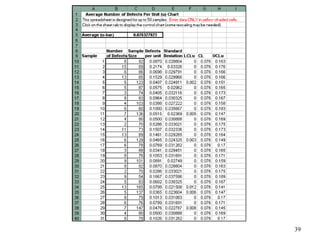
Module 12
Statistical Process Control
1
Quiz
Accuracy:
The degree of closeness of measurements of
a quantity to that quantity's actual (true)
value.
Precision:
The degree to which repeated measurements
under unchanged conditions show the same
results.
2
Statistical Process Control (SPC)
• A methodology for monitoring a process to
identify special causes of variation and
signal the need to take corrective action
when appropriate
• SPC relies on control charts
3
4
Common
Causes
Special
Causes
5
Histograms do not
take into account
changes over time.
Control charts
can tell us when a
process changes
Control Chart Applications
• Establish state of statistical control
• Monitor a process and signal when it
goes out of control
• Determine process capability
6
Capability Versus Control
7
Control
Capability
Capable
Not Capable
In Control Out of Control
IDEAL
Commonly Used Control Charts
• Variables data
– x-bar and R-charts
– x-bar and s-charts
– Charts for individuals (x-charts)
• Attribute data
– For “defectives” (p-chart, np-chart)
– For “defects” (c-chart, u-chart)
8
Developing Control Charts
1. Prepare
– Choose measurement
– Determine how to collect data, sample size,
and frequency of sampling
– Set up an initial control chart
2. Collect Data
– Record data
– Calculate appropriate statistics
– Plot statistics on chart
9
10
Next Steps
3. Determine trial control limits
– Center line (process average)
– Compute UCL, LCL
4. Analyze and interpret results
– Determine if in control
– Eliminate out-of-control points
– Recompute control limits as necessary
11
12
13
14
15
Typical Out-of-Control Patterns
• Point outside control limits
• Sudden shift in process average
• Cycles
• Trends
• Hugging the center line
• Hugging the control limits
• Instability
16
Shift in Process Average
17
Identifying Potential Shifts
18
Cycles
19
Trend
20
Final Steps
5. Use as a problem-solving tool
– Continue to collect and plot data
– Take corrective action when
necessary
6. Compute process capability
21
Process Capability Calculations
22
Excel Template
23
24
Special Variables Control Charts
• x-bar and s charts
• x-chart for individuals
25
26
27
28
29
Charts for Attributes
• Fraction nonconforming (p-chart)
– Fixed sample size
– Variable sample size
• np-chart for number nonconforming
• Charts for defects
– c-chart
– u-chart
30
31
32
33
34
35
36
37
38
39
40
Control Chart Selection
41
Quality Characteristic
variable attribute
n>1?
n>=10 or
computer?
x and MR
no
yes
x and s
x and R
no
yes
defective defect
constant
sample
size?
p-chart with
variable sample
size
no
p or
np
yes constant
sampling
unit?
c u
yes no
Control Chart Design Issues
• Basis for sampling
• Sample size
• Frequency of sampling
• Location of control limits
42
43
Pre-Control
44
nominal
value
Green Zone
Yellow Zones
Red
Zone
Red
Zone
LTL UTL
SPC Implementation Requirements
• Top management commitment
• Project champion
• Initial workable project
• Employee education and training
• Accurate measurement system
45

Module12.ppt Statistical process control