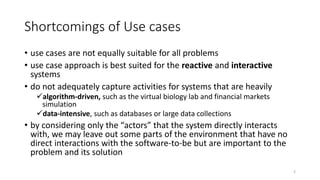
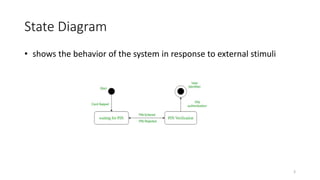
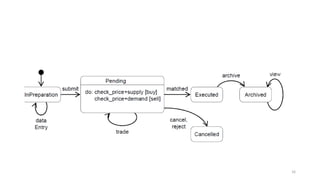
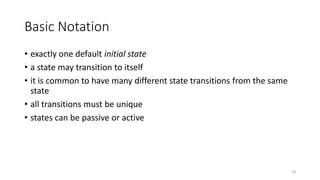
State Diagram
Prepared by
Md. Shafiuzzaman
Shortcomings of Use cases
• use cases are not equally suitable for all problems
• use case approach is best suited for the reactive and interactive
systems
• do not adequately capture activities for systems that are heavily
algorithm-driven, such as the virtual biology lab and financial markets
simulation
data-intensive, such as databases or large data collections
• by considering only the “actors” that the system directly interacts
with, we may leave out some parts of the environment that have no
direct interactions with the software-to-be but are important to the
problem and its solution
2
State Diagram
• shows the behavior of the system in response to external stimuli
3
State vs Activity
Activity
illustrates processes that are
executed in the system that
change the state of objects
State
shows the actual changes in state,
not the processes or commands
that created those changes
4
Basic components of a state
diagram
5
6
7
8
9
10
11
12
13
Steps to draw a state diagram
• Identify the initial state and the final terminating states.
• Identify the possible states in which the object can exist (boundary
values corresponding to different attributes guide us in identifying
different states).
• Label the events which trigger these transitions.
14
15
16
17
Basic Notation
• exactly one default initial state
• a state may transition to itself
• it is common to have many different state transitions from the same
state
• all transitions must be unique
• states can be passive or active
18

State diagram

  • 1.
  • 2.
    Shortcomings of Usecases • use cases are not equally suitable for all problems • use case approach is best suited for the reactive and interactive systems • do not adequately capture activities for systems that are heavily algorithm-driven, such as the virtual biology lab and financial markets simulation data-intensive, such as databases or large data collections • by considering only the “actors” that the system directly interacts with, we may leave out some parts of the environment that have no direct interactions with the software-to-be but are important to the problem and its solution 2
  • 3.
    State Diagram • showsthe behavior of the system in response to external stimuli 3
  • 4.
    State vs Activity Activity illustratesprocesses that are executed in the system that change the state of objects State shows the actual changes in state, not the processes or commands that created those changes 4
  • 5.
    Basic components ofa state diagram 5
  • 6.
  • 7.
  • 8.
  • 9.
  • 10.
  • 11.
  • 12.
  • 13.
  • 14.
    Steps to drawa state diagram • Identify the initial state and the final terminating states. • Identify the possible states in which the object can exist (boundary values corresponding to different attributes guide us in identifying different states). • Label the events which trigger these transitions. 14
  • 15.
  • 16.
  • 17.
  • 18.
    Basic Notation • exactlyone default initial state • a state may transition to itself • it is common to have many different state transitions from the same state • all transitions must be unique • states can be passive or active 18