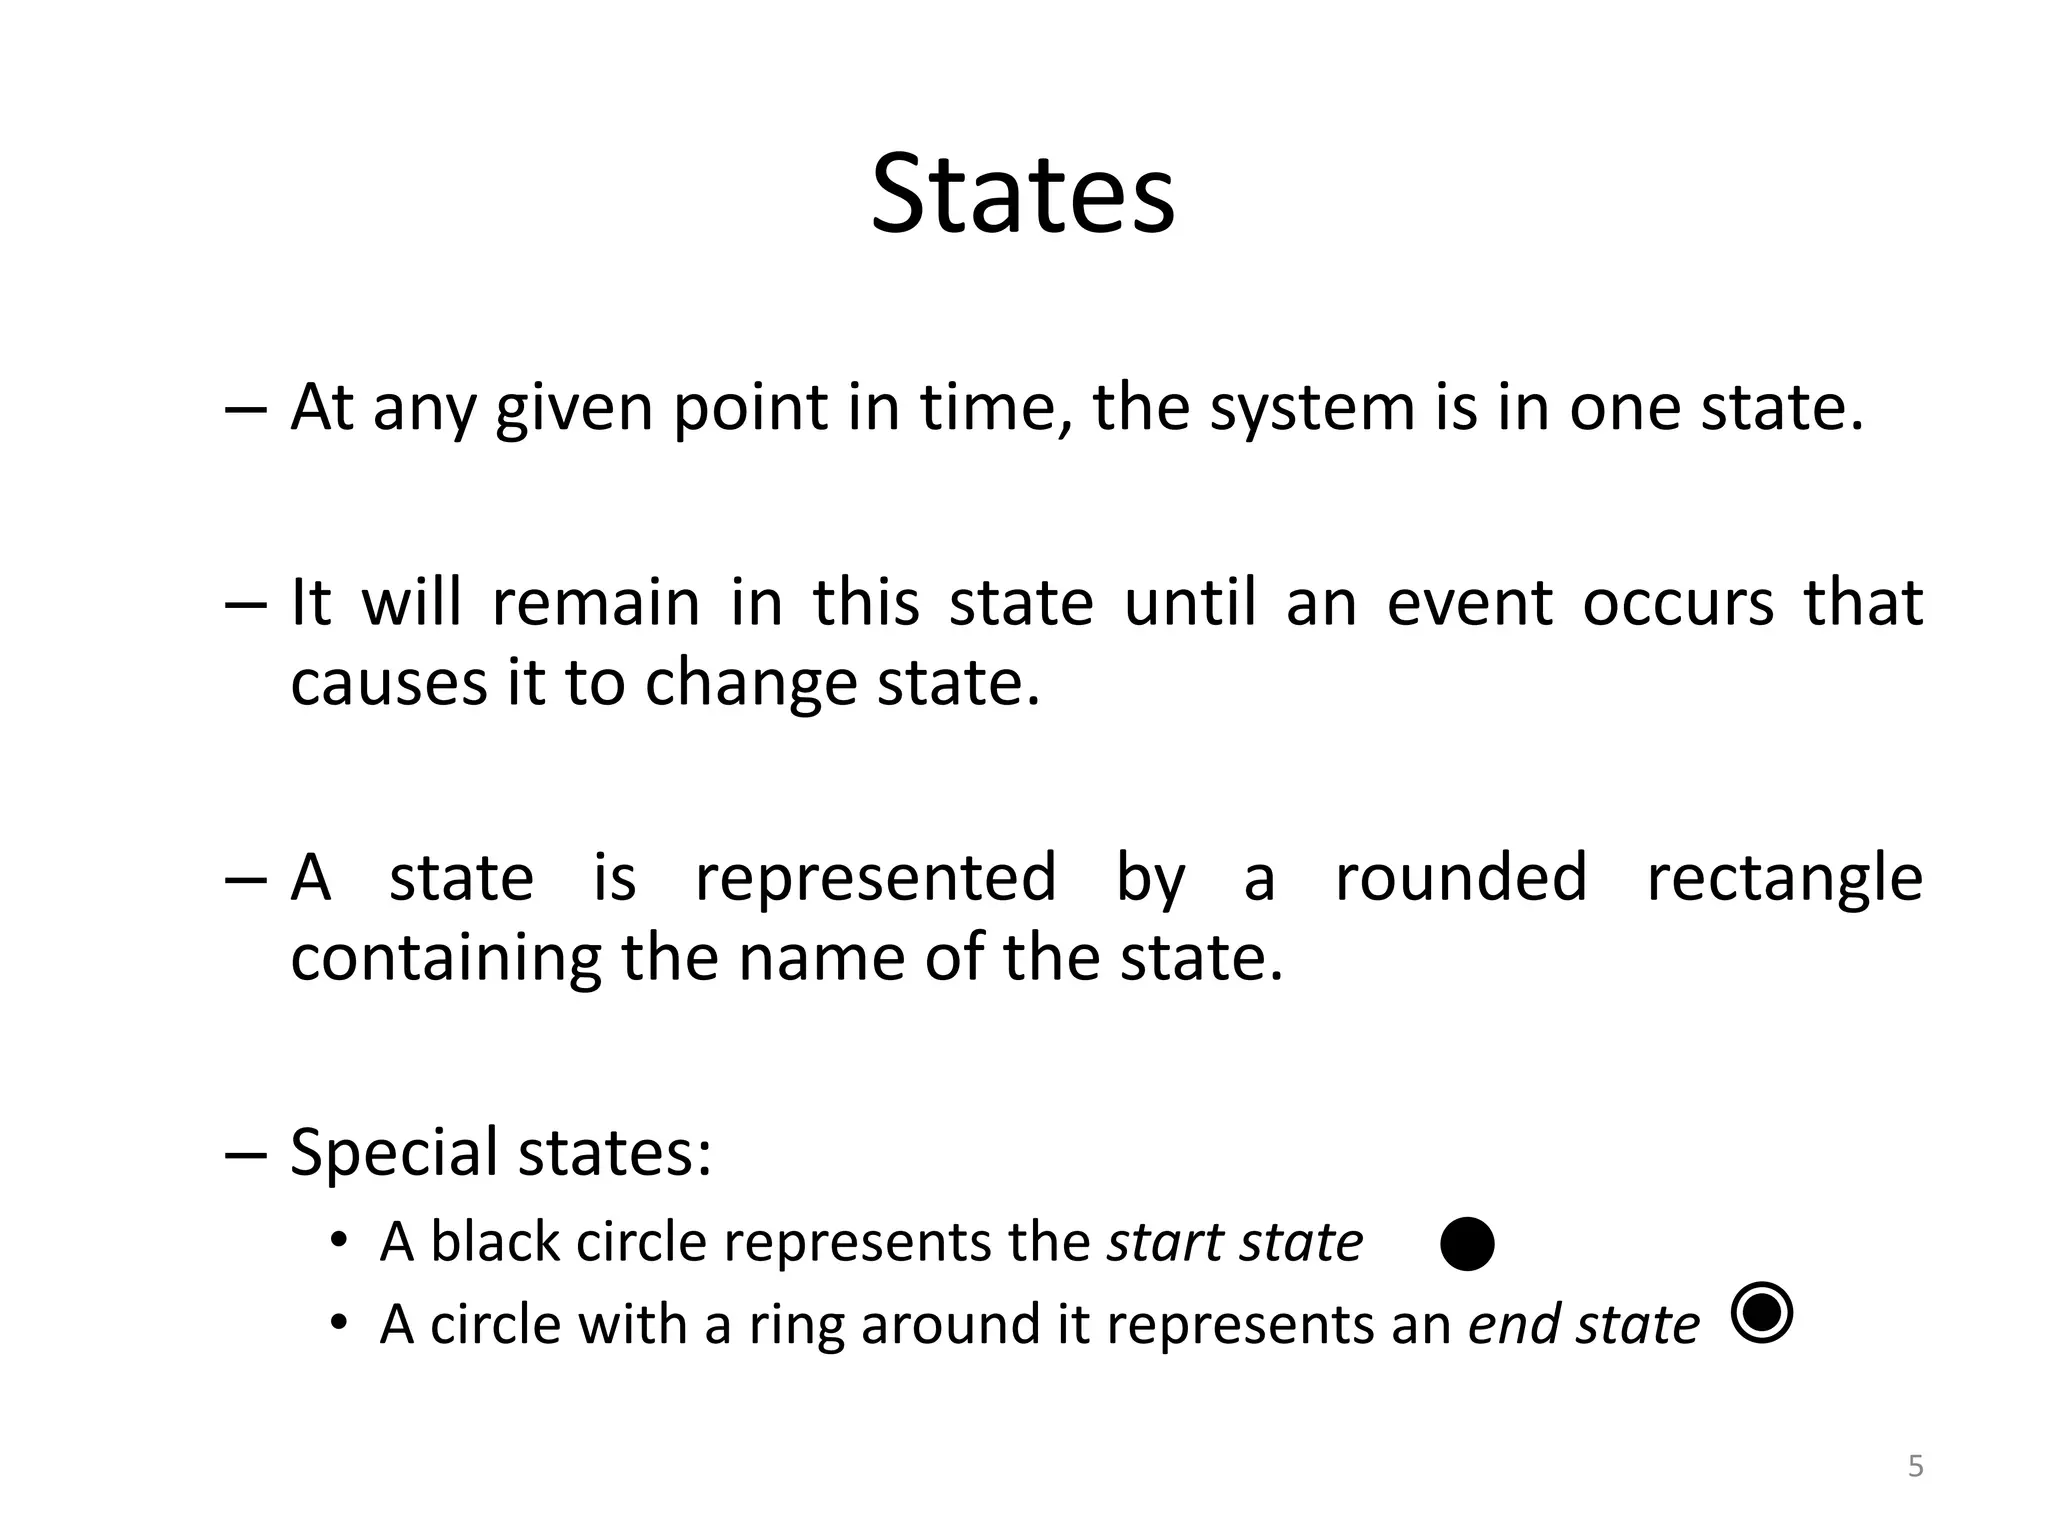
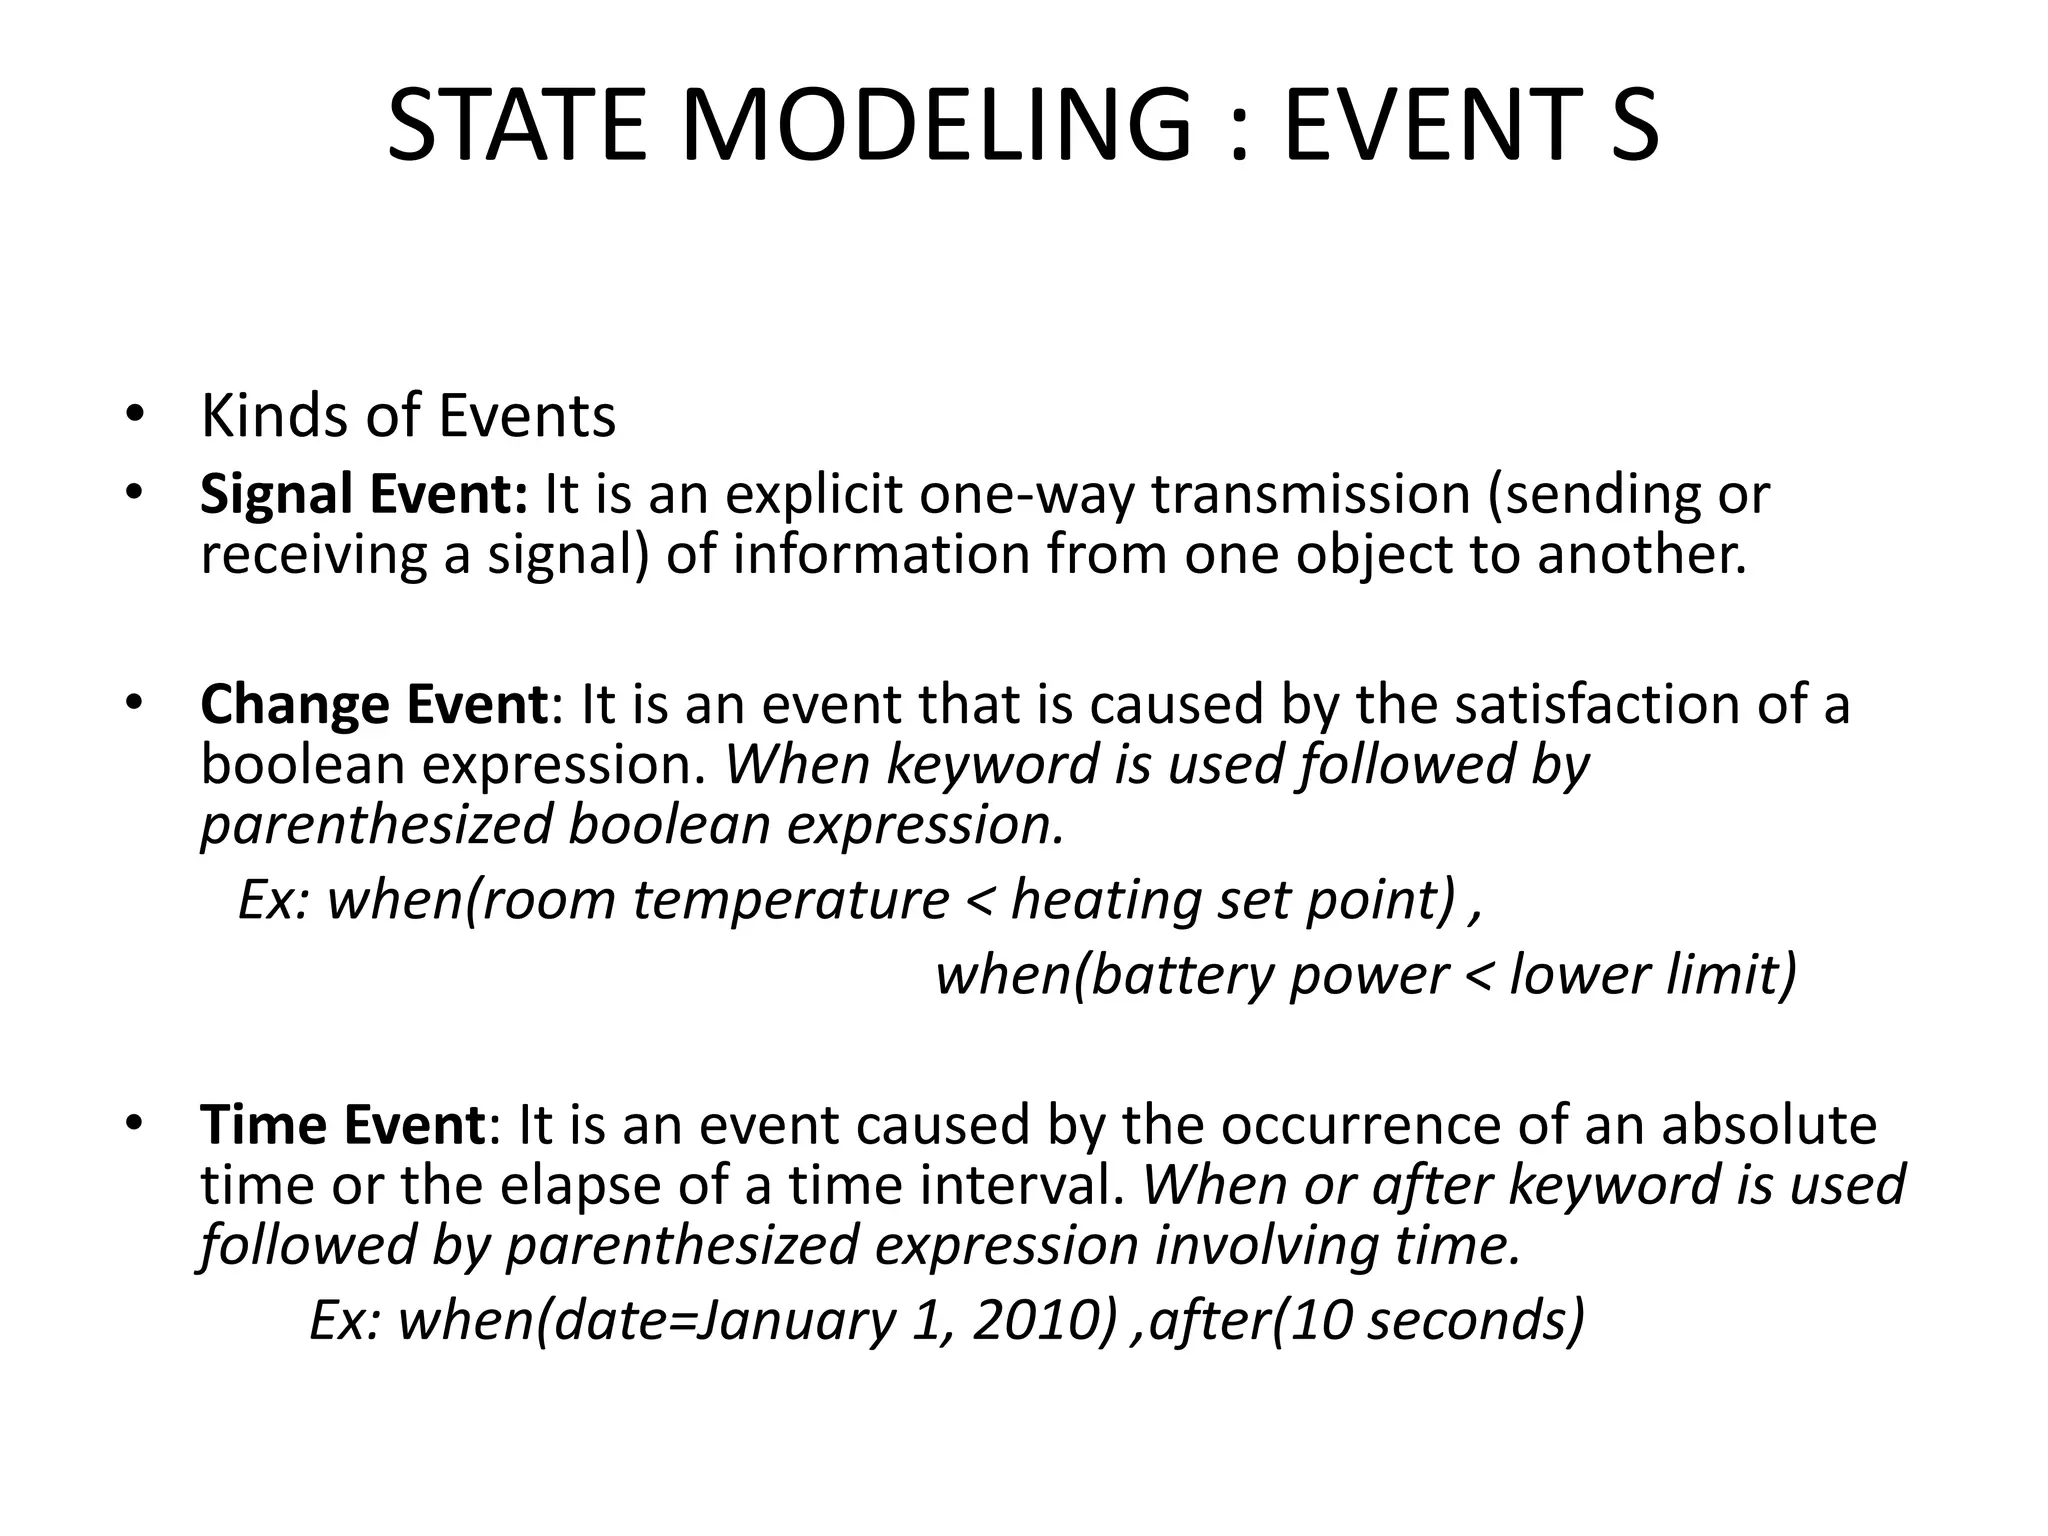
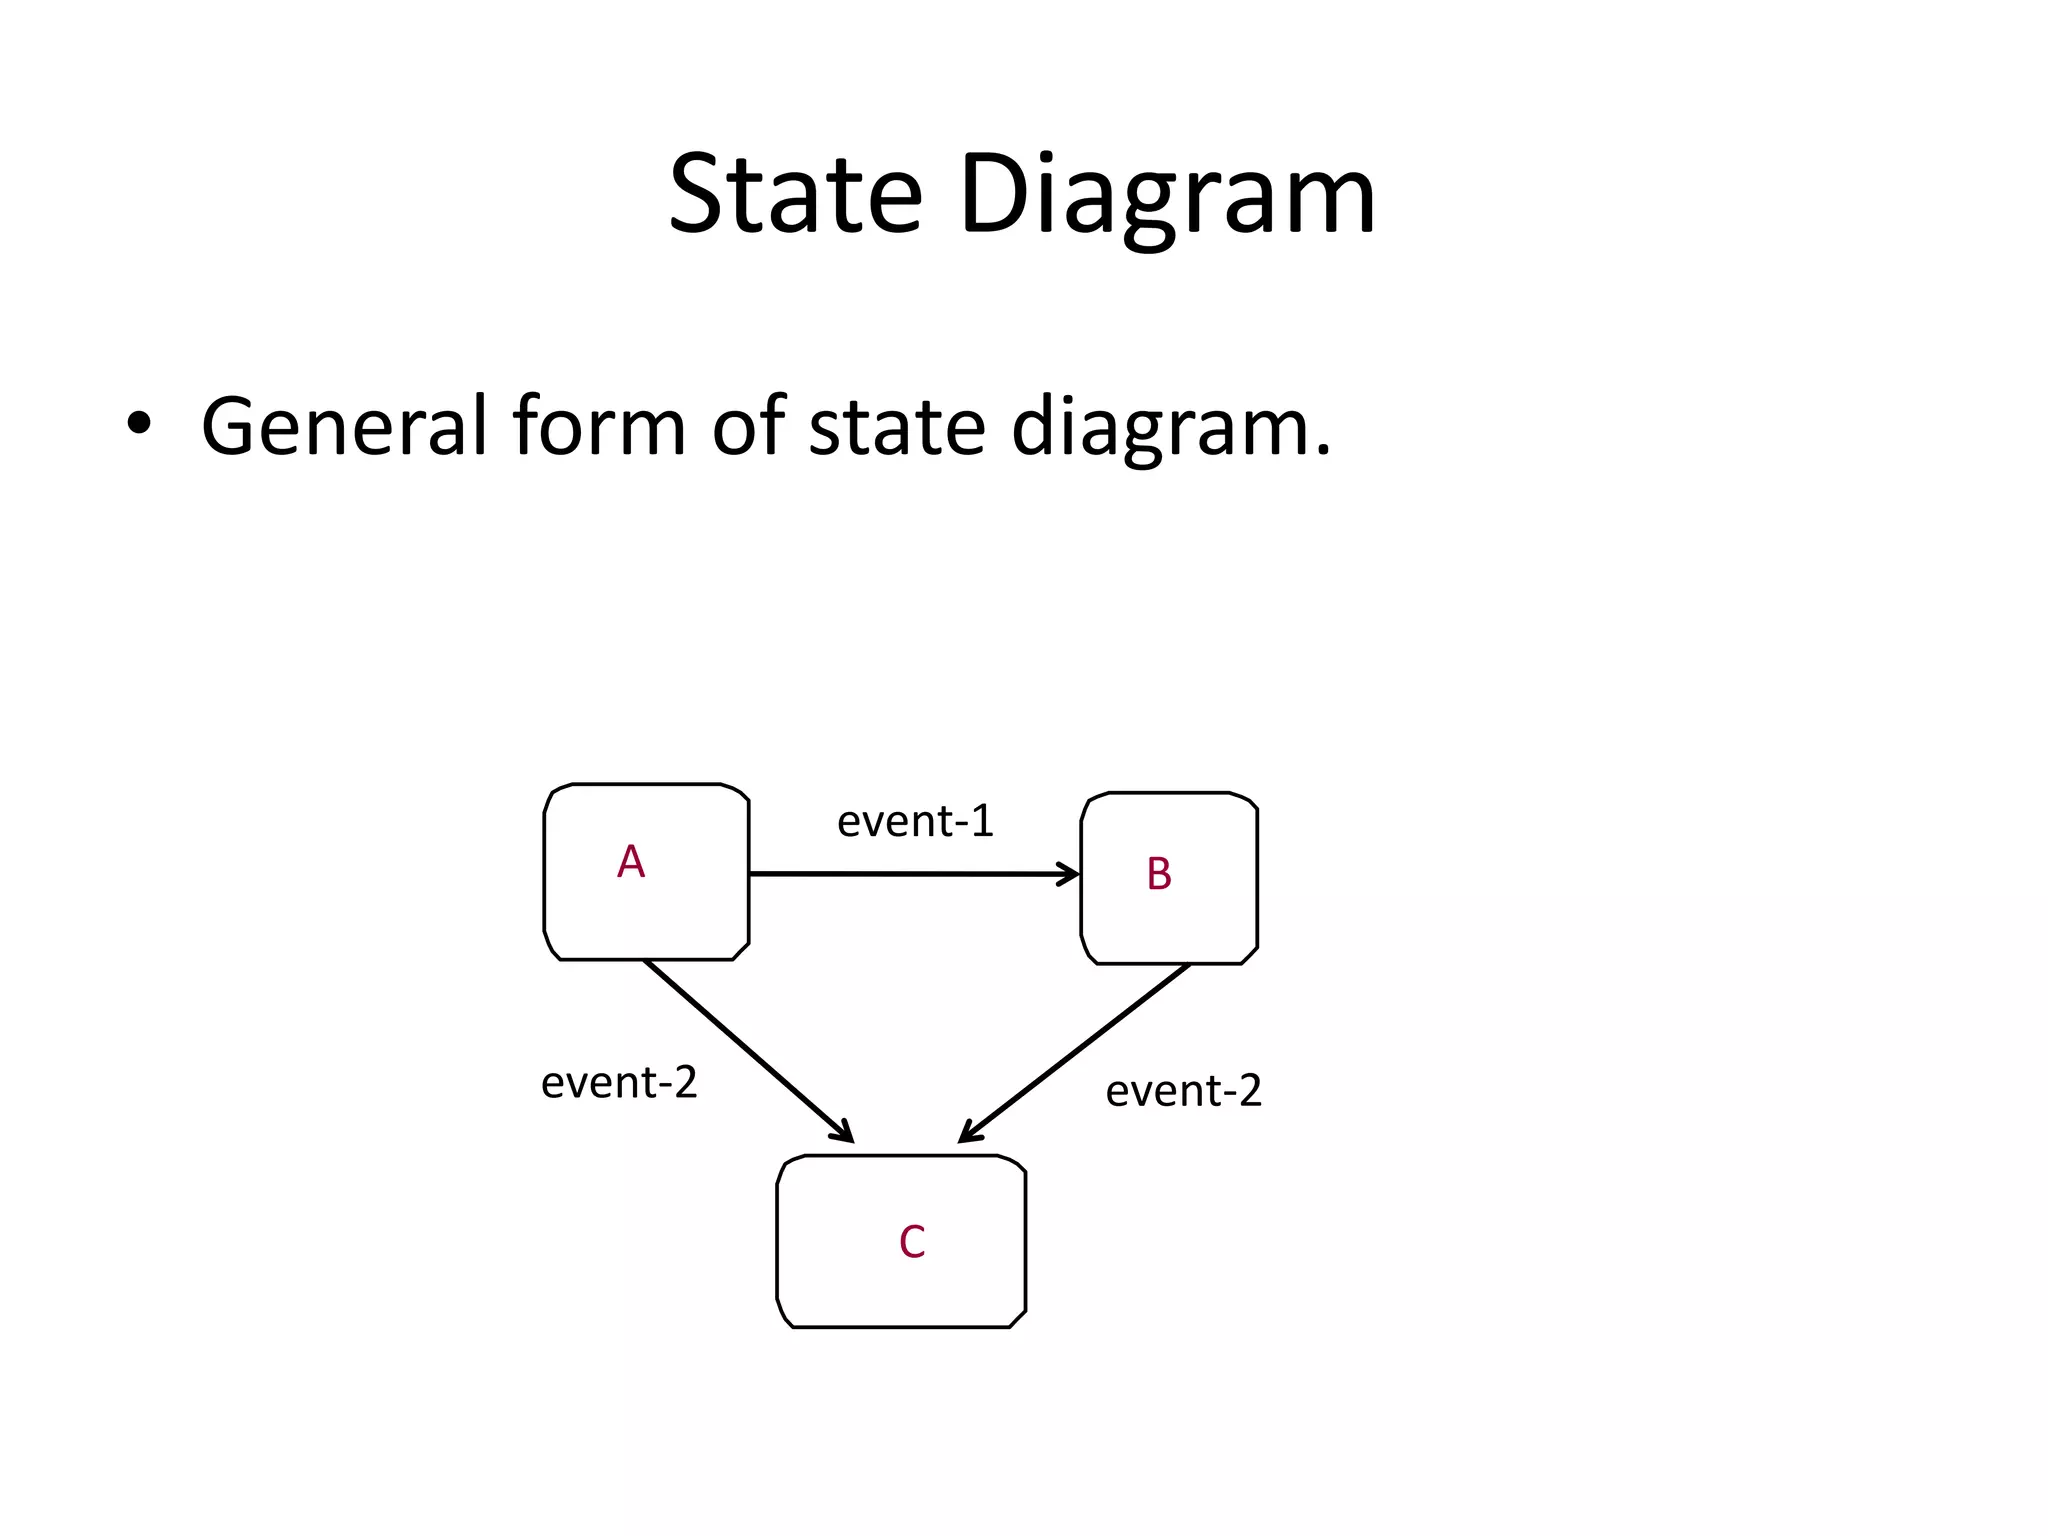
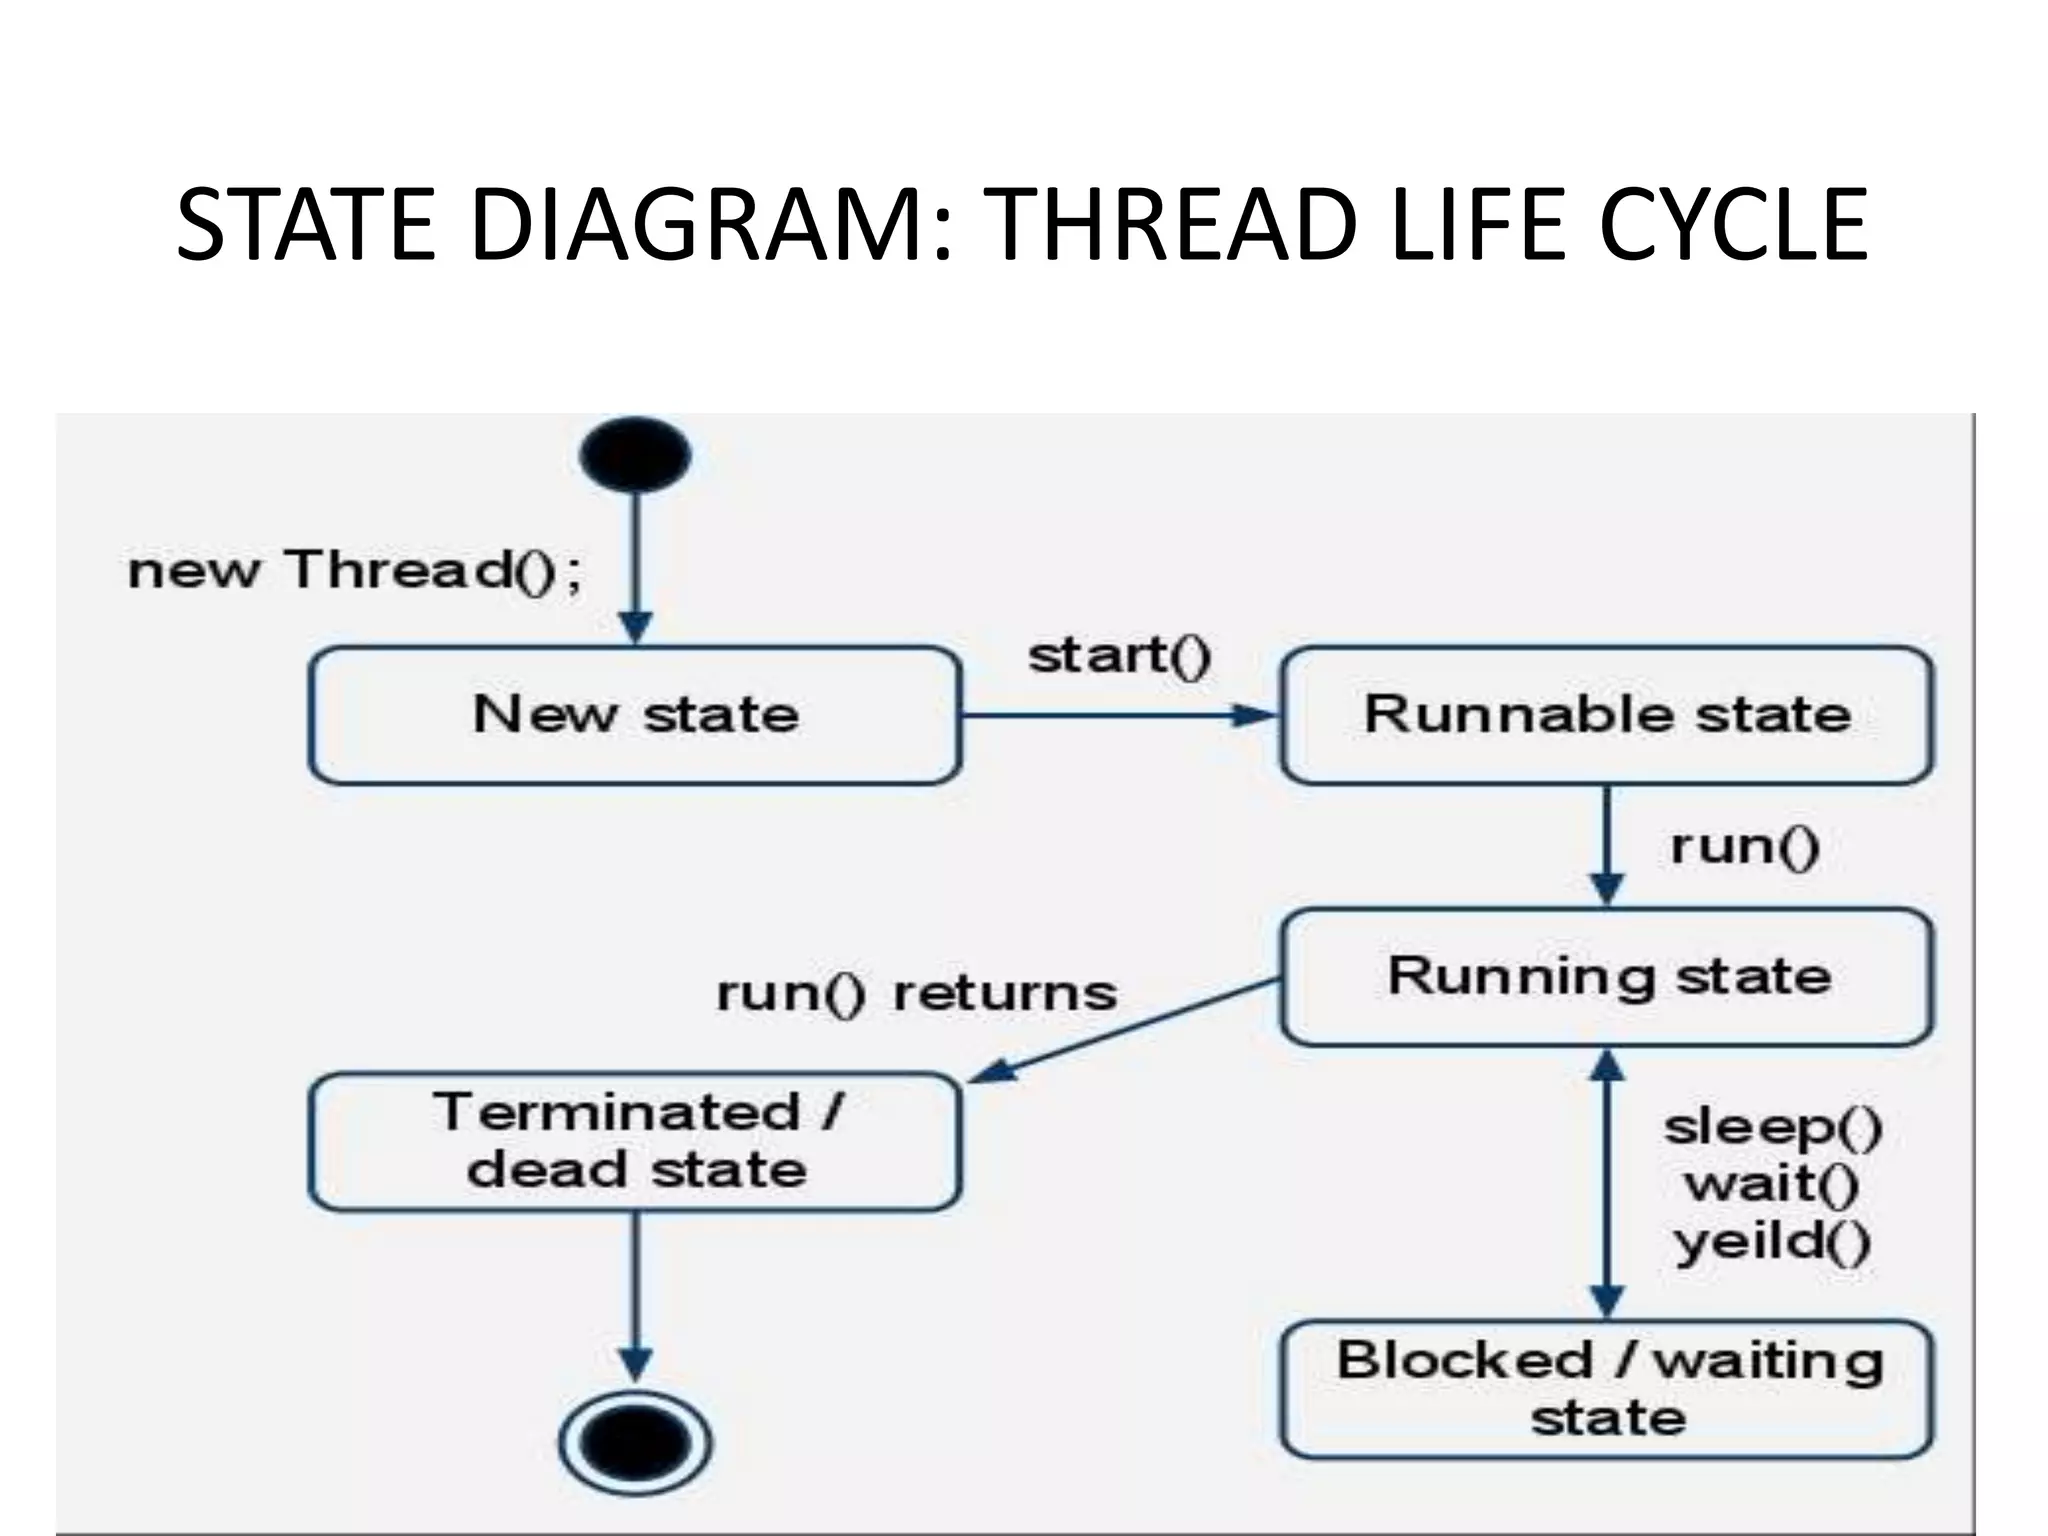
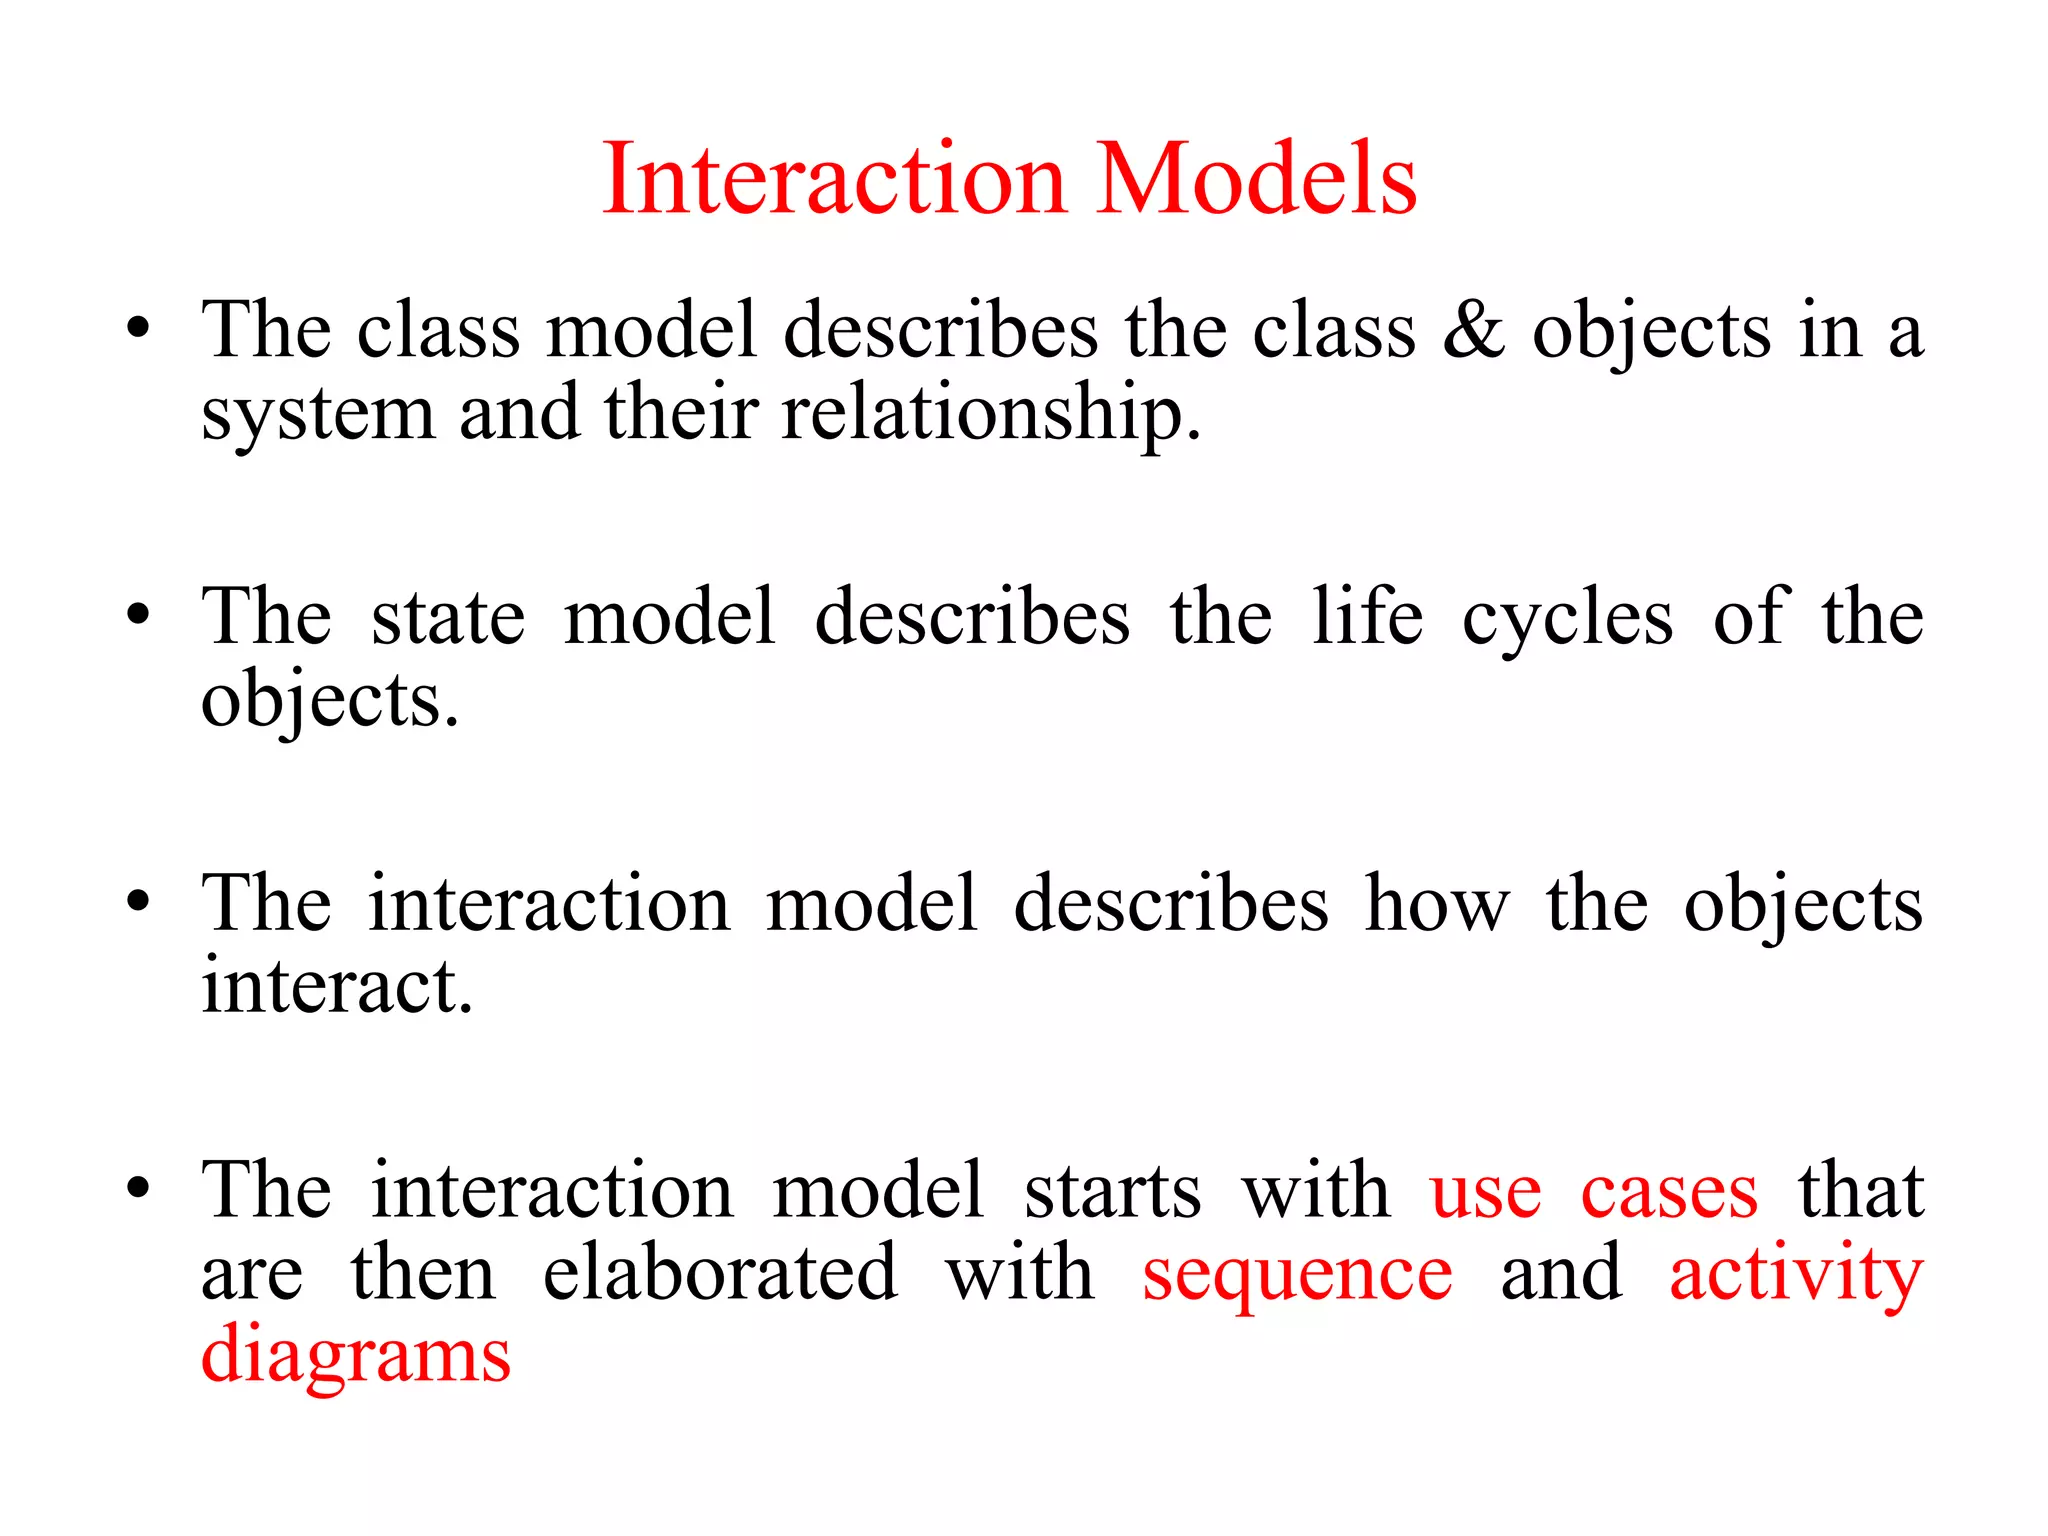
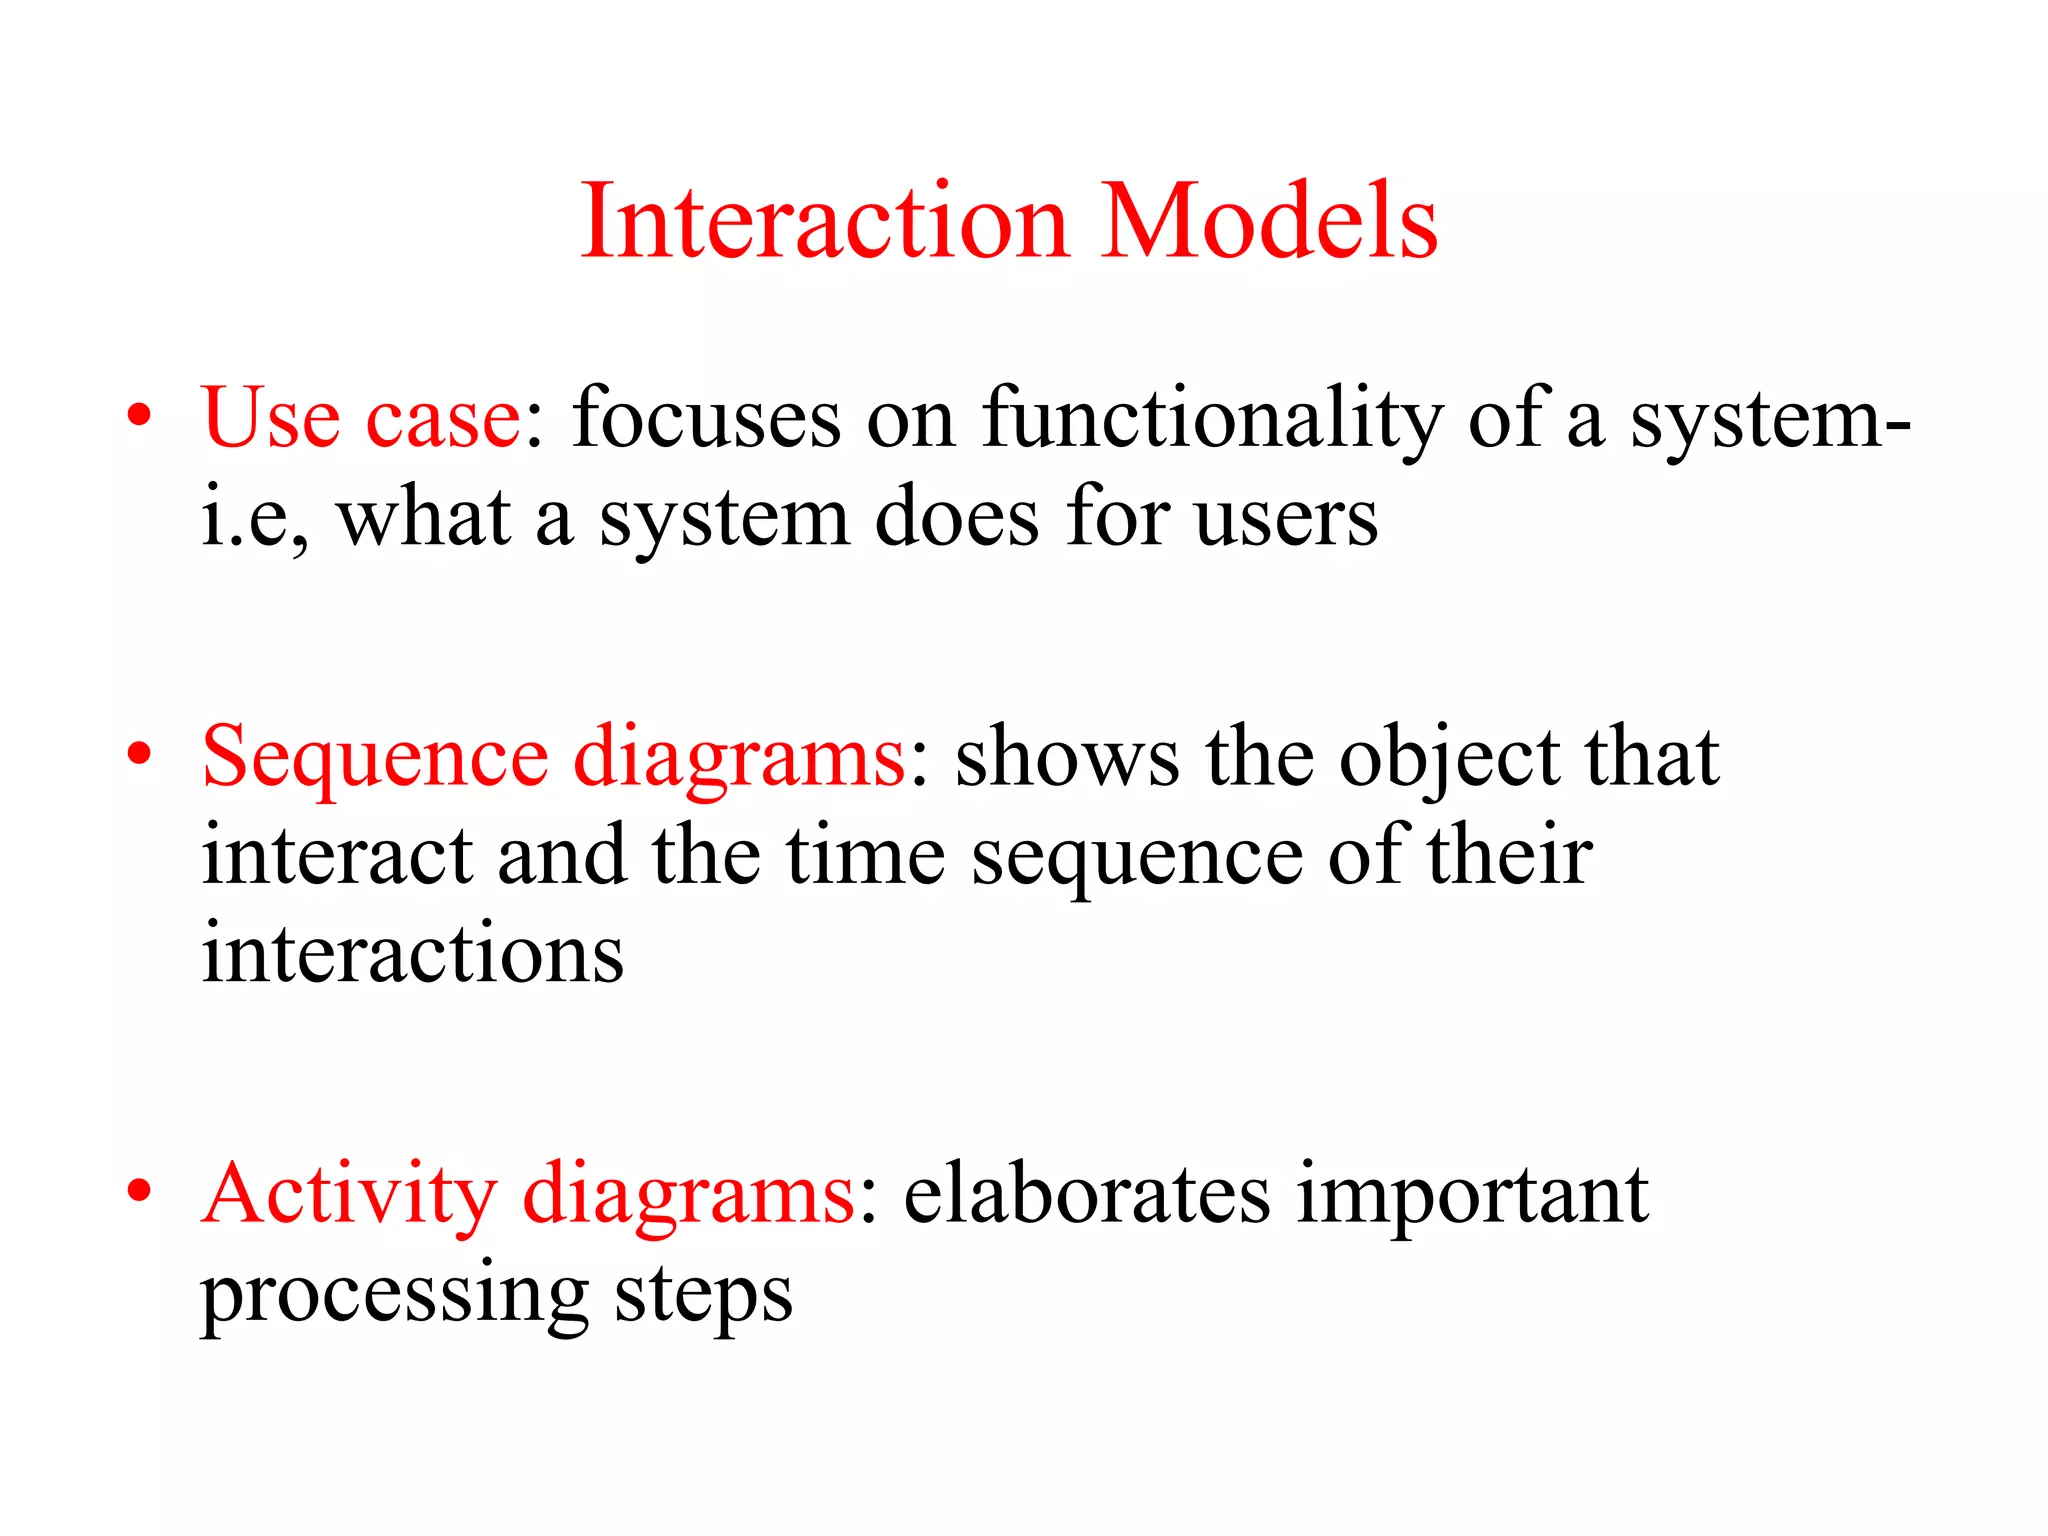
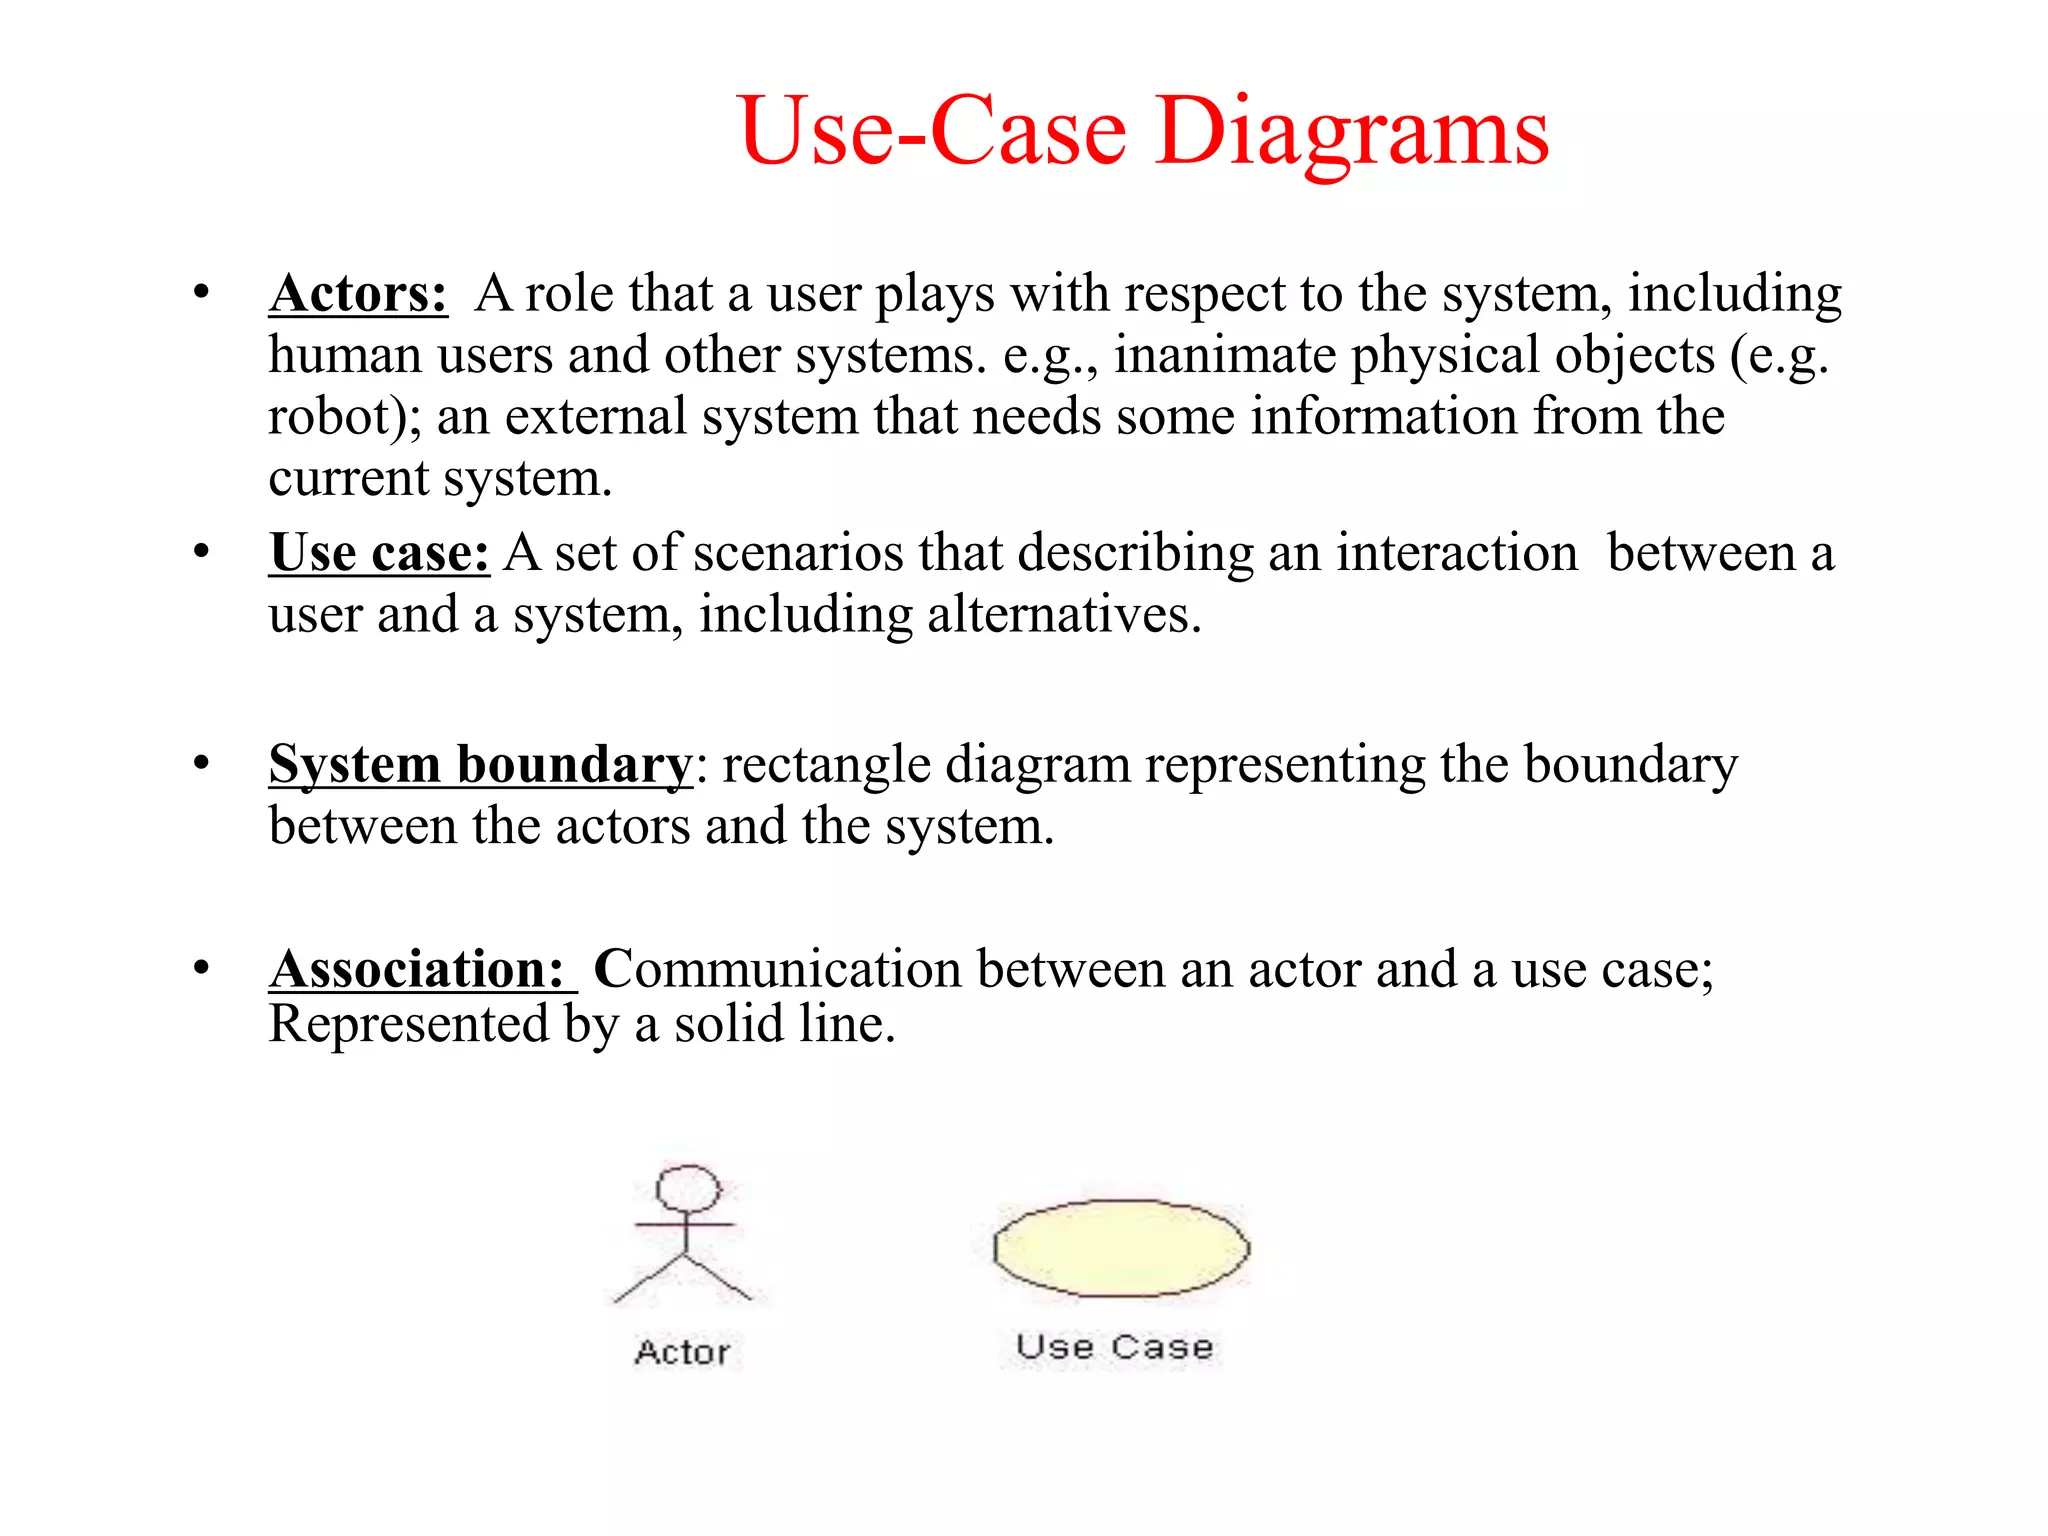
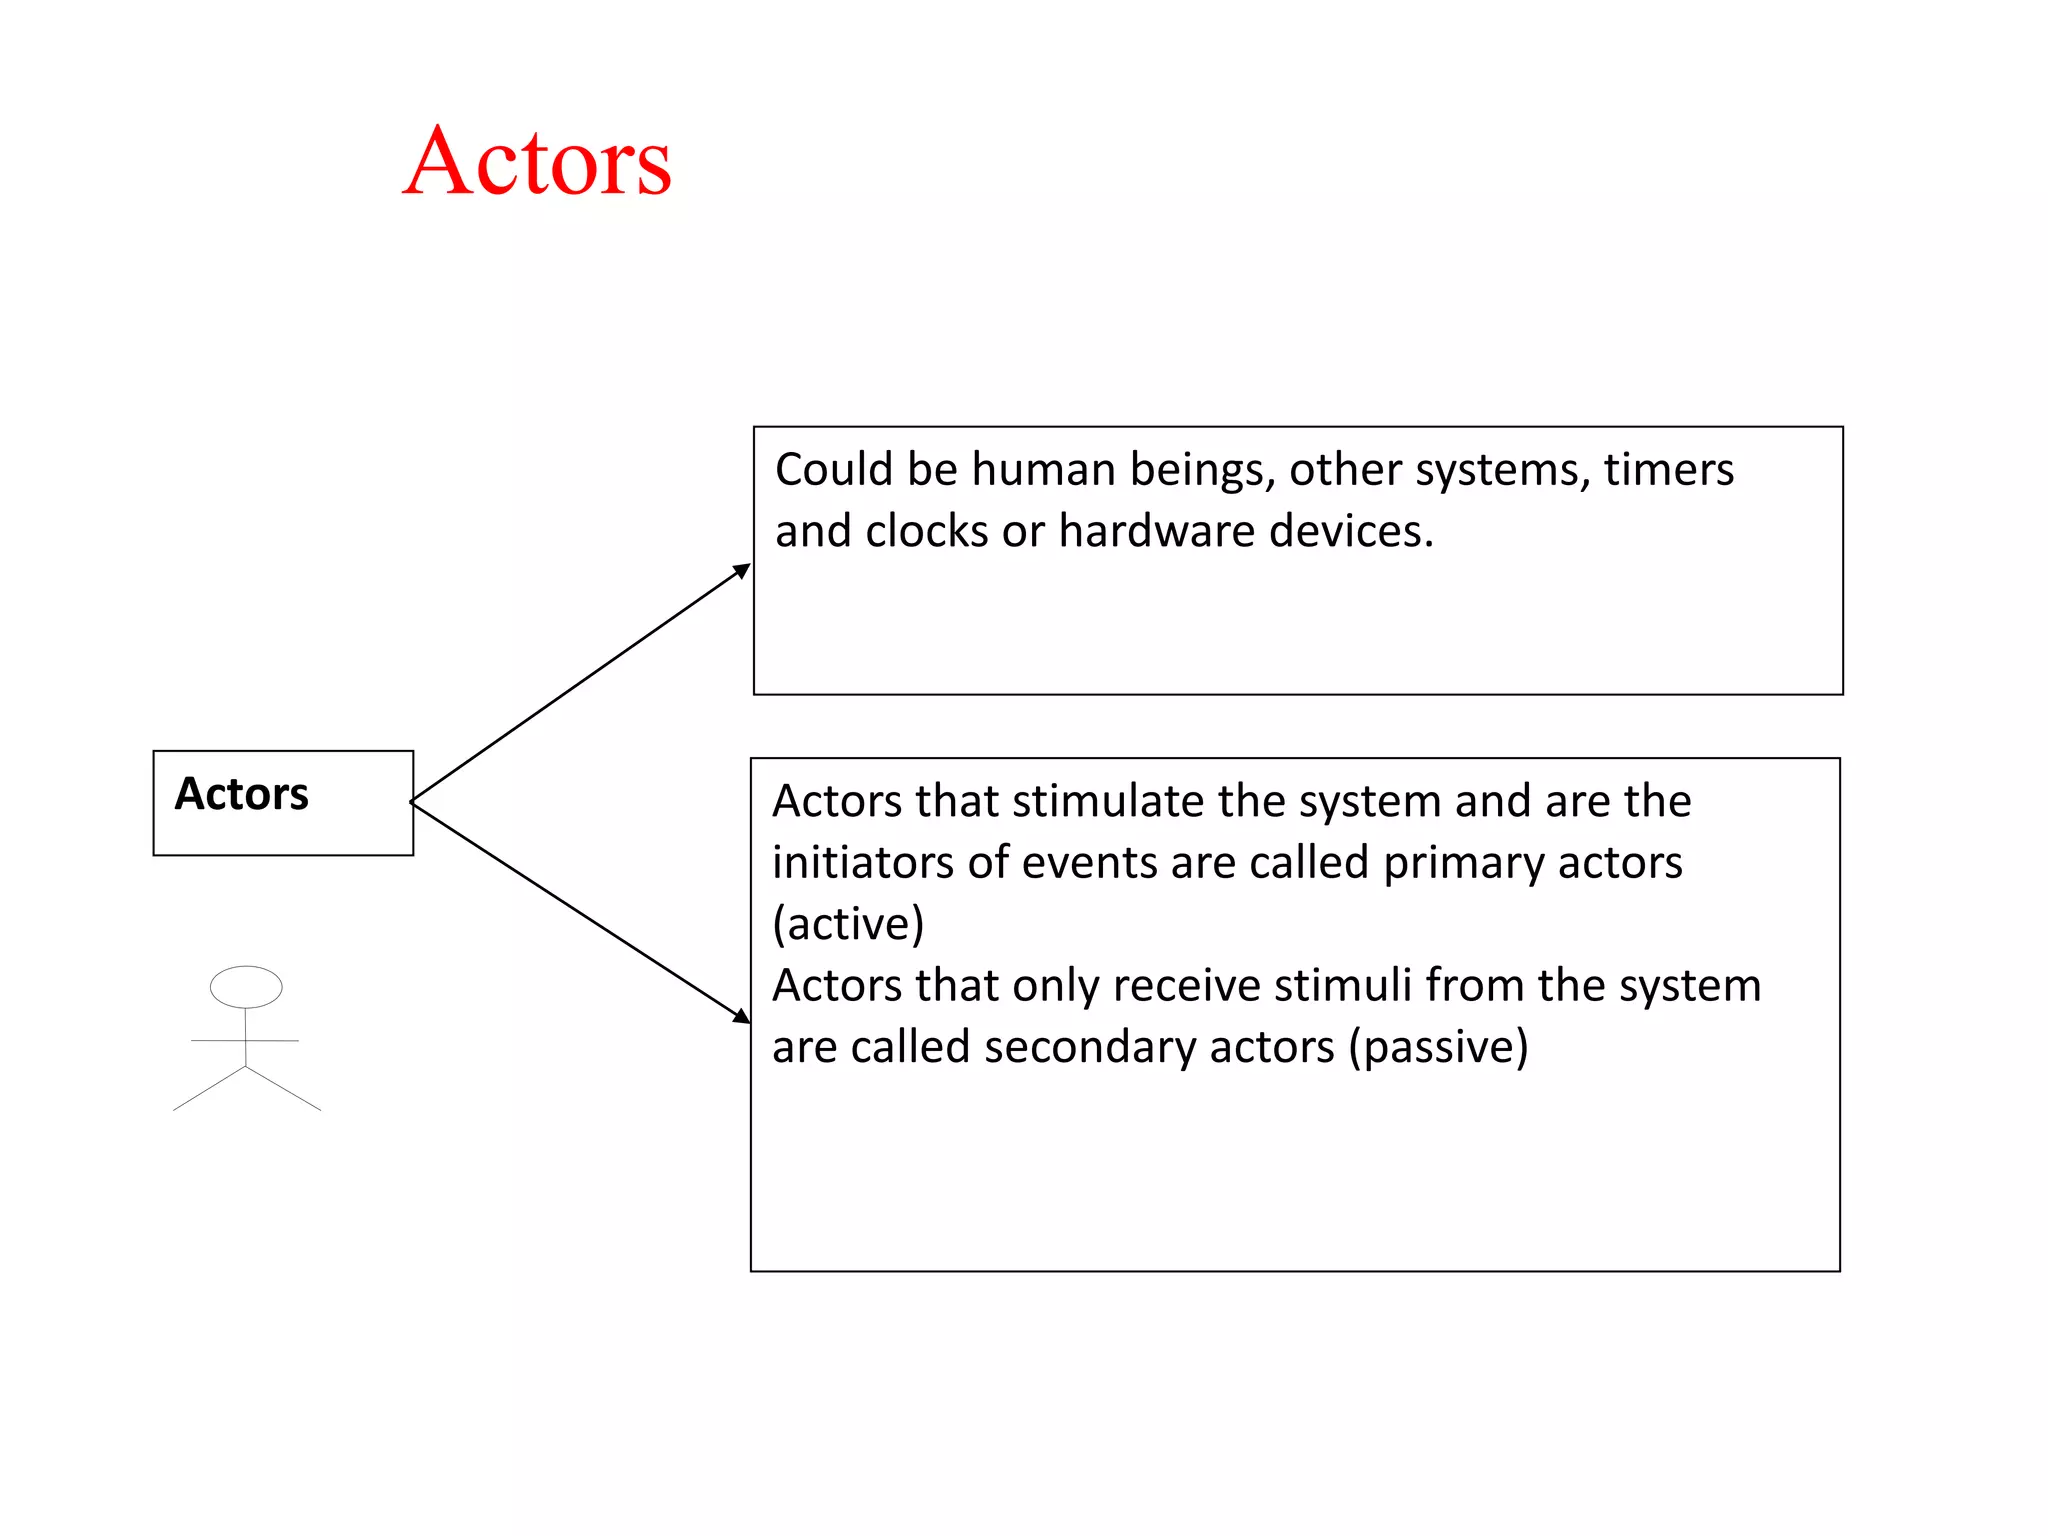
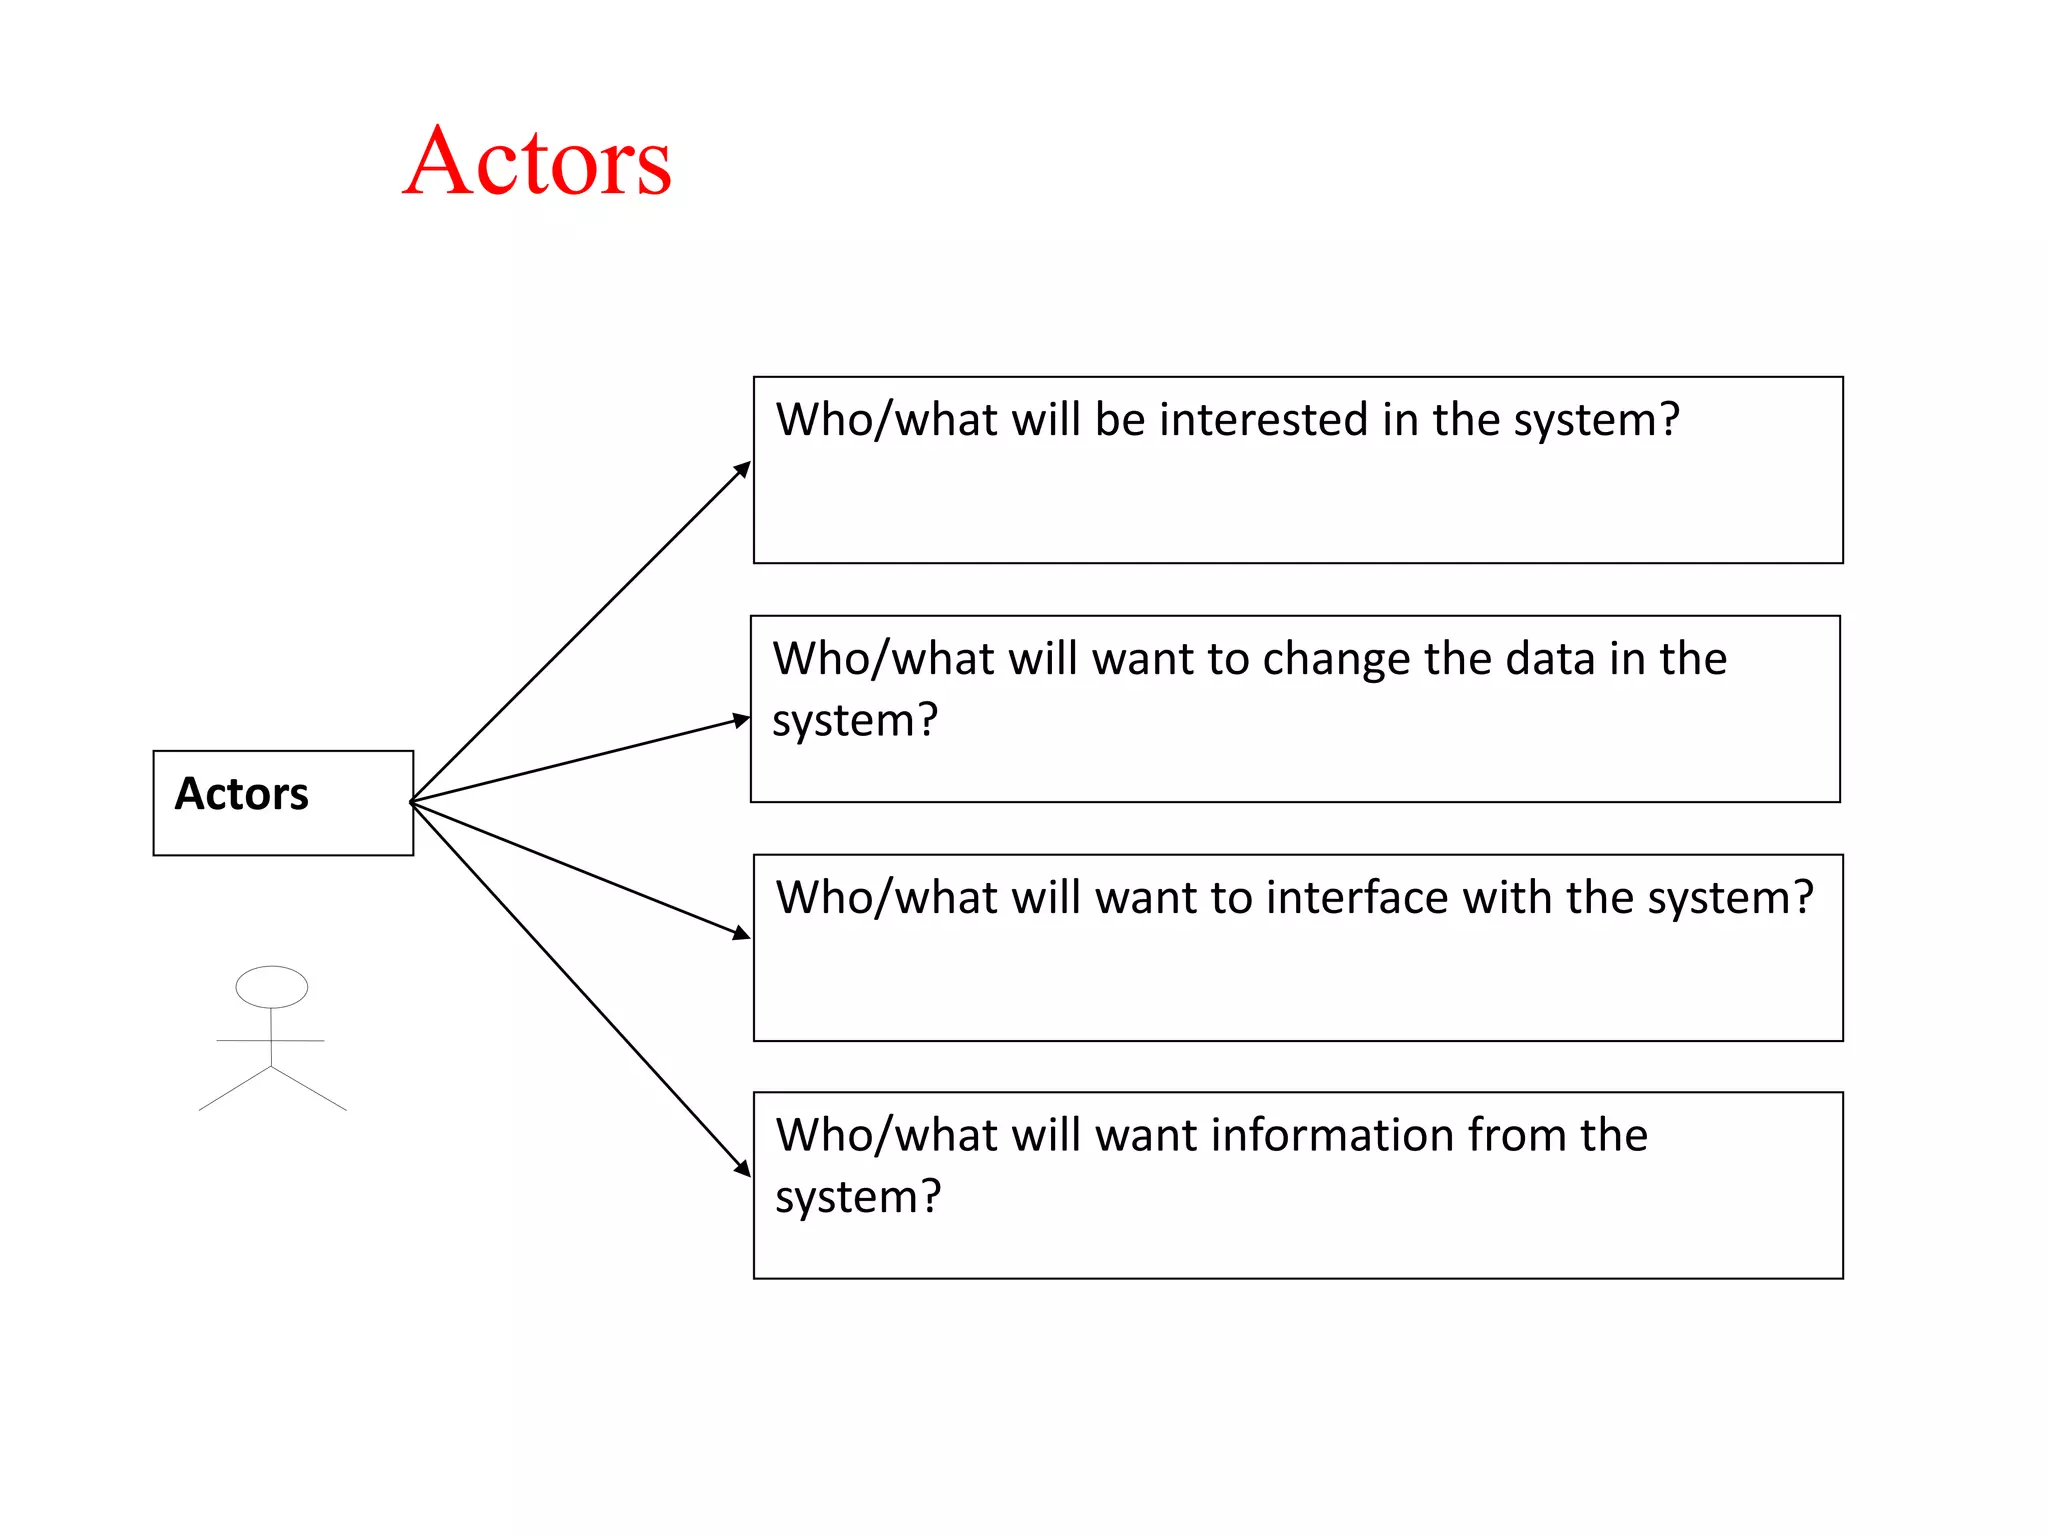
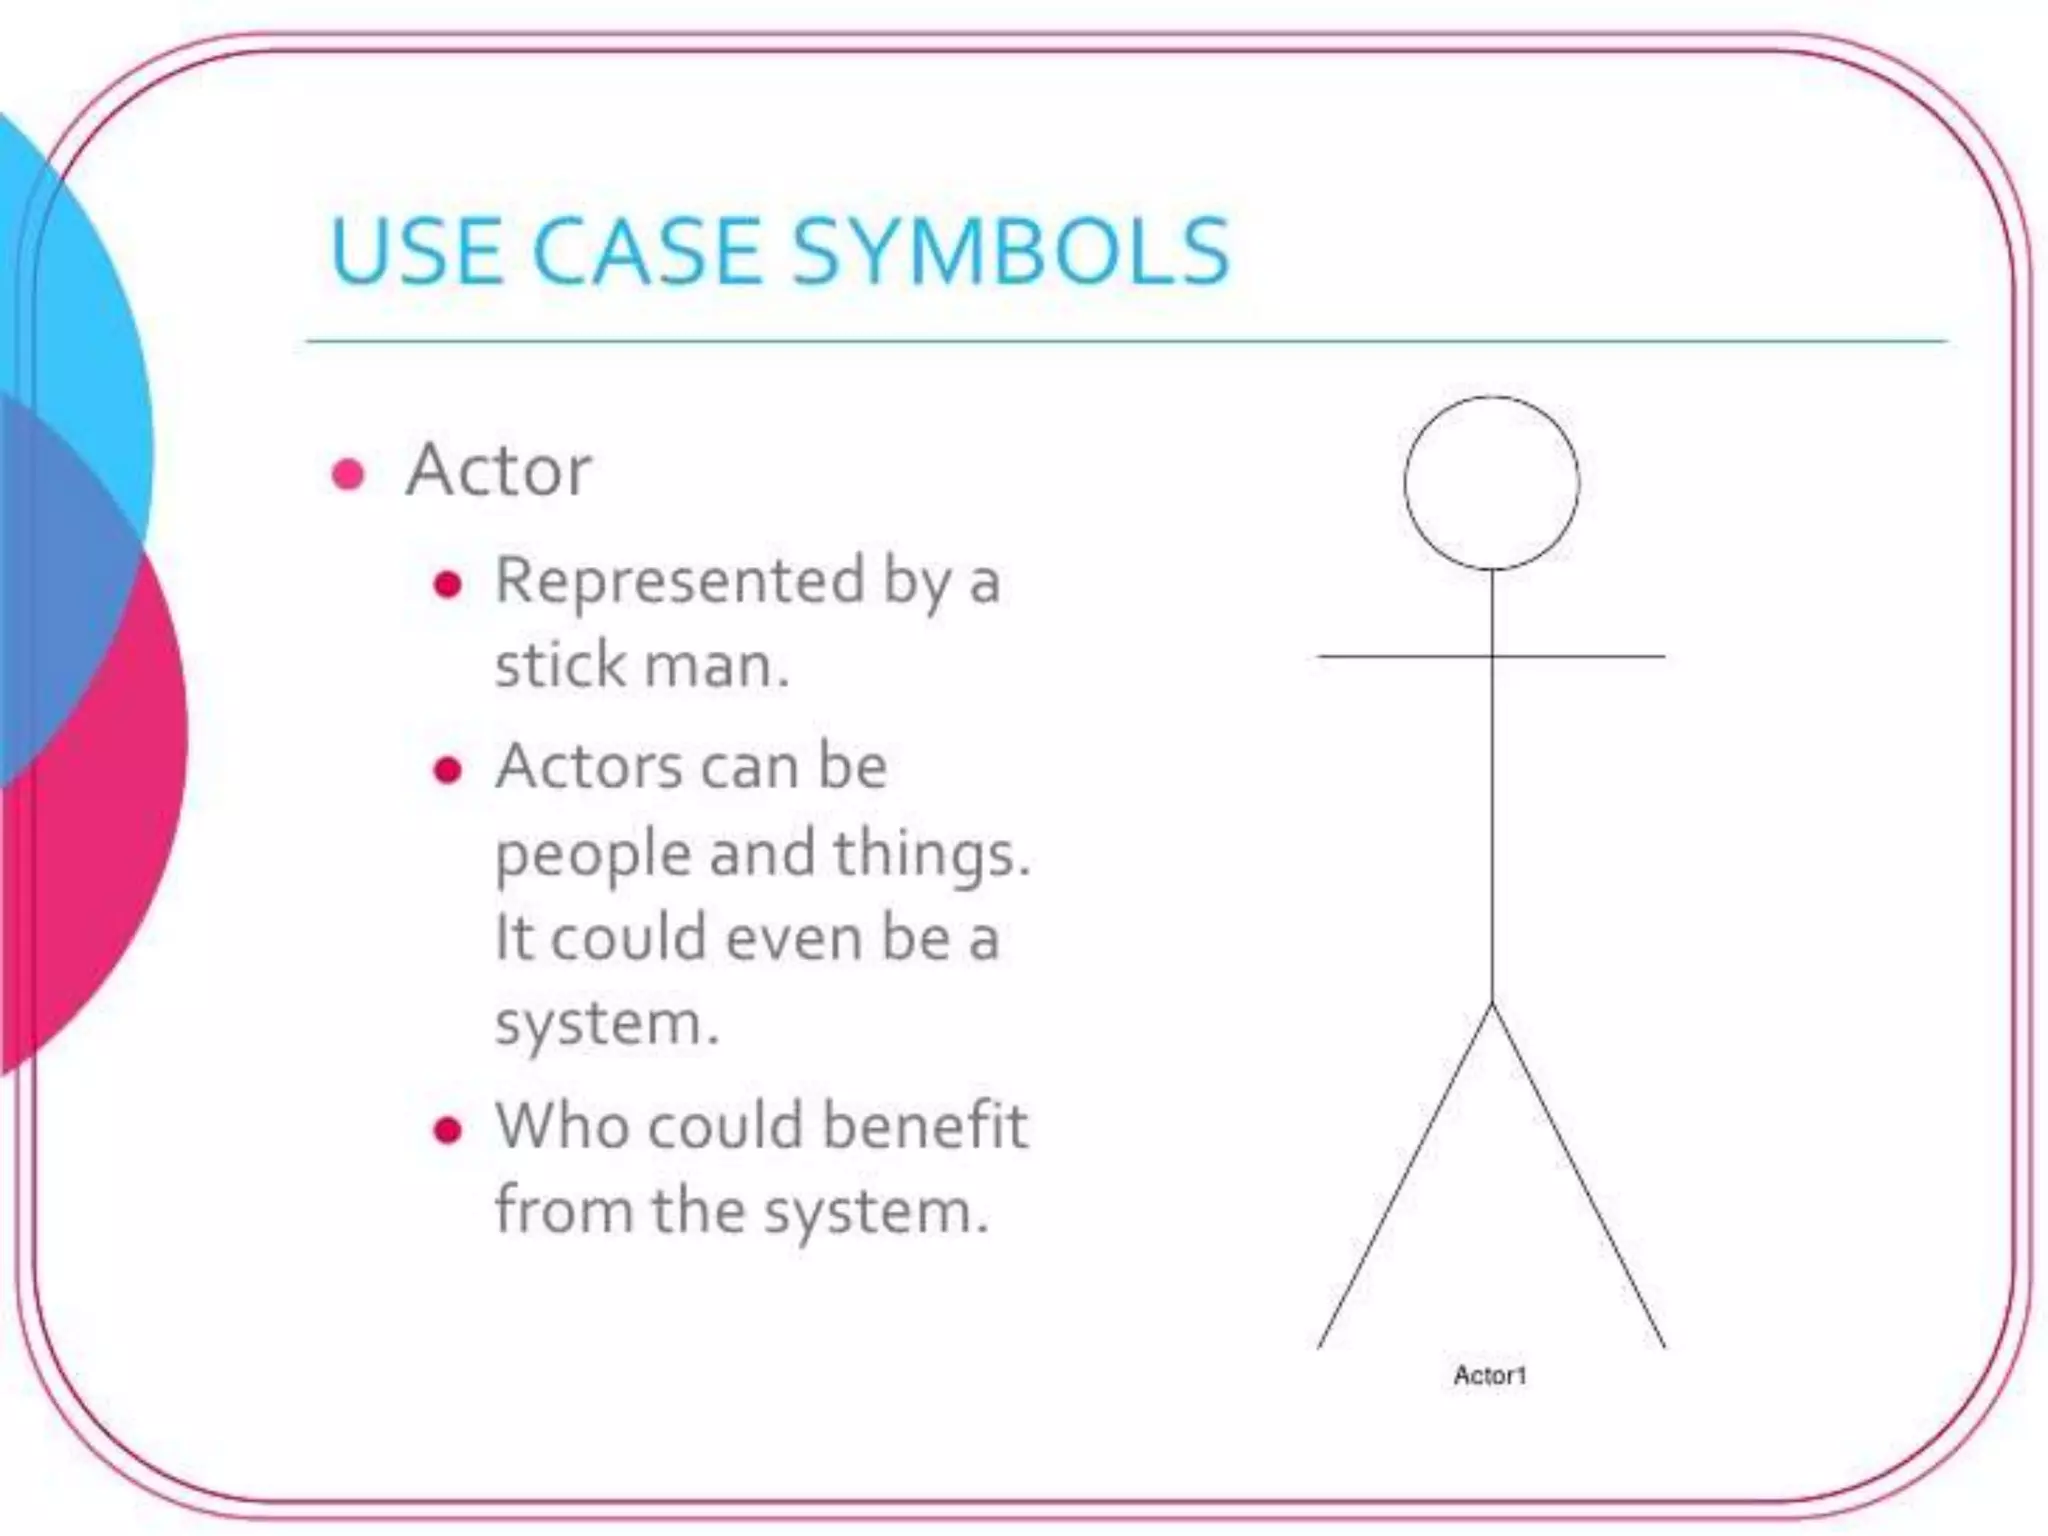
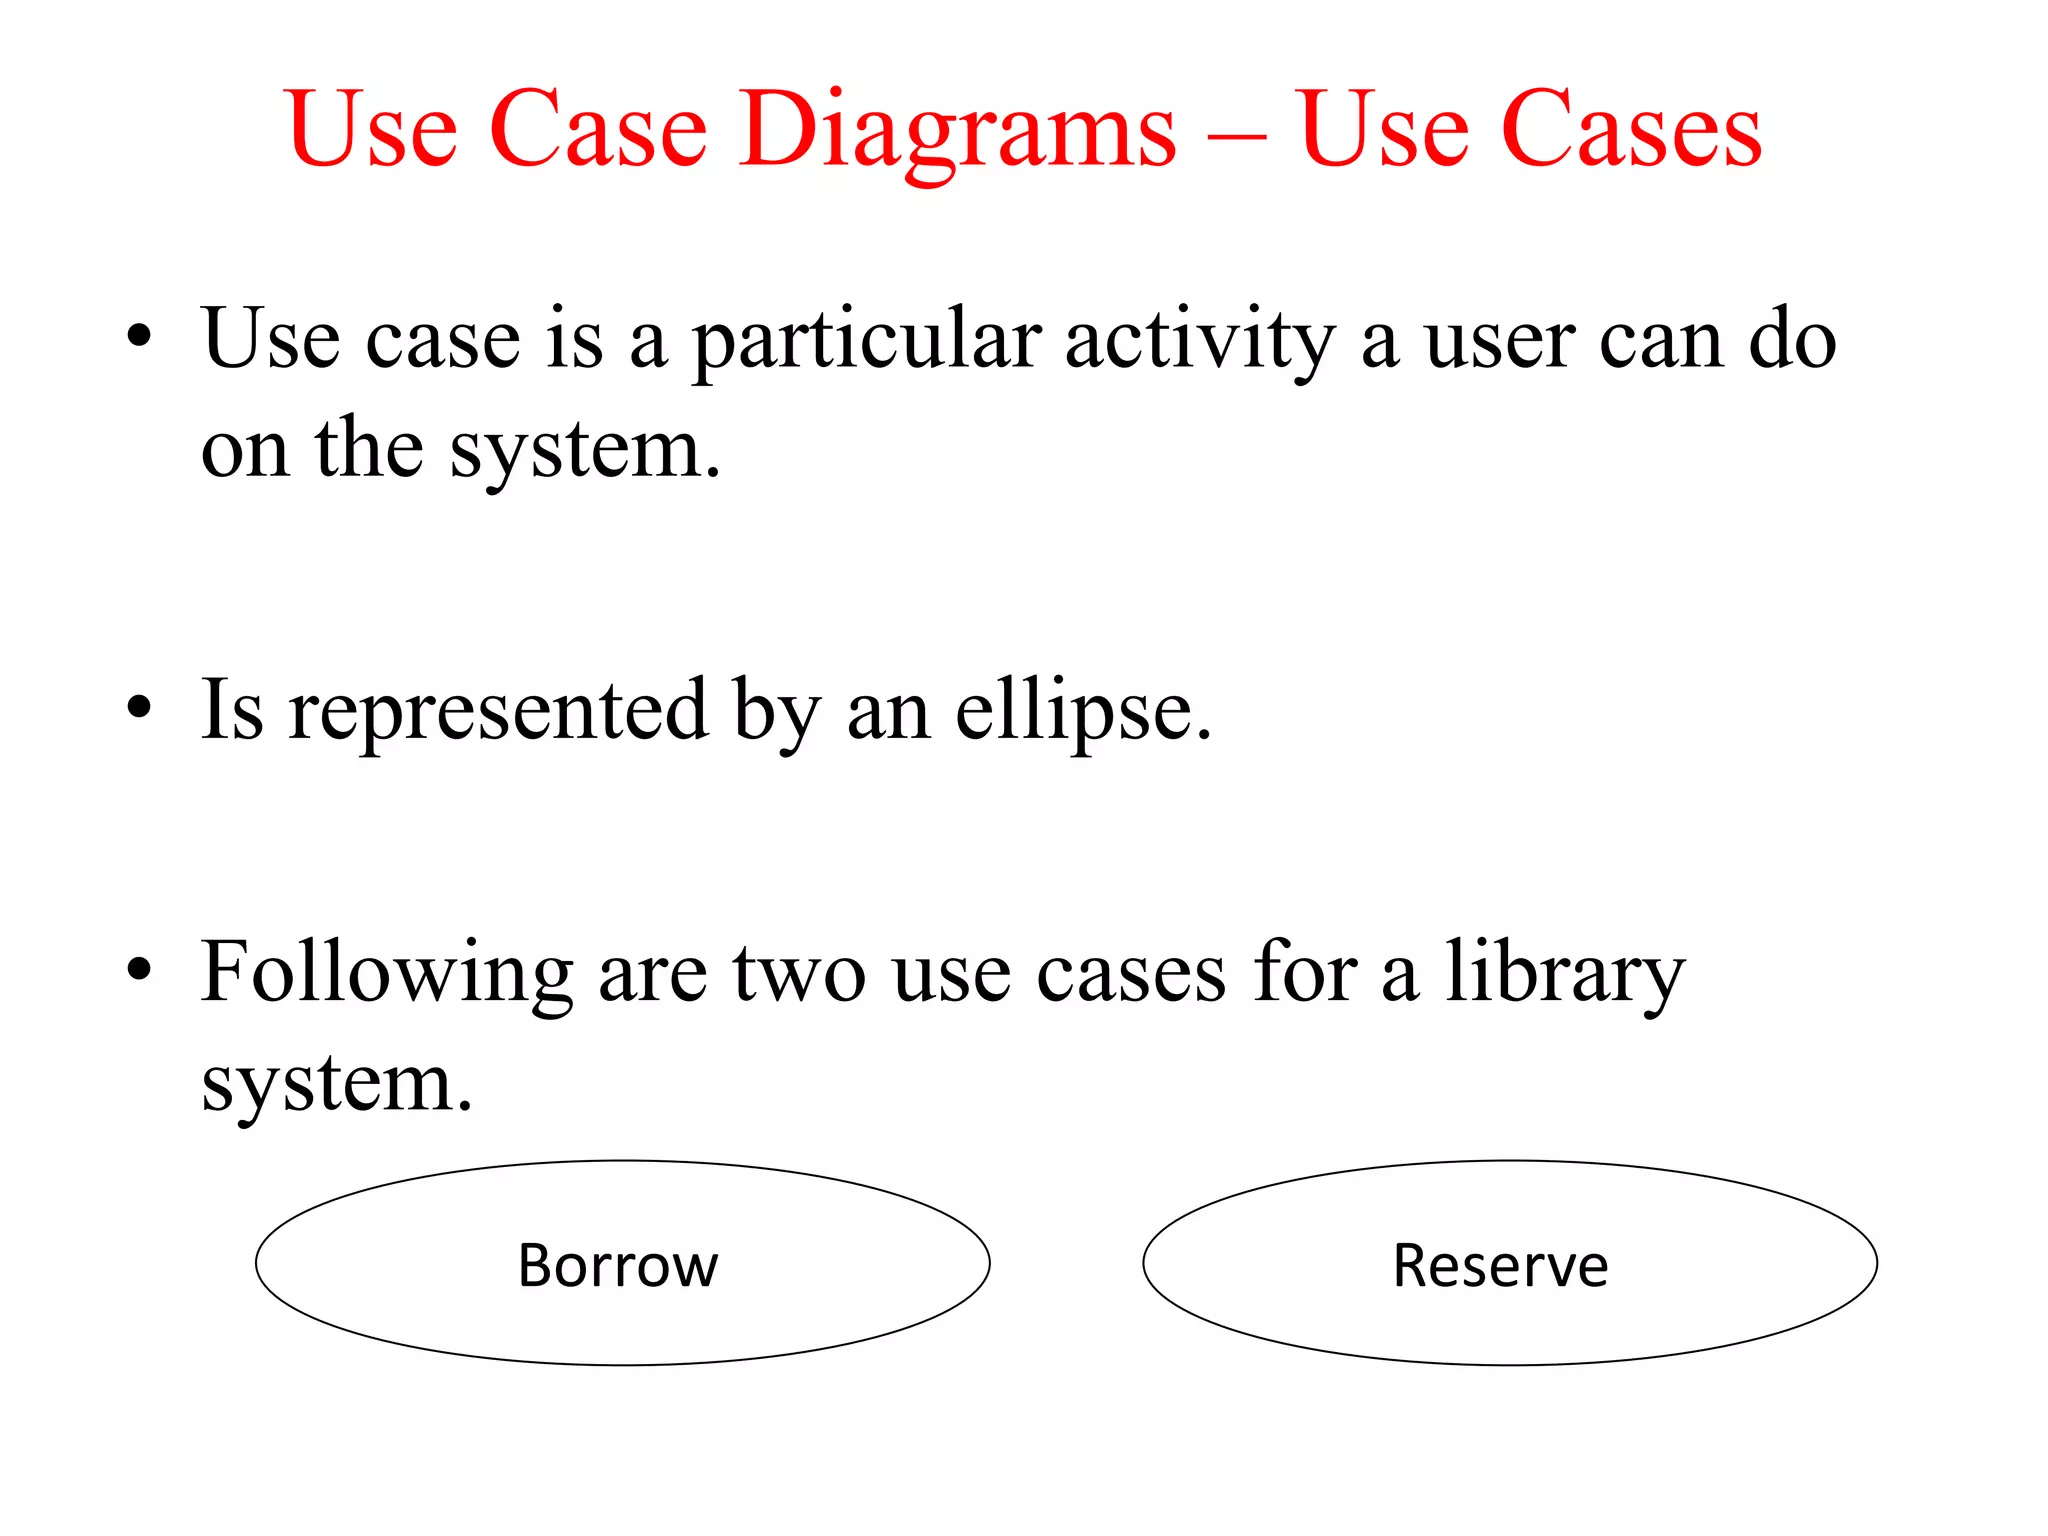
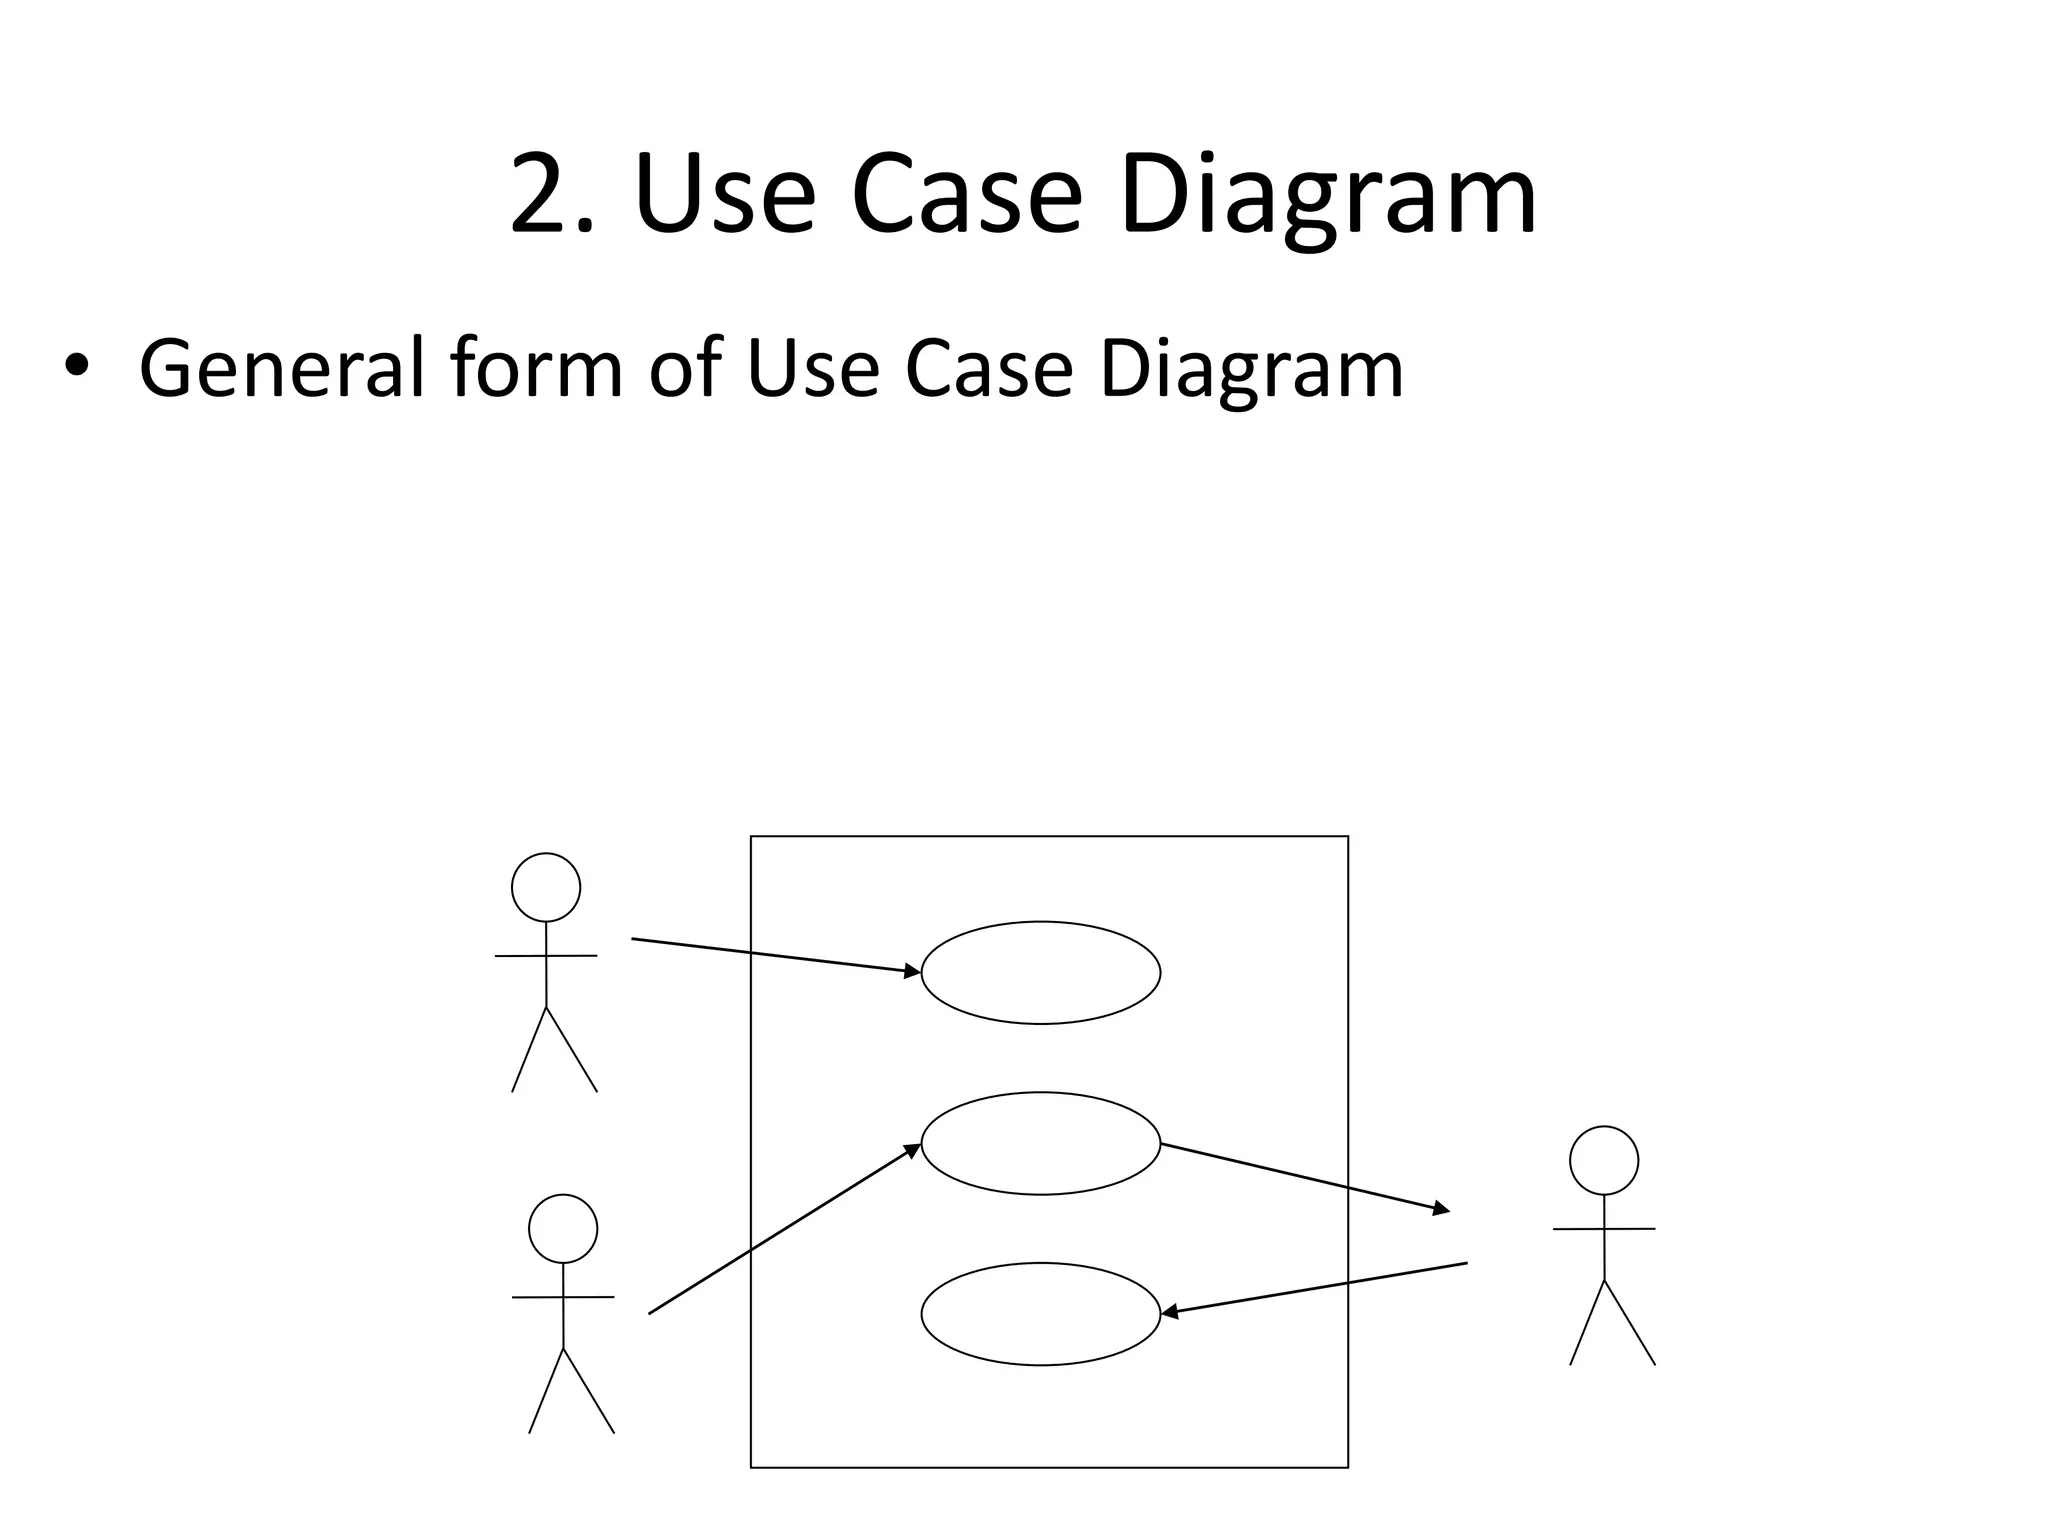
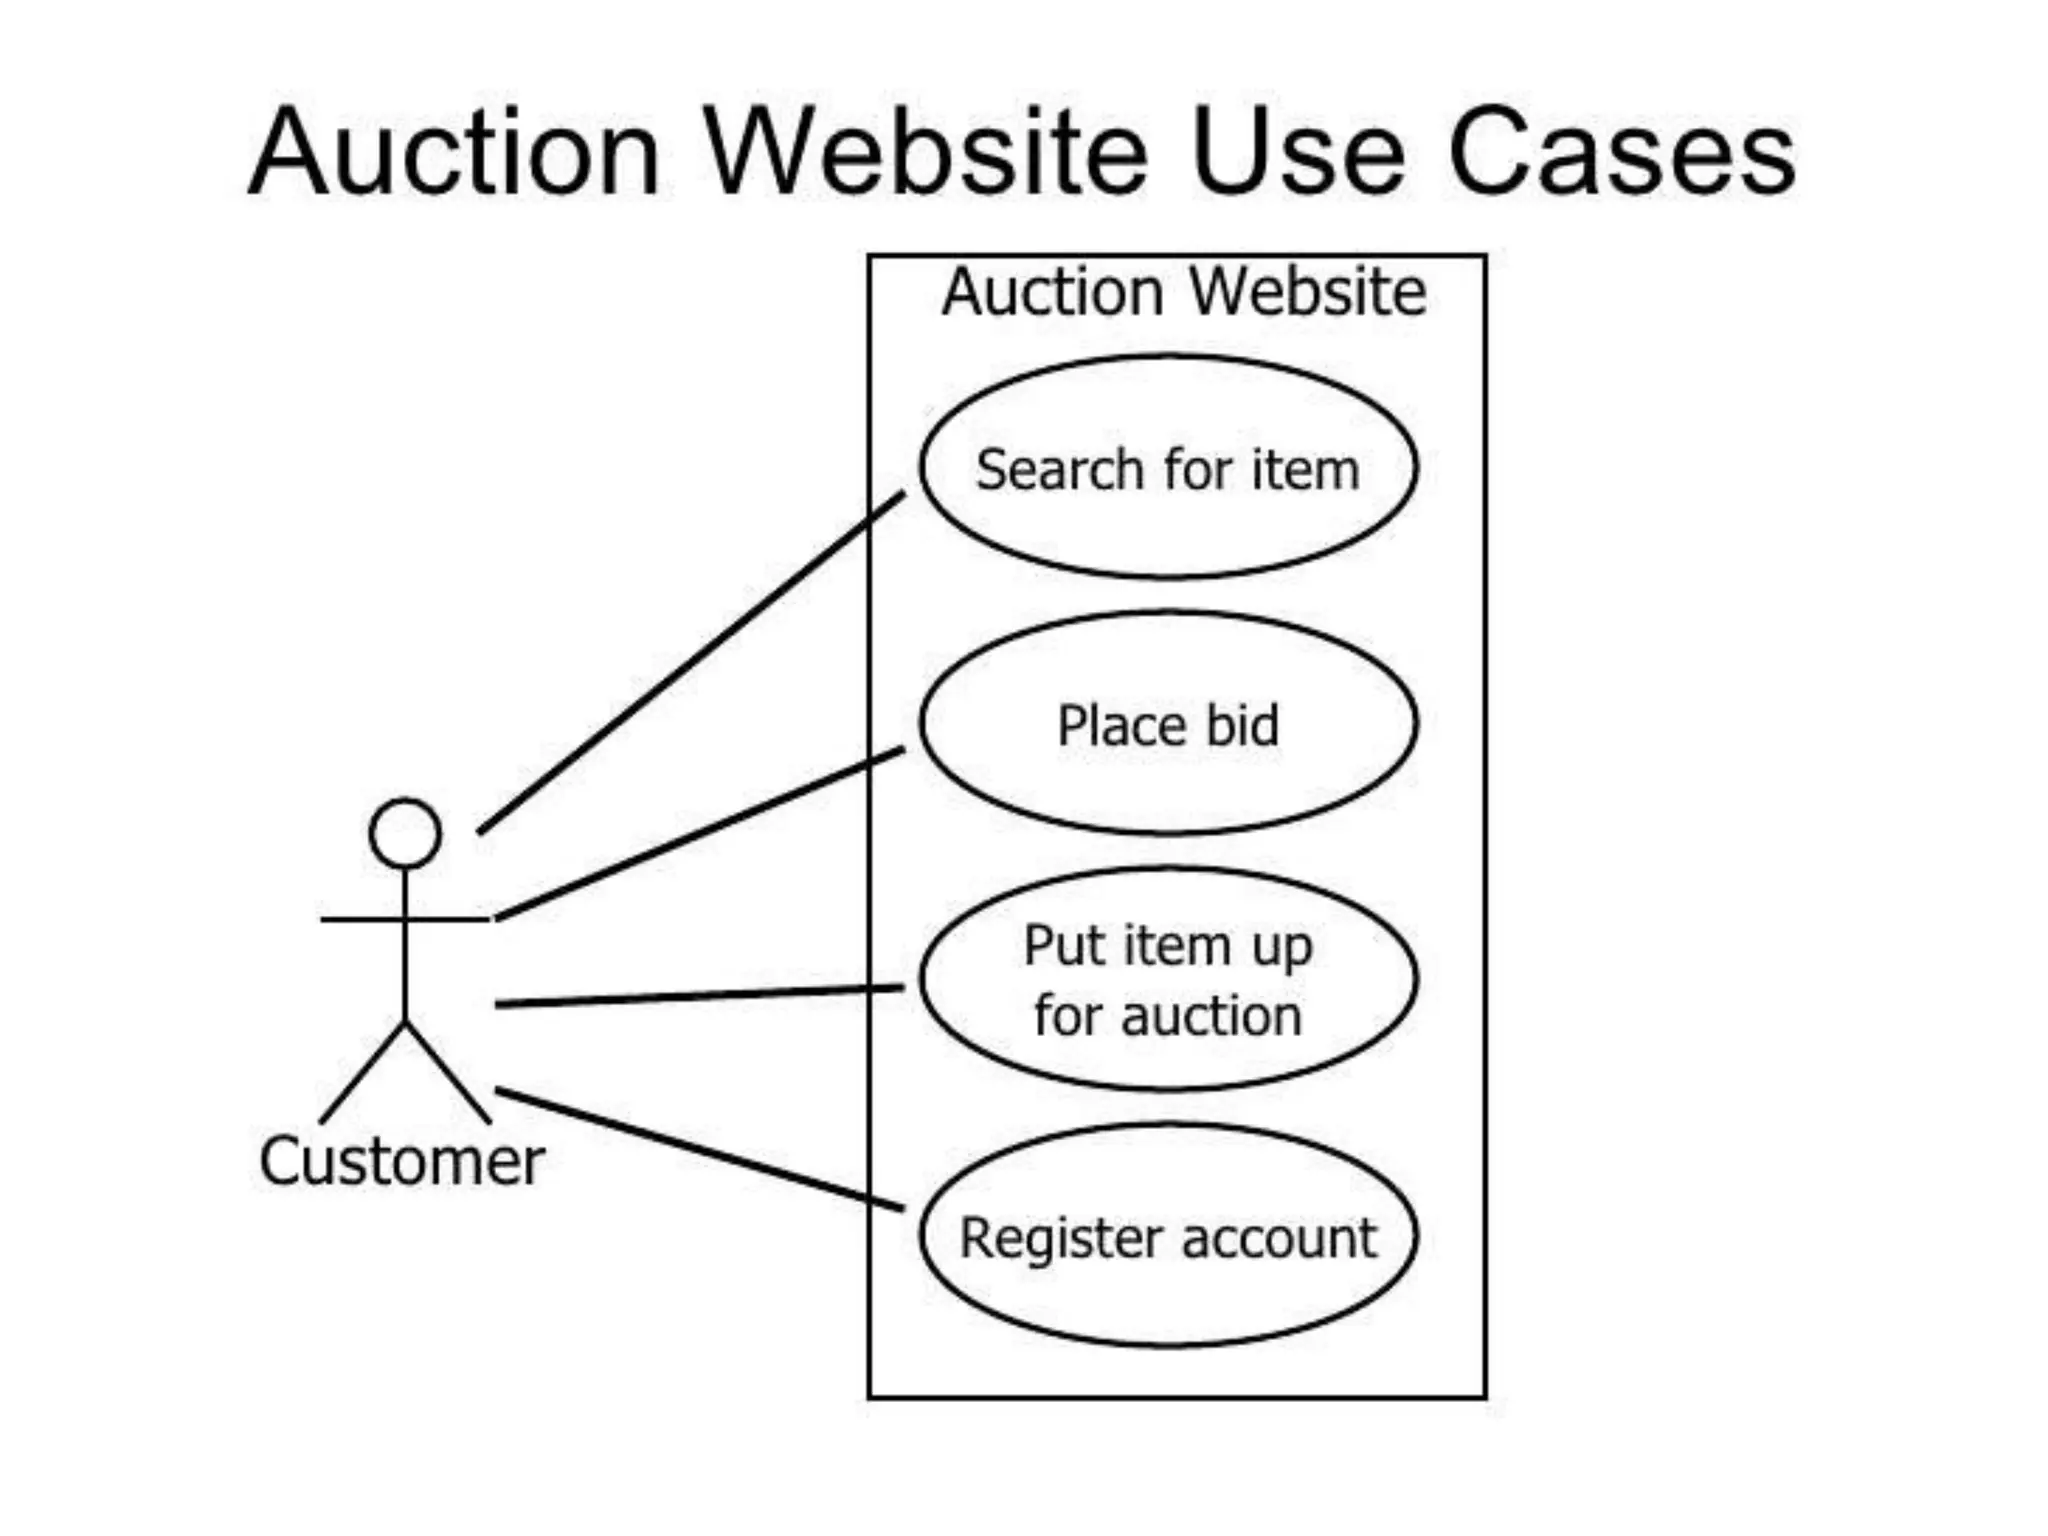
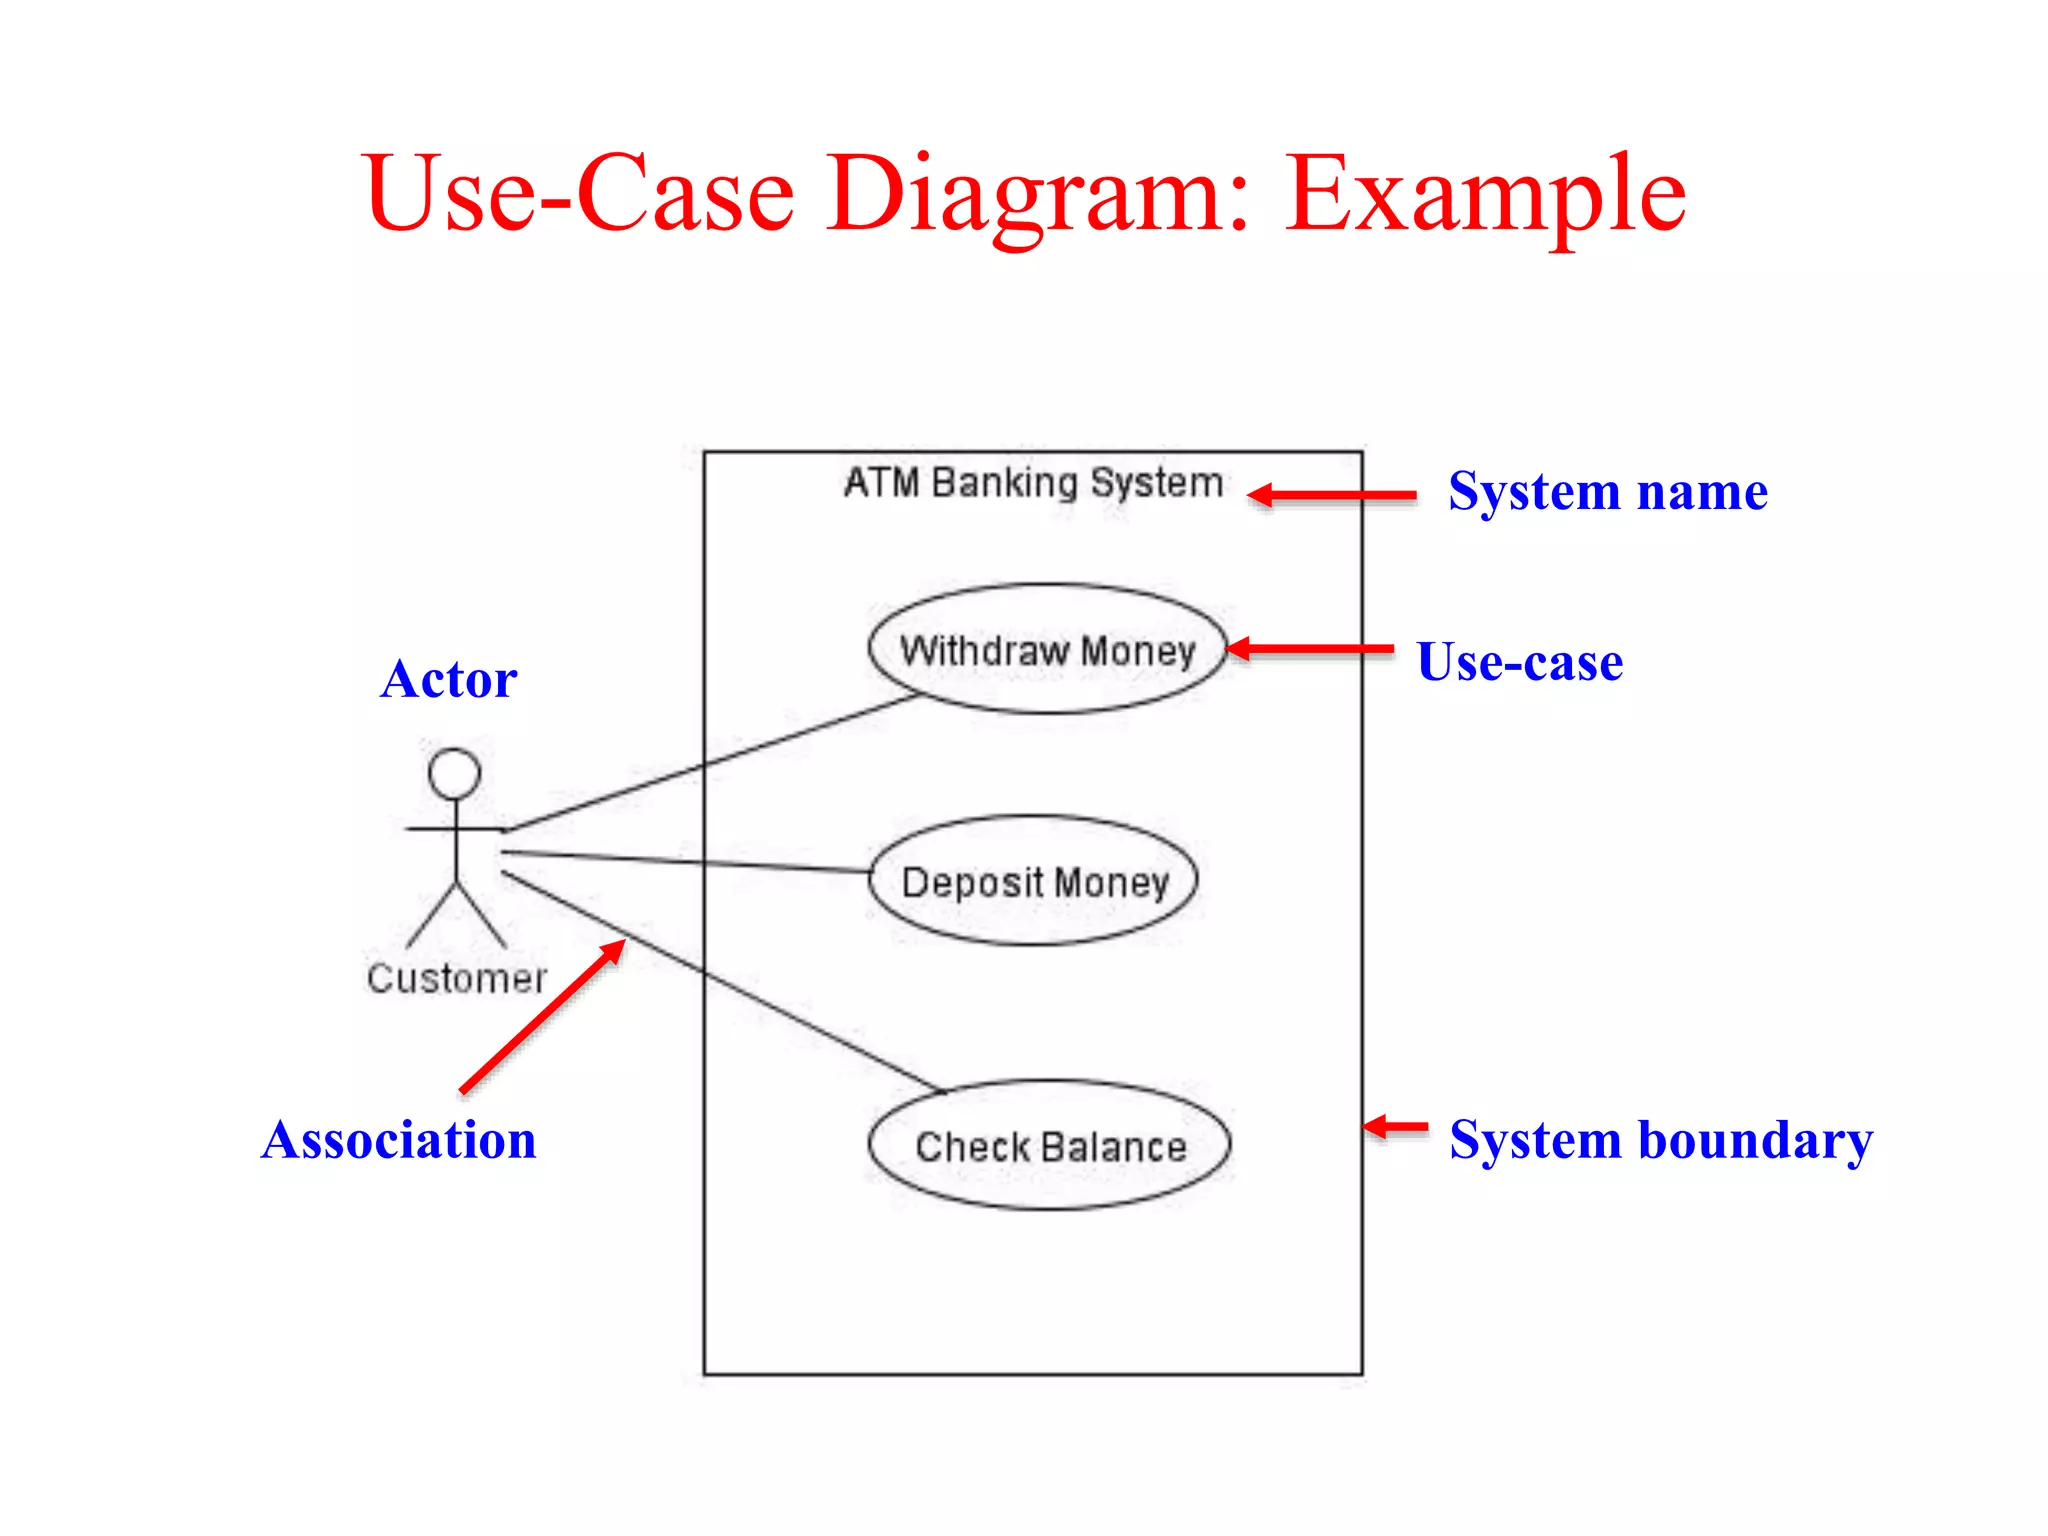
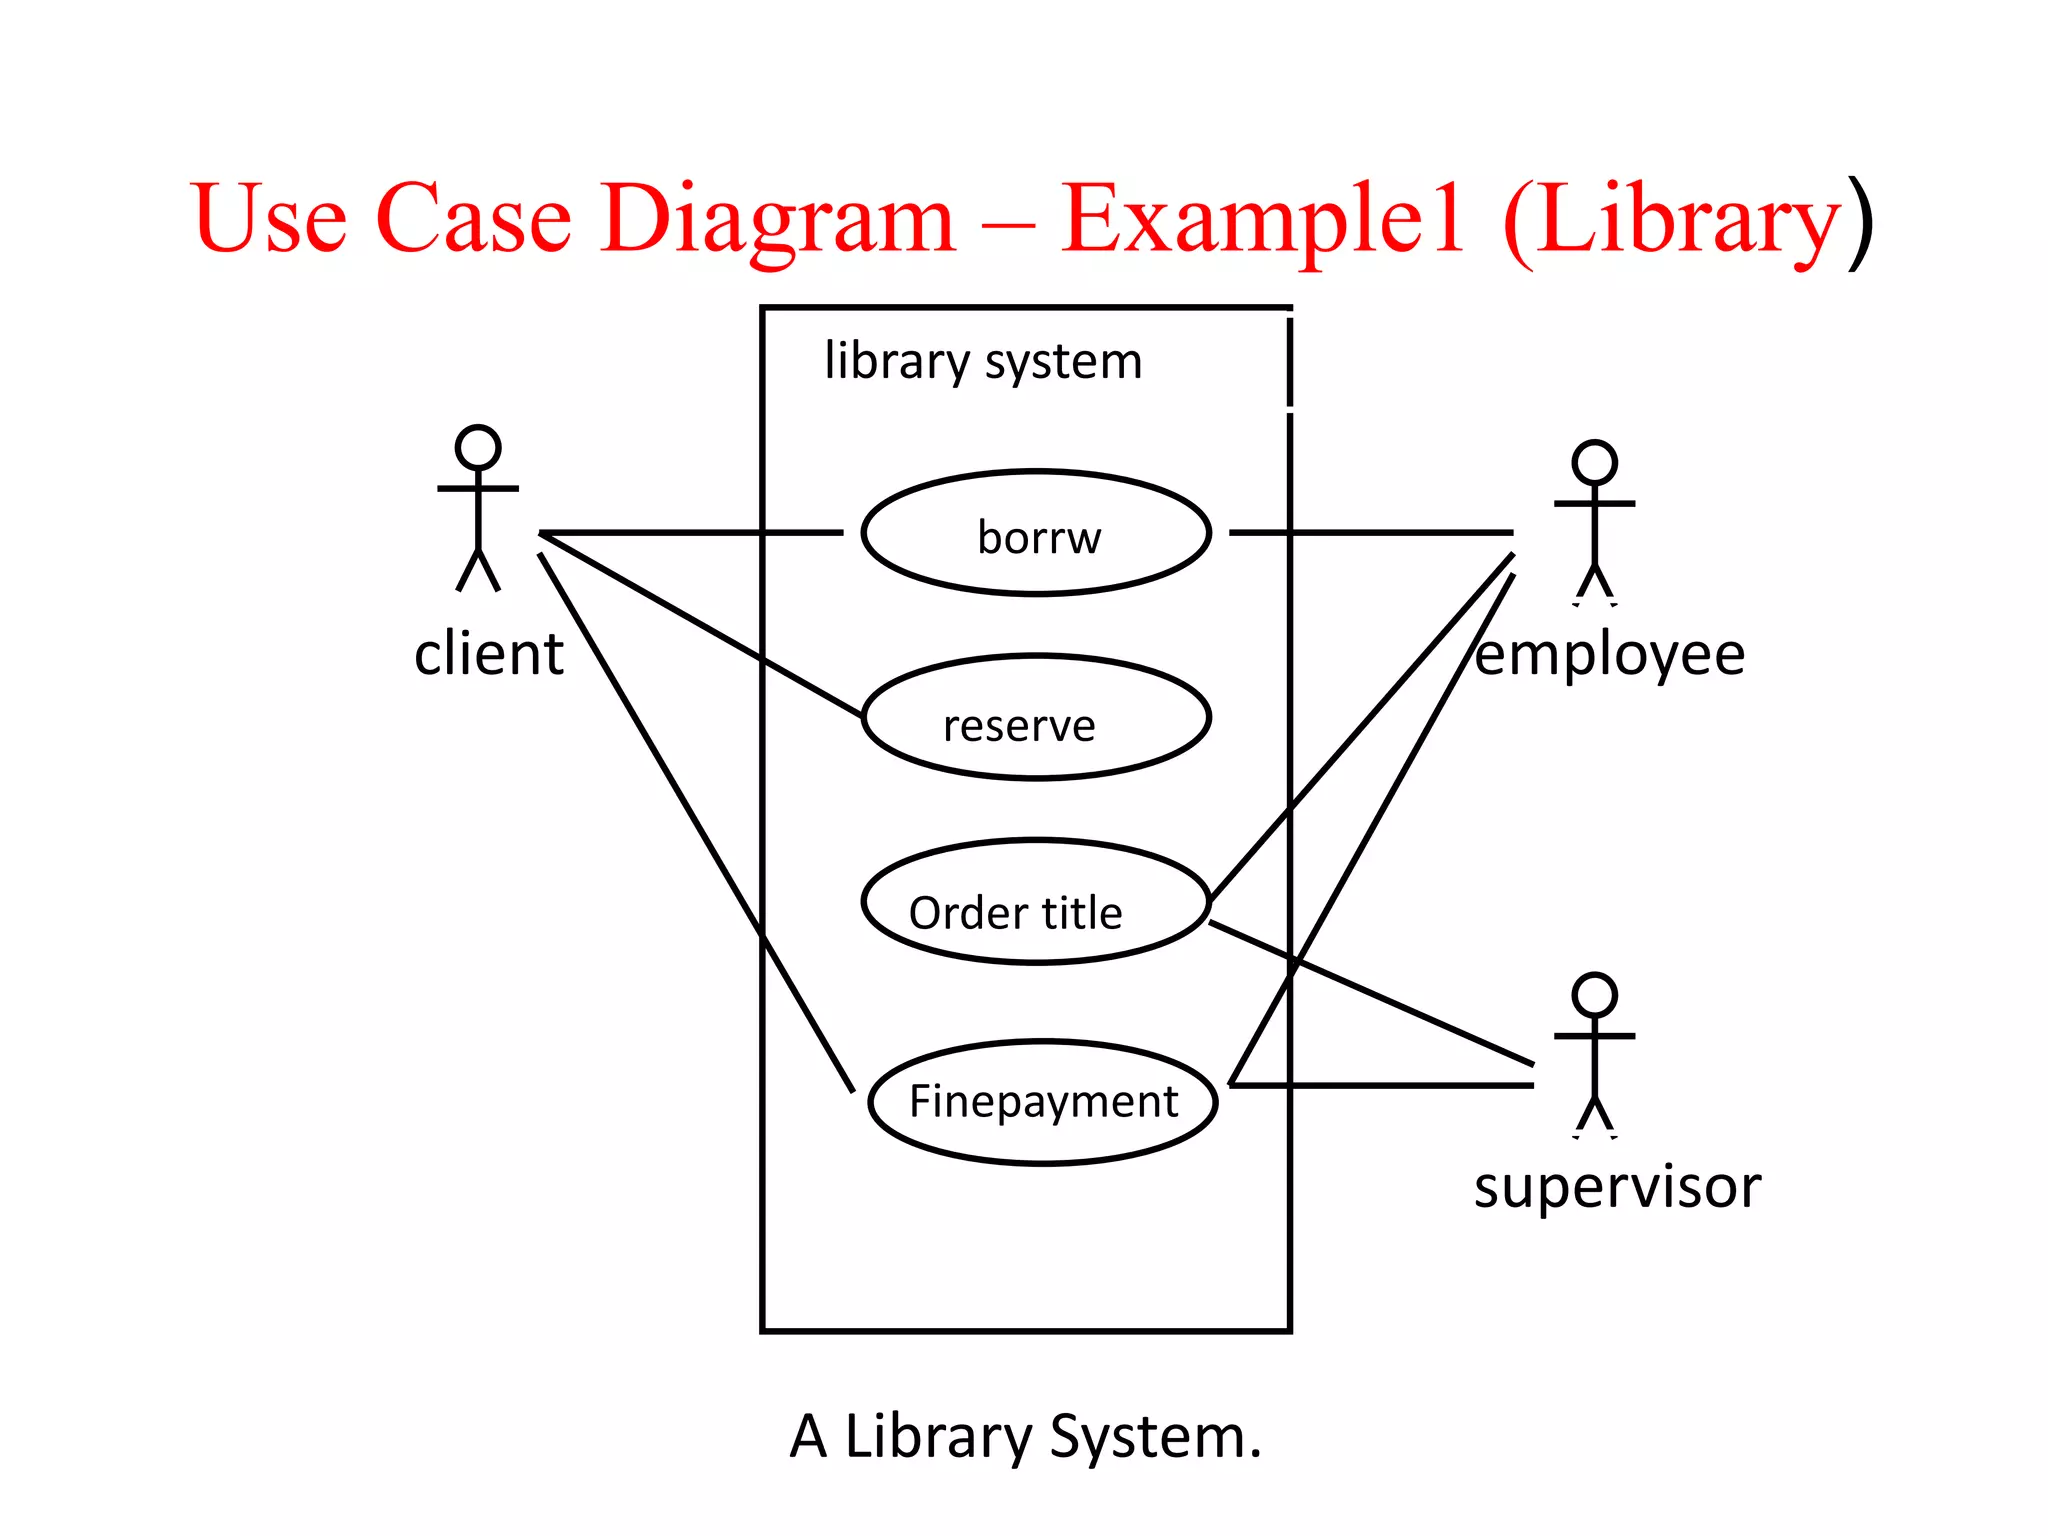
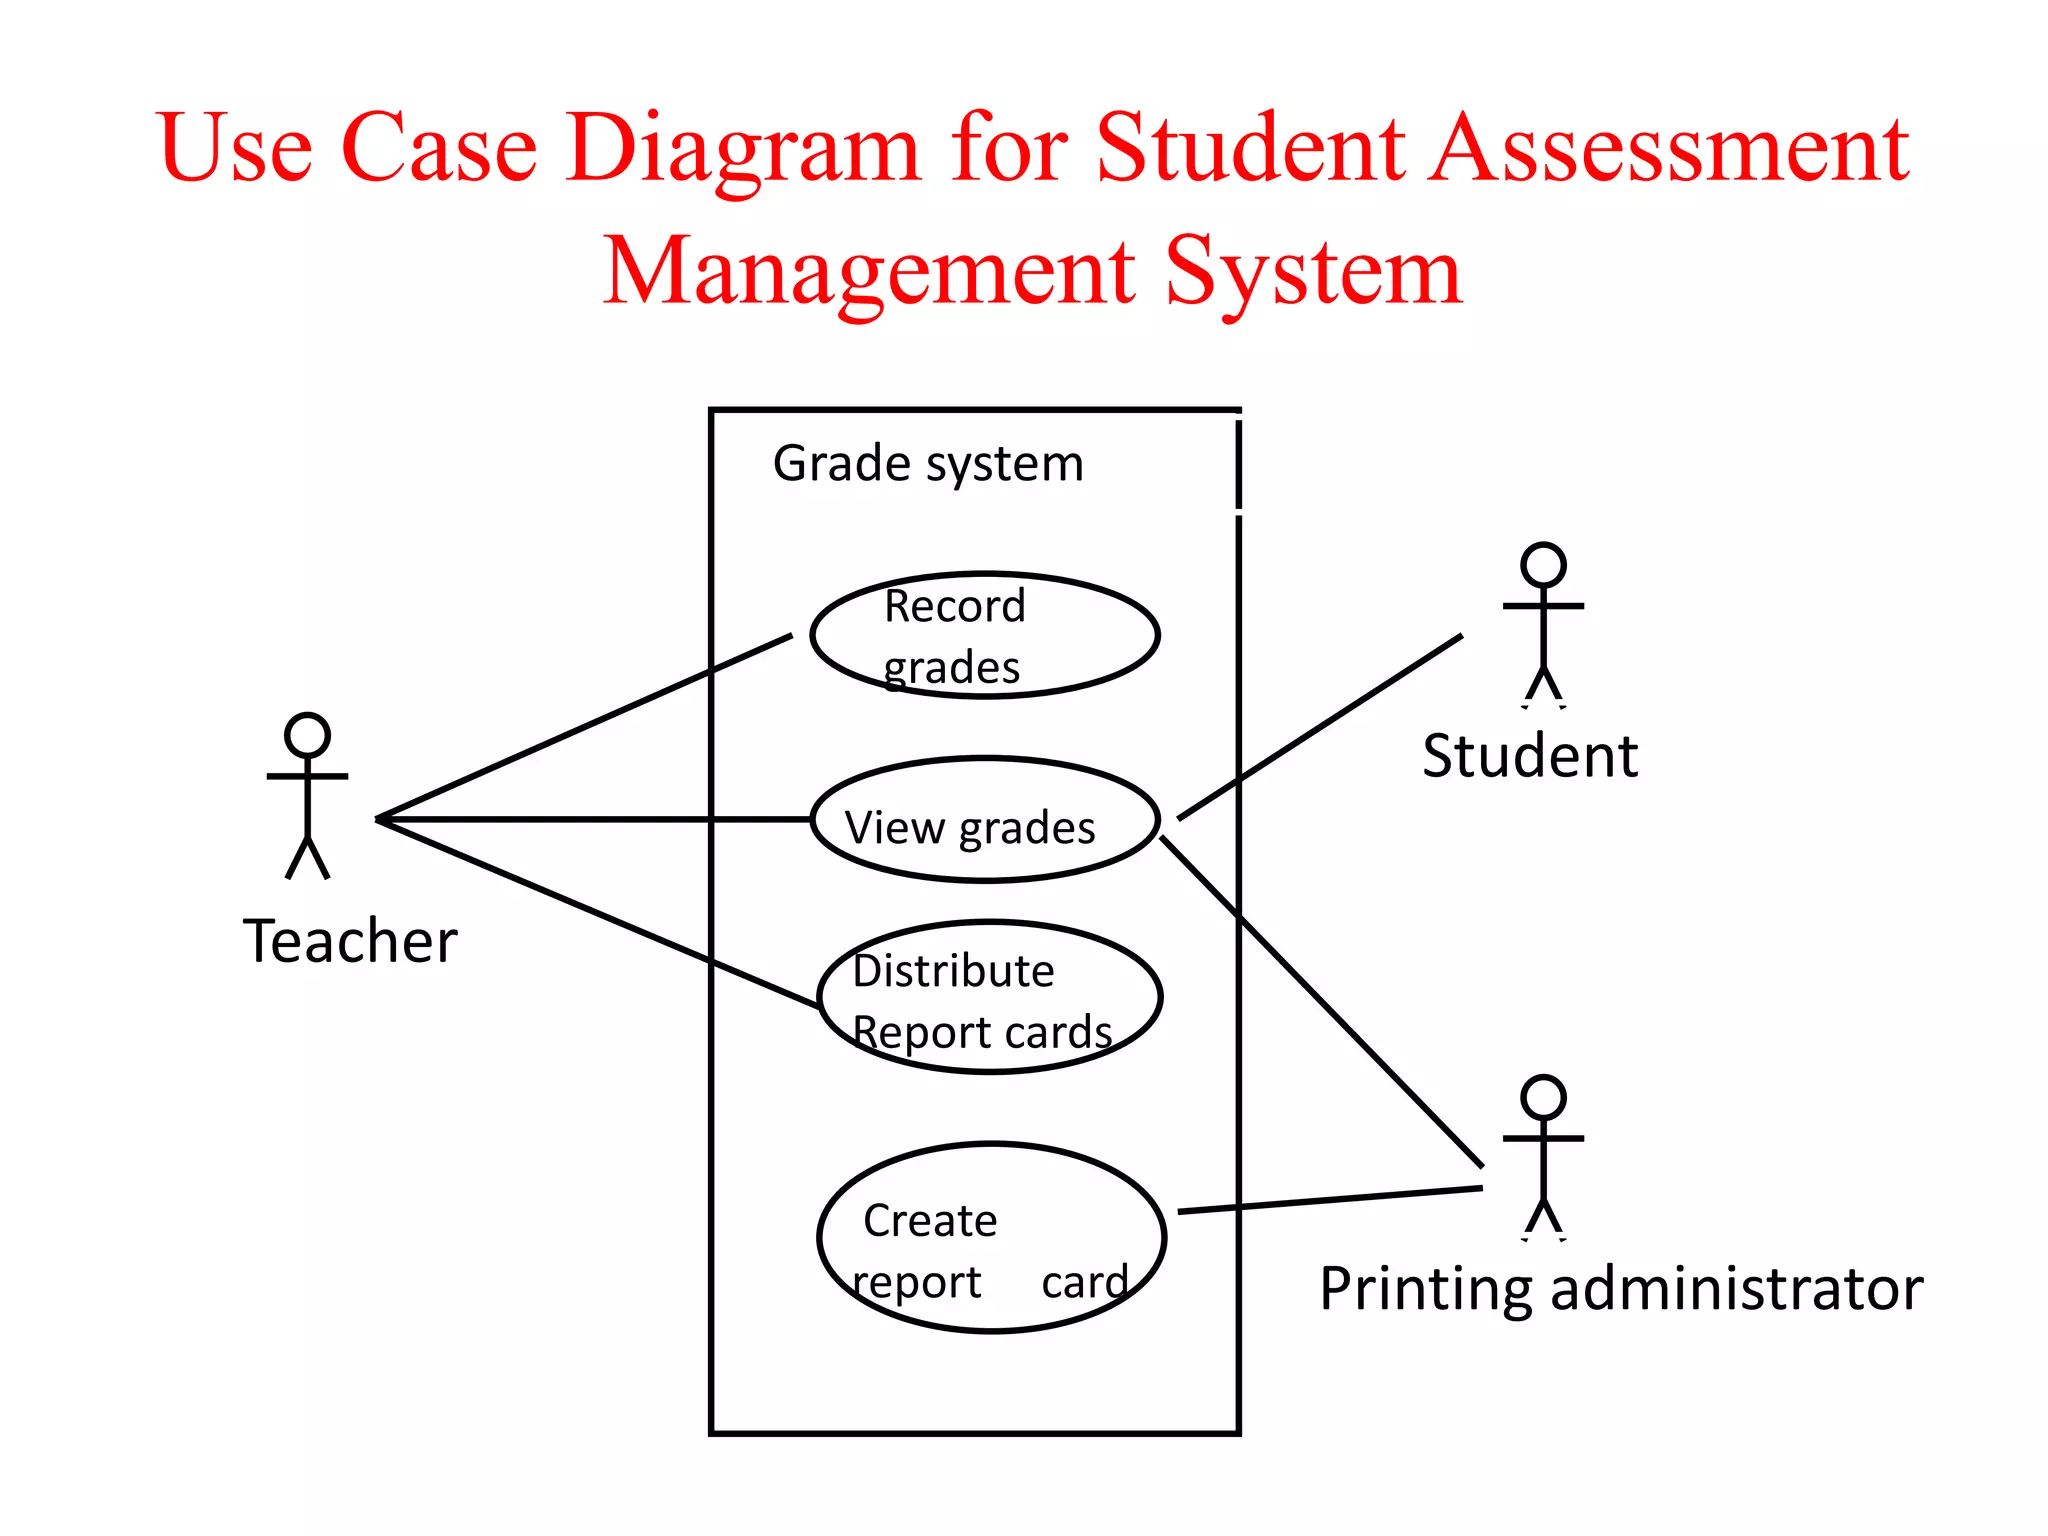
Prepared By:
Jesadiya shilpa
State Modeling & Interaction
Modeling
Introduction
• The State Model describes the sequence of
operations that occur in response to external
stimuli .
• The State Model consists of multiple state
diagrams, one for each class with temporal
behavior that is important to an application.
• The State Diagram is a graphical representation of
finite state machines that relates events and
states.
• Events represent external stimuli and state
represent values of objects.
Events, Conditions, and States
• Event: something that happens at a point in time
• Operator presses self-test button
• The alarm goes off
• Condition: something that has a duration
• The fuel level is high
• The alarm is on
• State : an abstraction of the attributes and links of an object (or entire
system)
• A state represent the current status of an object and it’s properties.
5
States
– At any given point in time, the system is in one state.
– It will remain in this state until an event occurs that
causes it to change state.
– A state is represented by a rounded rectangle
containing the name of the state.
– Special states:
• A black circle represents the start state
• A circle with a ring around it represents an end state
STATE MODELING : EVENT S
• Kinds of Events
• Signal Event: It is an explicit one-way transmission (sending or
receiving a signal) of information from one object to another.
• Change Event: It is an event that is caused by the satisfaction of a
boolean expression. When keyword is used followed by
parenthesized boolean expression.
Ex: when(room temperature < heating set point) ,
when(battery power < lower limit)
• Time Event: It is an event caused by the occurrence of an absolute
time or the elapse of a time interval. When or after keyword is used
followed by parenthesized expression involving time.
Ex: when(date=January 1, 2010) ,after(10 seconds)
7
Transitions
– A transition represents a change of state in
response to an event.
• It is considered to occur instantaneously.
– The label on each transition is the event that
causes the change of state.
8
State Diagrams
• A state diagram describes the behaviour of a
system, some part of a system, or an individual
object.
– At any given point in time, the system or object is in a
certain state.
• Being in a state means that it is will behave in a specific way
in response to any events that occur.
– Some events will cause the system to change state.
• In the new state, the system will behave in a different way to
events.
– A state diagram is a directed graph where the nodes
are states and the arcs are transitions.
State Diagram
• General form of state diagram.
A B
C
event-1
event-2event-2
STATE DIAGRAM: THREAD LIFE CYCLE
• The class model describes the class & objects in a
system and their relationship.
• The state model describes the life cycles of the
objects.
• The interaction model describes how the objects
interact.
• The interaction model starts with use cases that
are then elaborated with sequence and activity
diagrams
Interaction Models
• Use case: focuses on functionality of a system-
i.e, what a system does for users
• Sequence diagrams: shows the object that
interact and the time sequence of their
interactions
• Activity diagrams: elaborates important
processing steps
Interaction Models
Use Case Diagrams
• Use Case diagrams show the various activities
the users can perform on the system.
– System is something that performs a function.
• They model the dynamic aspects of the system.
• Provides a user’s perspective of the system.
Use Case Diagrams
• Use Case diagrams show the various activities the users
can perform on the system.
-System is something that performs a function.
• A use case is a model of the interaction between
External users of a software product (actors) and The
software product itself
• More precisely, an actor is a user playing a specific role
describing a set of user scenarios capturing user
requirements contract between end user and software
developers
Use Case Diagrams
Use-Case Diagrams
• Actors: A role that a user plays with respect to the system, including
human users and other systems. e.g., inanimate physical objects (e.g.
robot); an external system that needs some information from the
current system.
• Use case: A set of scenarios that describing an interaction between a
user and a system, including alternatives.
• System boundary: rectangle diagram representing the boundary
between the actors and the system.
• Association: Communication between an actor and a use case;
Represented by a solid line.
Actors
Actors
Could be human beings, other systems, timers
and clocks or hardware devices.
Actors that stimulate the system and are the
initiators of events are called primary actors
(active)
Actors that only receive stimuli from the system
are called secondary actors (passive)
Actors
Actors
Who/what will be interested in the system?
Who/what will want to change the data in the
system?
Who/what will want to interface with the system?
Who/what will want information from the
system?
• Use case is a particular activity a user can do
on the system.
• Is represented by an ellipse.
• Following are two use cases for a library
system.
Use Case Diagrams – Use Cases
ReserveBorrow
Construct Description Notation
Use-case A sequence of transactions performed
by a system that produces a measurable
result for a particular actor
Actor A coherent set of roles that users play
when interacting with these use cases
System
Boundary
The boundary between the physical
system and the actors who interact with
the physical system
23
Summary of Notations
2. Use Case Diagram
• General form of Use Case Diagram
Use-Case Diagram: Example
Actor
Association System boundary
Use-case
System name
Use Case Diagram – Example1 (Library)
A Library System.
client employee
supervisor
library system
borrw
reserve
Order title
Finepayment
Use Case Diagram for Student Assessment
Management System
Teacher
Student
Printing administrator
Grade system
Record
grades
View grades
Distribute
Report cards
Create
report card
Java

Java

  • 1.
  • 2.
    State Modeling &Interaction Modeling
  • 3.
    Introduction • The StateModel describes the sequence of operations that occur in response to external stimuli . • The State Model consists of multiple state diagrams, one for each class with temporal behavior that is important to an application. • The State Diagram is a graphical representation of finite state machines that relates events and states. • Events represent external stimuli and state represent values of objects.
  • 4.
    Events, Conditions, andStates • Event: something that happens at a point in time • Operator presses self-test button • The alarm goes off • Condition: something that has a duration • The fuel level is high • The alarm is on • State : an abstraction of the attributes and links of an object (or entire system) • A state represent the current status of an object and it’s properties.
  • 5.
    5 States – At anygiven point in time, the system is in one state. – It will remain in this state until an event occurs that causes it to change state. – A state is represented by a rounded rectangle containing the name of the state. – Special states: • A black circle represents the start state • A circle with a ring around it represents an end state
  • 6.
    STATE MODELING :EVENT S • Kinds of Events • Signal Event: It is an explicit one-way transmission (sending or receiving a signal) of information from one object to another. • Change Event: It is an event that is caused by the satisfaction of a boolean expression. When keyword is used followed by parenthesized boolean expression. Ex: when(room temperature < heating set point) , when(battery power < lower limit) • Time Event: It is an event caused by the occurrence of an absolute time or the elapse of a time interval. When or after keyword is used followed by parenthesized expression involving time. Ex: when(date=January 1, 2010) ,after(10 seconds)
  • 7.
    7 Transitions – A transitionrepresents a change of state in response to an event. • It is considered to occur instantaneously. – The label on each transition is the event that causes the change of state.
  • 8.
    8 State Diagrams • Astate diagram describes the behaviour of a system, some part of a system, or an individual object. – At any given point in time, the system or object is in a certain state. • Being in a state means that it is will behave in a specific way in response to any events that occur. – Some events will cause the system to change state. • In the new state, the system will behave in a different way to events. – A state diagram is a directed graph where the nodes are states and the arcs are transitions.
  • 9.
    State Diagram • Generalform of state diagram. A B C event-1 event-2event-2
  • 10.
  • 11.
    • The classmodel describes the class & objects in a system and their relationship. • The state model describes the life cycles of the objects. • The interaction model describes how the objects interact. • The interaction model starts with use cases that are then elaborated with sequence and activity diagrams Interaction Models
  • 12.
    • Use case:focuses on functionality of a system- i.e, what a system does for users • Sequence diagrams: shows the object that interact and the time sequence of their interactions • Activity diagrams: elaborates important processing steps Interaction Models
  • 13.
  • 15.
    • Use Casediagrams show the various activities the users can perform on the system. – System is something that performs a function. • They model the dynamic aspects of the system. • Provides a user’s perspective of the system. Use Case Diagrams
  • 16.
    • Use Casediagrams show the various activities the users can perform on the system. -System is something that performs a function. • A use case is a model of the interaction between External users of a software product (actors) and The software product itself • More precisely, an actor is a user playing a specific role describing a set of user scenarios capturing user requirements contract between end user and software developers Use Case Diagrams
  • 17.
    Use-Case Diagrams • Actors:A role that a user plays with respect to the system, including human users and other systems. e.g., inanimate physical objects (e.g. robot); an external system that needs some information from the current system. • Use case: A set of scenarios that describing an interaction between a user and a system, including alternatives. • System boundary: rectangle diagram representing the boundary between the actors and the system. • Association: Communication between an actor and a use case; Represented by a solid line.
  • 18.
    Actors Actors Could be humanbeings, other systems, timers and clocks or hardware devices. Actors that stimulate the system and are the initiators of events are called primary actors (active) Actors that only receive stimuli from the system are called secondary actors (passive)
  • 19.
    Actors Actors Who/what will beinterested in the system? Who/what will want to change the data in the system? Who/what will want to interface with the system? Who/what will want information from the system?
  • 21.
    • Use caseis a particular activity a user can do on the system. • Is represented by an ellipse. • Following are two use cases for a library system. Use Case Diagrams – Use Cases ReserveBorrow
  • 23.
    Construct Description Notation Use-caseA sequence of transactions performed by a system that produces a measurable result for a particular actor Actor A coherent set of roles that users play when interacting with these use cases System Boundary The boundary between the physical system and the actors who interact with the physical system 23 Summary of Notations
  • 24.
    2. Use CaseDiagram • General form of Use Case Diagram
  • 27.
    Use-Case Diagram: Example Actor AssociationSystem boundary Use-case System name
  • 28.
    Use Case Diagram– Example1 (Library) A Library System. client employee supervisor library system borrw reserve Order title Finepayment
  • 29.
    Use Case Diagramfor Student Assessment Management System Teacher Student Printing administrator Grade system Record grades View grades Distribute Report cards Create report card