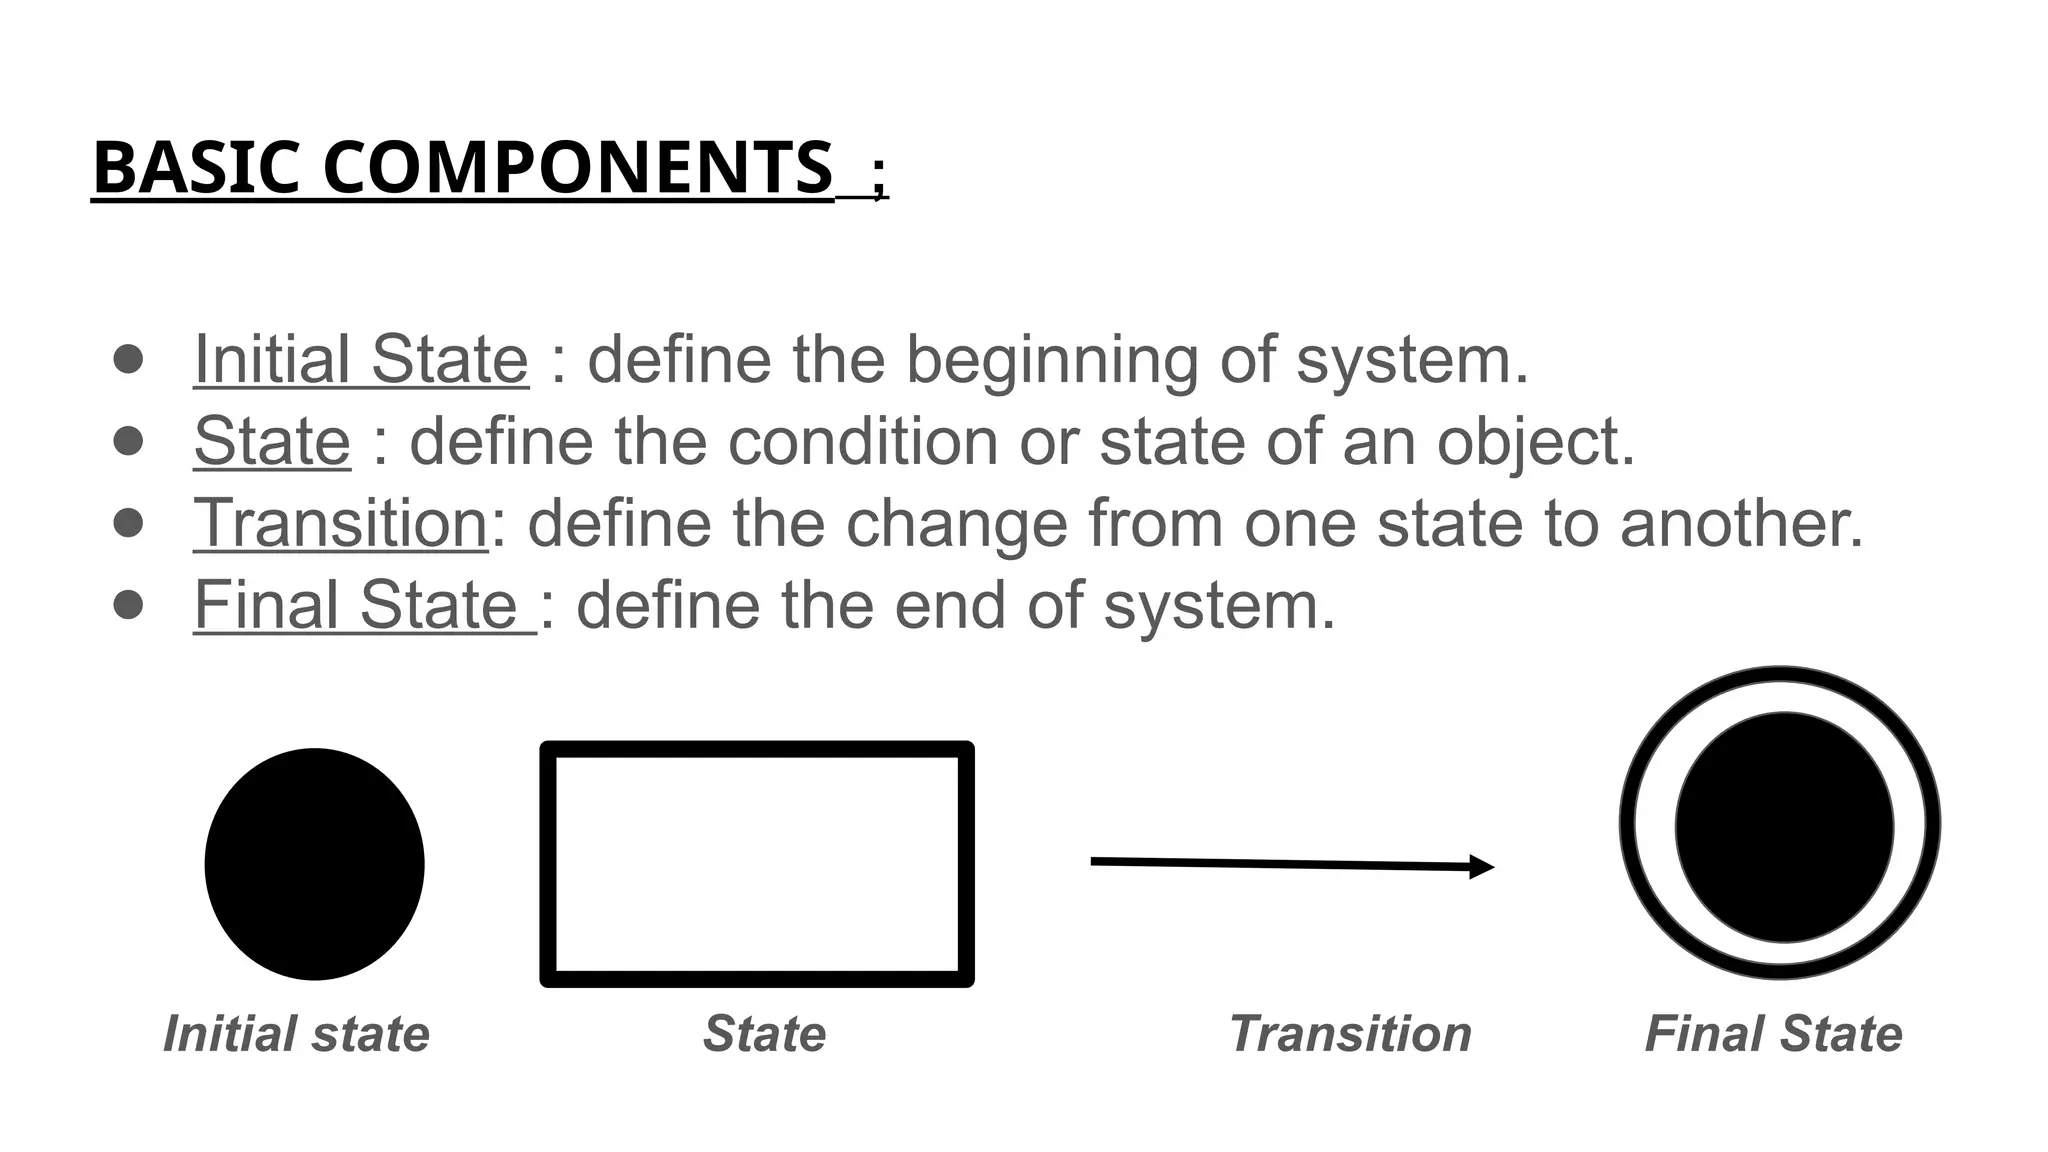
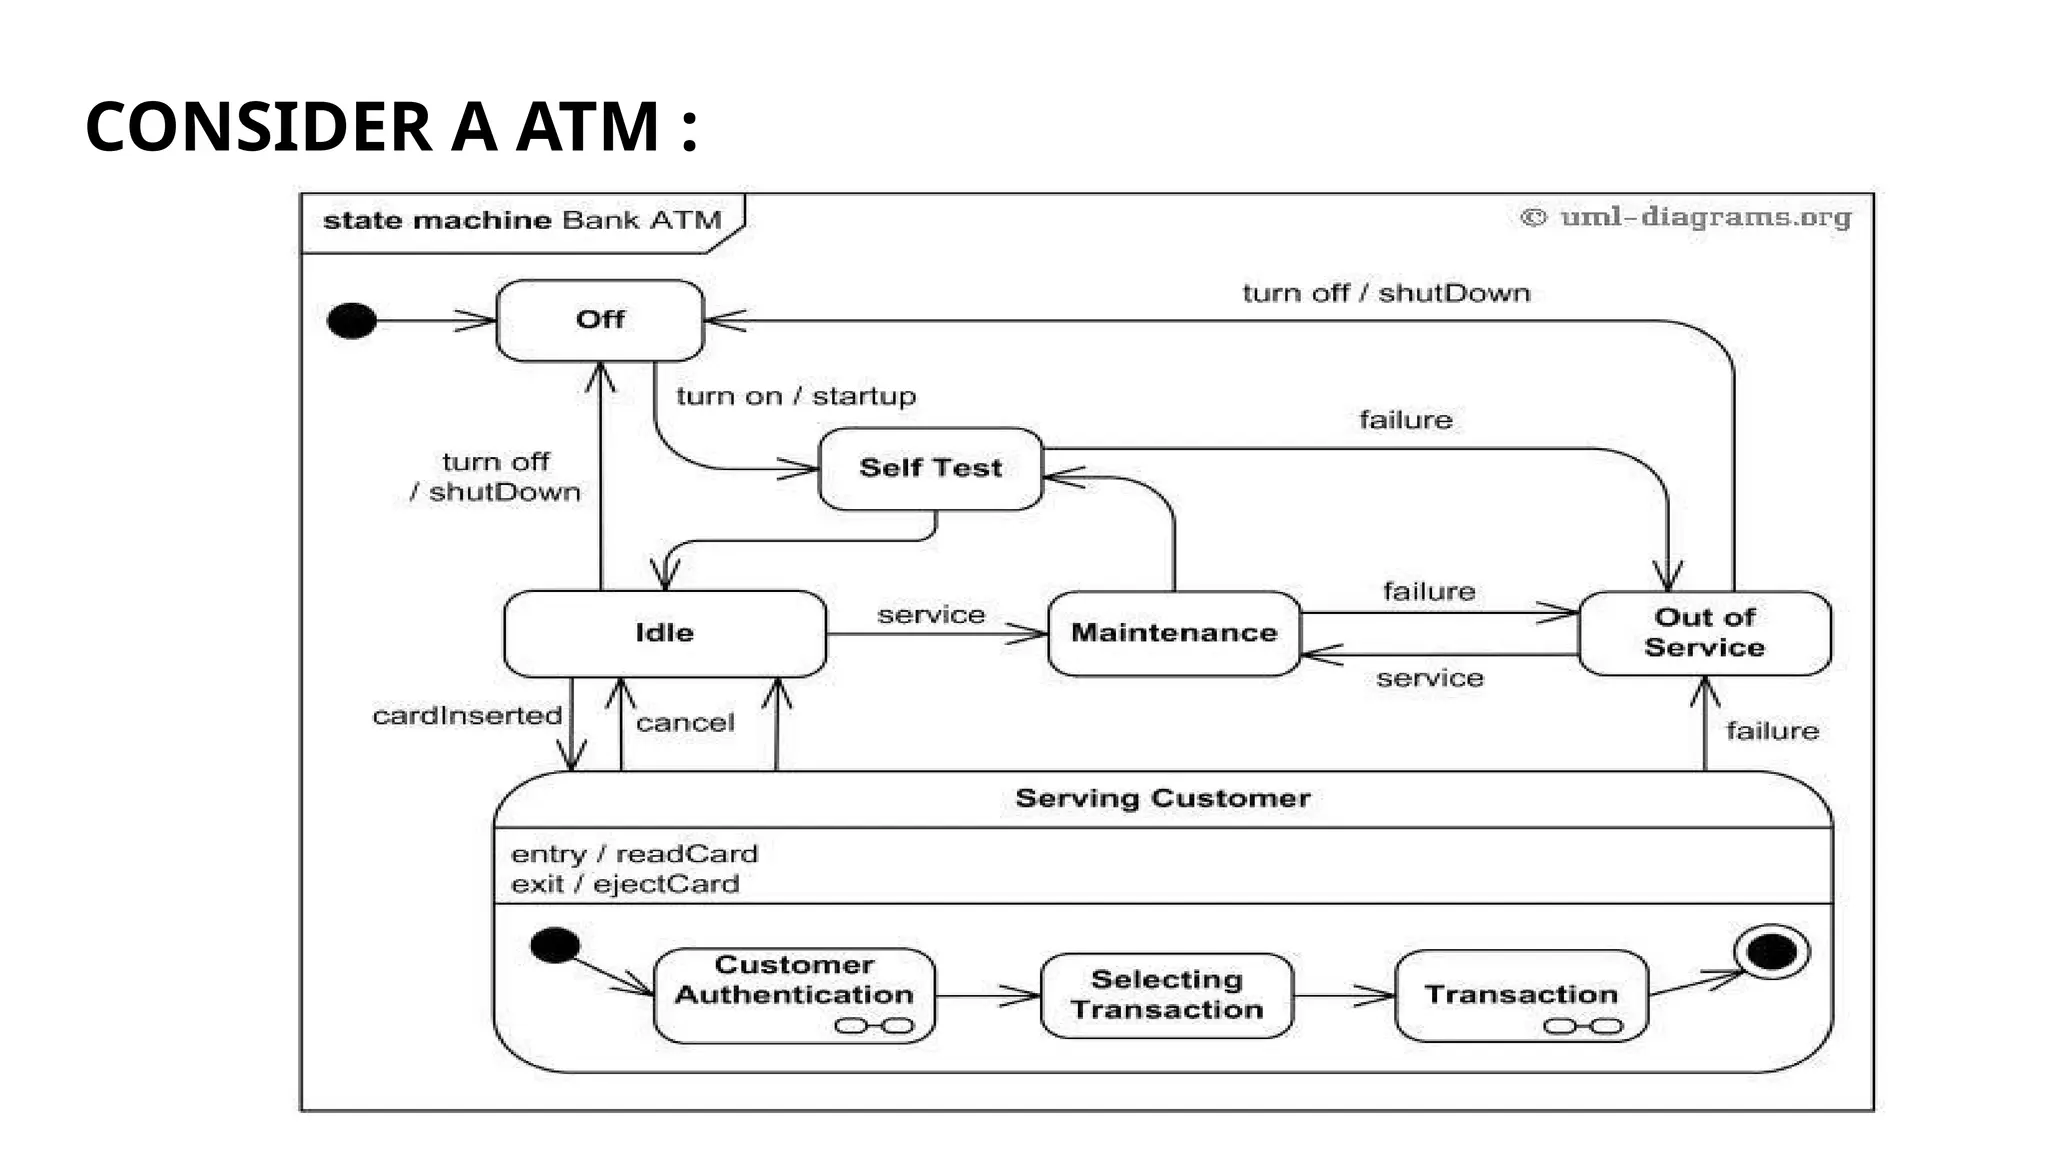
STATE CHART
DIAGRAM
DEFINITION:
● State transition diagram / State machine diagram.
● A visual representation of a system's behavior, showing
the different states it can be in and the transitions between
those states.
● Describe the flow of control from one state to another.
● The state changes when an event is triggered.
PURPOSE :
● Model complex systems' behavior.
● Define system states and transitions.
● Analyze and design system interactions.
● To model dynamic aspect of a system.
● To define different state of an object.
BASIC COMPONENTS ;
● Initial State : define the beginning of system.
● State : define the condition or state of an object.
● Transition: define the change from one state to another.
● Final State : define the end of system.
Initial state State Transition Final State
To draw a State diagram:
● Identify the object to be analysed
● Identify states
● Identify the events
CONSIDER A ATM :

State chart diagram... Software Engineering .pptx

  • 1.
  • 2.
    DEFINITION: ● State transitiondiagram / State machine diagram. ● A visual representation of a system's behavior, showing the different states it can be in and the transitions between those states. ● Describe the flow of control from one state to another. ● The state changes when an event is triggered.
  • 3.
    PURPOSE : ● Modelcomplex systems' behavior. ● Define system states and transitions. ● Analyze and design system interactions. ● To model dynamic aspect of a system. ● To define different state of an object.
  • 4.
    BASIC COMPONENTS ; ●Initial State : define the beginning of system. ● State : define the condition or state of an object. ● Transition: define the change from one state to another. ● Final State : define the end of system. Initial state State Transition Final State
  • 5.
    To draw aState diagram: ● Identify the object to be analysed ● Identify states ● Identify the events
  • 6.