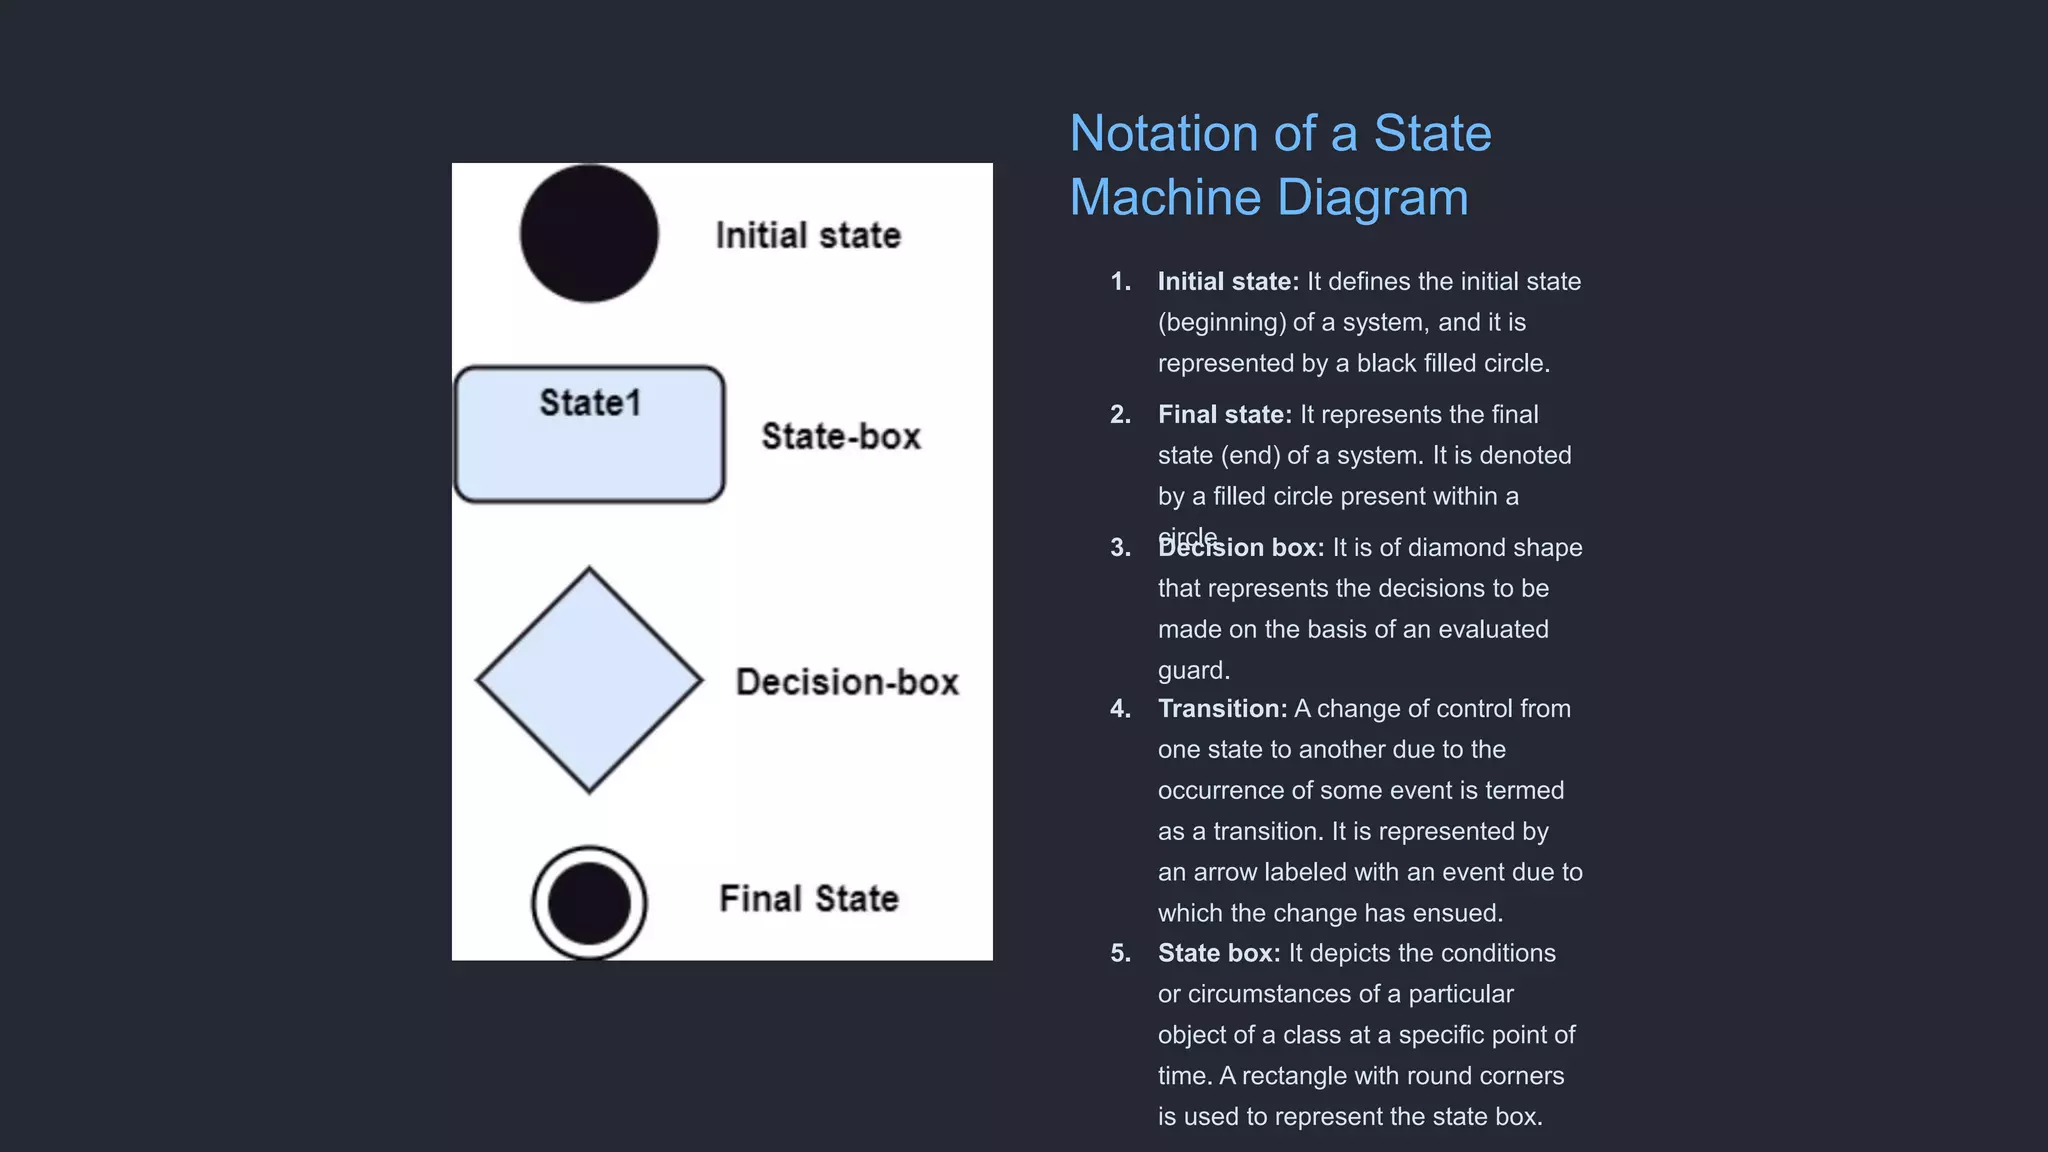
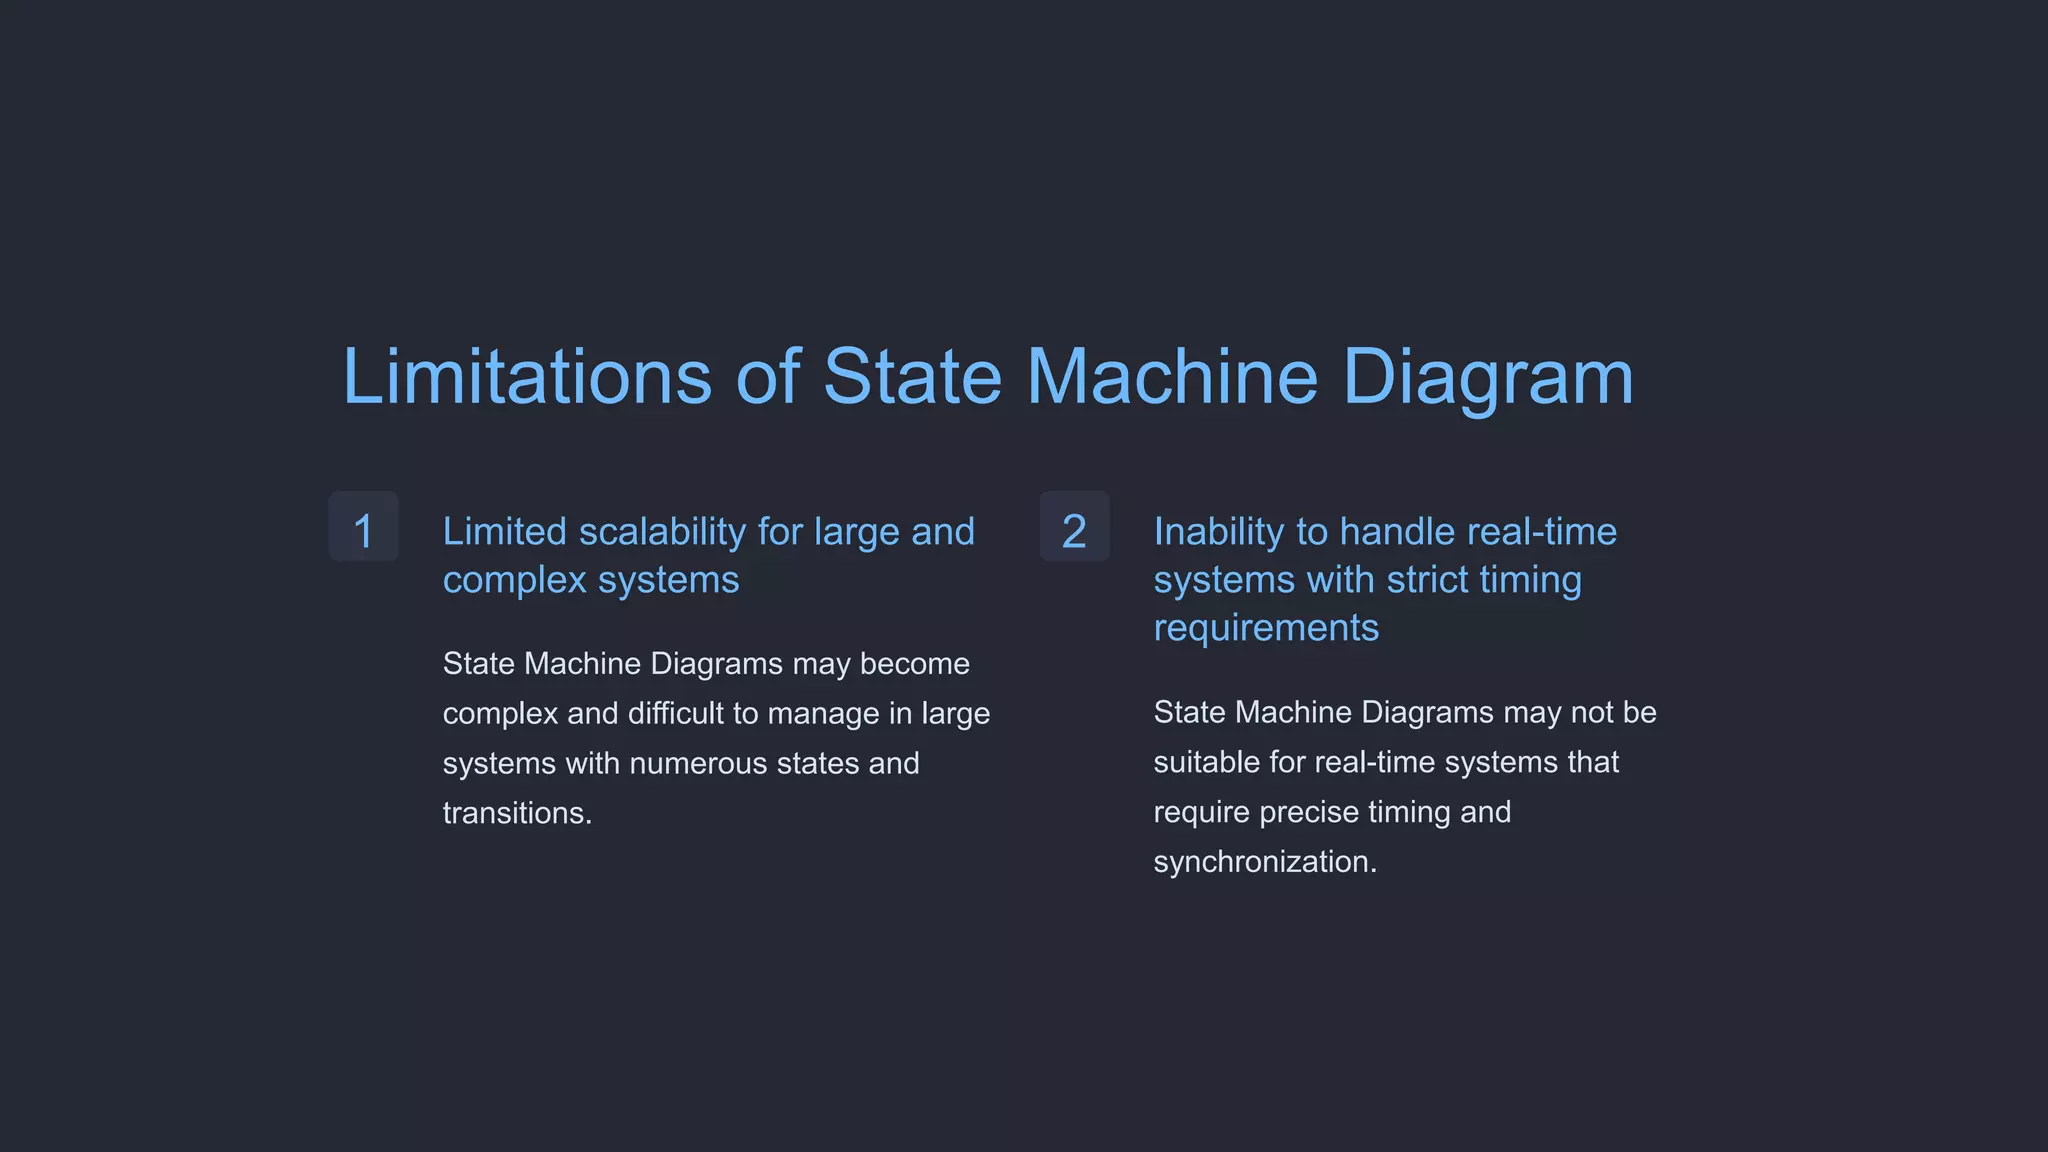
State Machine Diagram
Subject: SOFTWARE ENGINEERING
Faculty: PROF. VIMAL KUMAR VAGHELA
L.D. College of Engineering
Definition
The state machine diagram is also called the State chart or State Transition diagram, which shows
the order of states underwent by an object within the system. It captures the software system's
behaviour, its components: states, transitions, and events.
States: Definition and Examples
A state in a State Machine Diagram represents a condition or situation that a system can be in.
Examples include "idle," "processing," and "error."
Transitions: Definition and Examples
Transitions in a State Machine Diagram show the events or triggers that cause a system to move
from one state to another. Examples include "click," "timeout," and "error occurred."
Events: Definition and Examples
Events in a State Machine Diagram are the occurrences or stimuli that trigger state transitions.
Examples include "button press," "message received," and "data update."
Notation of a State
Machine Diagram
1. Initial state: It defines the initial state
(beginning) of a system, and it is
represented by a black filled circle.
2. Final state: It represents the final
state (end) of a system. It is denoted
by a filled circle present within a
circle.
3. Decision box: It is of diamond shape
that represents the decisions to be
made on the basis of an evaluated
guard.
4. Transition: A change of control from
one state to another due to the
occurrence of some event is termed
as a transition. It is represented by
an arrow labeled with an event due to
which the change has ensued.
5. State box: It depicts the conditions
or circumstances of a particular
object of a class at a specific point of
time. A rectangle with round corners
is used to represent the state box.
Types of State
The UML consist of three states:
1. Simple state: It does not constitute any substructure.
2. Composite state: It consists of nested states (substates), such that it does not contain
more than one initial state and one final state. It can be nested to any level.
3. Submachine state: The submachine state is semantically identical to the composite state,
but it can be reused.
Example
Advantages of State Machine Diagram
1 Clear visualization
of system
behavior
State Machine
Diagrams provide a
visual representation
of how a system
behaves, making it
easier to understand
and analyze.
2 Easy identification
of complex
system states and
transitions
State Machine
Diagrams allow for the
identification of
complex system states
and the transitions
between them,
simplifying system
analysis and design.
3 Simplicity in
representing
dynamic behavior
of systems
State Machine
Diagrams provide a
simple and intuitive
way to represent the
dynamic behavior of
systems, making it
easier to communicate
and document system
processes.
Limitations of State Machine Diagram
1 Limited scalability for large and
complex systems
State Machine Diagrams may become
complex and difficult to manage in large
systems with numerous states and
transitions.
2 Inability to handle real-time
systems with strict timing
requirements
State Machine Diagrams may not be
suitable for real-time systems that
require precise timing and
synchronization.
Conclusion: Importance of State
Machine Diagram
State Machine Diagrams play a crucial role in software engineering by providing a visual
representation of system behavior, facilitating system analysis and design.
THANK YOU
Name: Ujash Solanki
Div: C
Batch: SE2
Enrollment: 220283107037
Subject: Software Engineering

State-Machine-Diagram.pptx

  • 1.
    State Machine Diagram Subject:SOFTWARE ENGINEERING Faculty: PROF. VIMAL KUMAR VAGHELA L.D. College of Engineering
  • 2.
    Definition The state machinediagram is also called the State chart or State Transition diagram, which shows the order of states underwent by an object within the system. It captures the software system's behaviour, its components: states, transitions, and events.
  • 3.
    States: Definition andExamples A state in a State Machine Diagram represents a condition or situation that a system can be in. Examples include "idle," "processing," and "error." Transitions: Definition and Examples Transitions in a State Machine Diagram show the events or triggers that cause a system to move from one state to another. Examples include "click," "timeout," and "error occurred." Events: Definition and Examples Events in a State Machine Diagram are the occurrences or stimuli that trigger state transitions. Examples include "button press," "message received," and "data update."
  • 4.
    Notation of aState Machine Diagram 1. Initial state: It defines the initial state (beginning) of a system, and it is represented by a black filled circle. 2. Final state: It represents the final state (end) of a system. It is denoted by a filled circle present within a circle. 3. Decision box: It is of diamond shape that represents the decisions to be made on the basis of an evaluated guard. 4. Transition: A change of control from one state to another due to the occurrence of some event is termed as a transition. It is represented by an arrow labeled with an event due to which the change has ensued. 5. State box: It depicts the conditions or circumstances of a particular object of a class at a specific point of time. A rectangle with round corners is used to represent the state box.
  • 5.
    Types of State TheUML consist of three states: 1. Simple state: It does not constitute any substructure. 2. Composite state: It consists of nested states (substates), such that it does not contain more than one initial state and one final state. It can be nested to any level. 3. Submachine state: The submachine state is semantically identical to the composite state, but it can be reused.
  • 6.
  • 7.
    Advantages of StateMachine Diagram 1 Clear visualization of system behavior State Machine Diagrams provide a visual representation of how a system behaves, making it easier to understand and analyze. 2 Easy identification of complex system states and transitions State Machine Diagrams allow for the identification of complex system states and the transitions between them, simplifying system analysis and design. 3 Simplicity in representing dynamic behavior of systems State Machine Diagrams provide a simple and intuitive way to represent the dynamic behavior of systems, making it easier to communicate and document system processes.
  • 8.
    Limitations of StateMachine Diagram 1 Limited scalability for large and complex systems State Machine Diagrams may become complex and difficult to manage in large systems with numerous states and transitions. 2 Inability to handle real-time systems with strict timing requirements State Machine Diagrams may not be suitable for real-time systems that require precise timing and synchronization.
  • 9.
    Conclusion: Importance ofState Machine Diagram State Machine Diagrams play a crucial role in software engineering by providing a visual representation of system behavior, facilitating system analysis and design.
  • 10.
    THANK YOU Name: UjashSolanki Div: C Batch: SE2 Enrollment: 220283107037 Subject: Software Engineering