Download as PDF, PPTX

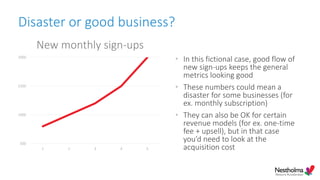
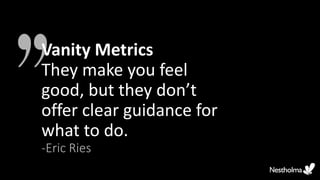
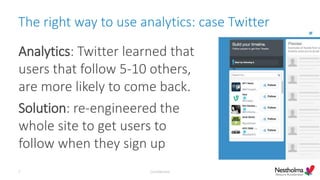

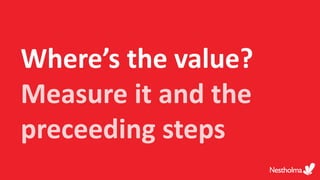

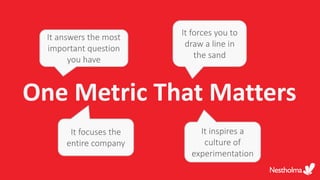

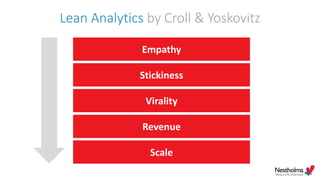
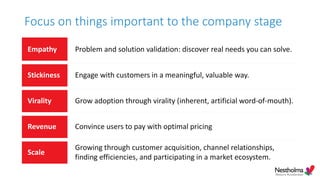


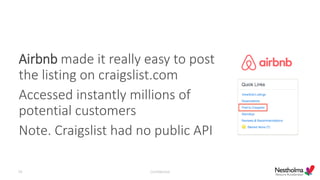


This document discusses metrics and analytics for startups. It provides examples of metrics to measure at different stages of growth, including empathy, stickiness, virality, revenue, and scale. It emphasizes the importance of choosing one metric that matters for a given business stage and focusing on actionable metrics. Cohort analysis and funnels are presented as useful tools for understanding user behavior over time. Growth hacking techniques from successful startups like Airbnb, Dropbox, and LinkedIn are highlighted. Throughout, the document stresses testing hypotheses and using data and experimentation to optimize business performance.


